Curate the chart.By rule.Not by taste.
Make any chart read like a $10k terminal —and finally stop your labels colliding.
Launch price · full 7-day refund, before you download
v1.1.0 · actively maintained · free updates for life
Pine Chart Studio · design your chart like a system, not a doodle
Make any indicator's chart read like a $10k terminal.
Most indicators dump lines and labels on top of each other until the chart is unreadable. Chart Studio is a drop-in design layer that takes any system's levels and signals and renders them clean, tiered and colourblind-safe — labels that never collide, a ★ where levels agree. It changes how your chart looks, never what it trades. And it's built the honest way — every layout is mocked and measured in the browser first, then ported to compile-verified Pine.
See it work
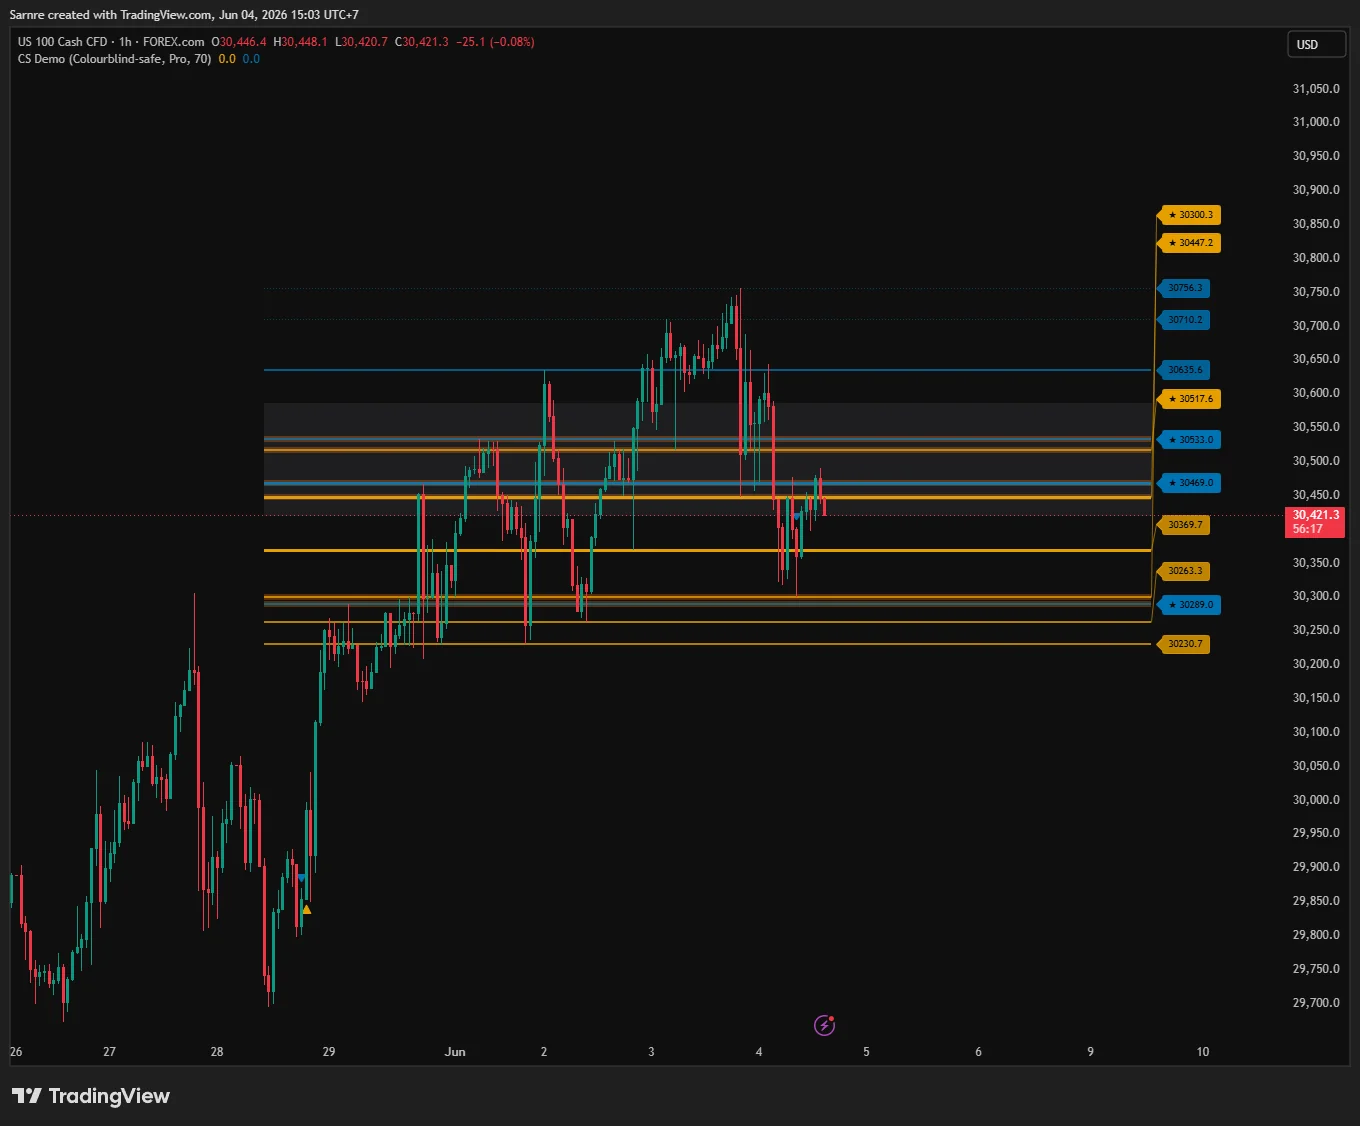
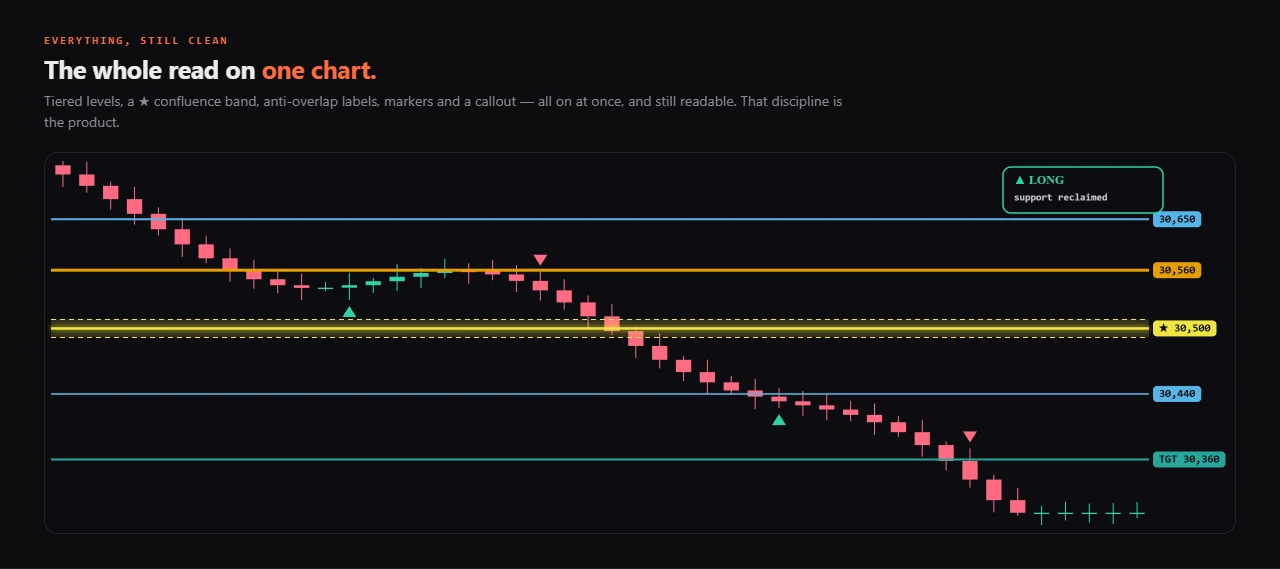
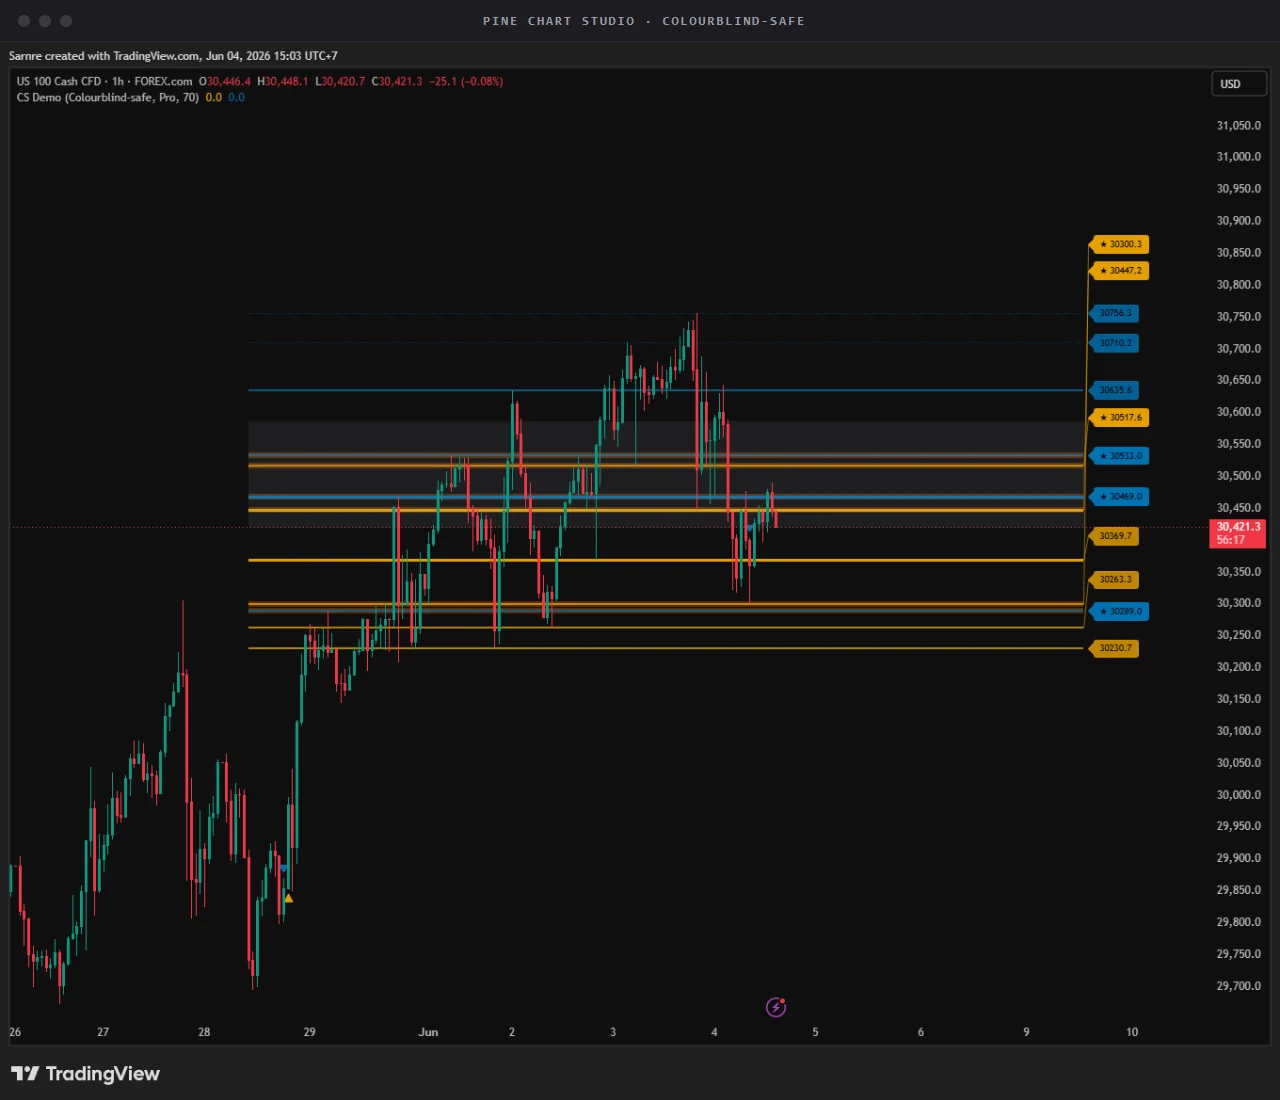
One frame shows the whole model: tiered, role-coloured levels, labels that never overlap, and a ★ where signals agree.
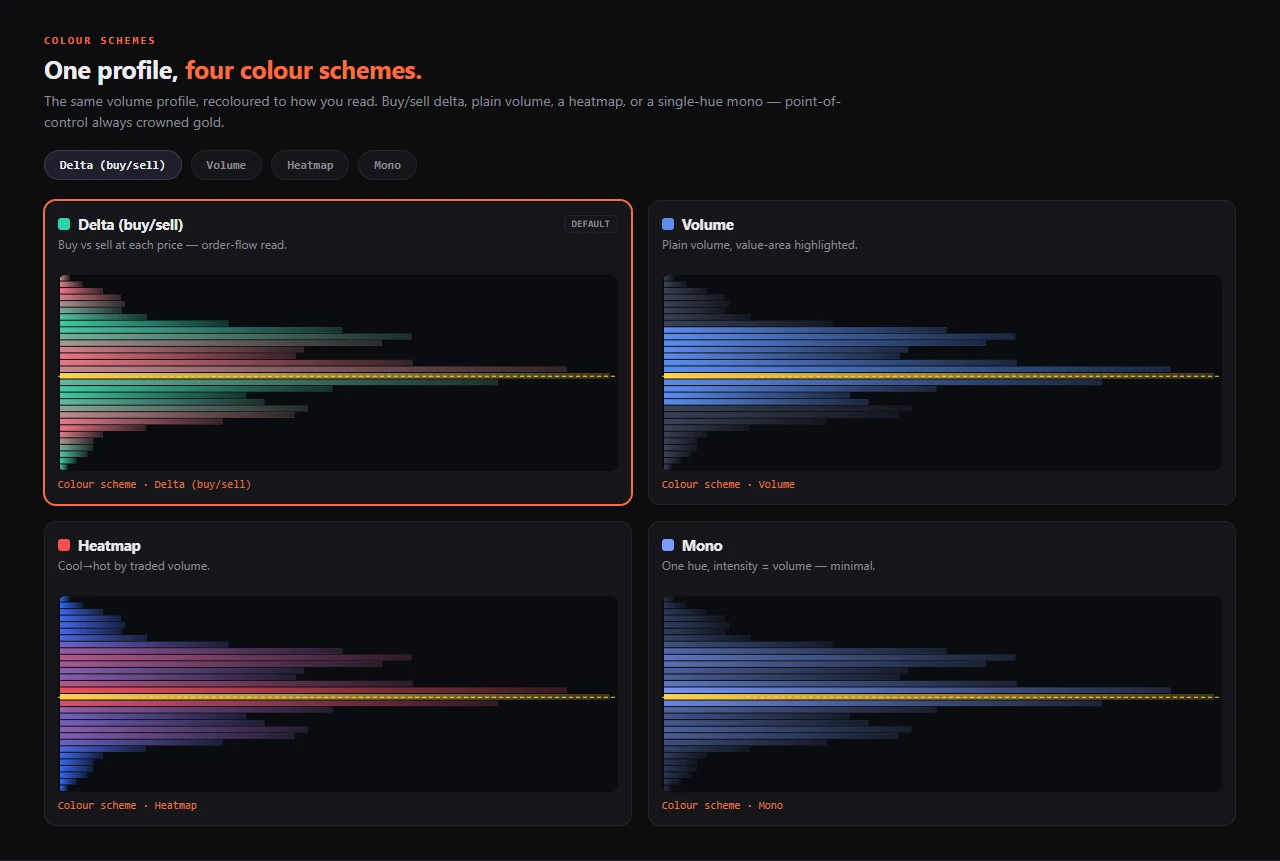
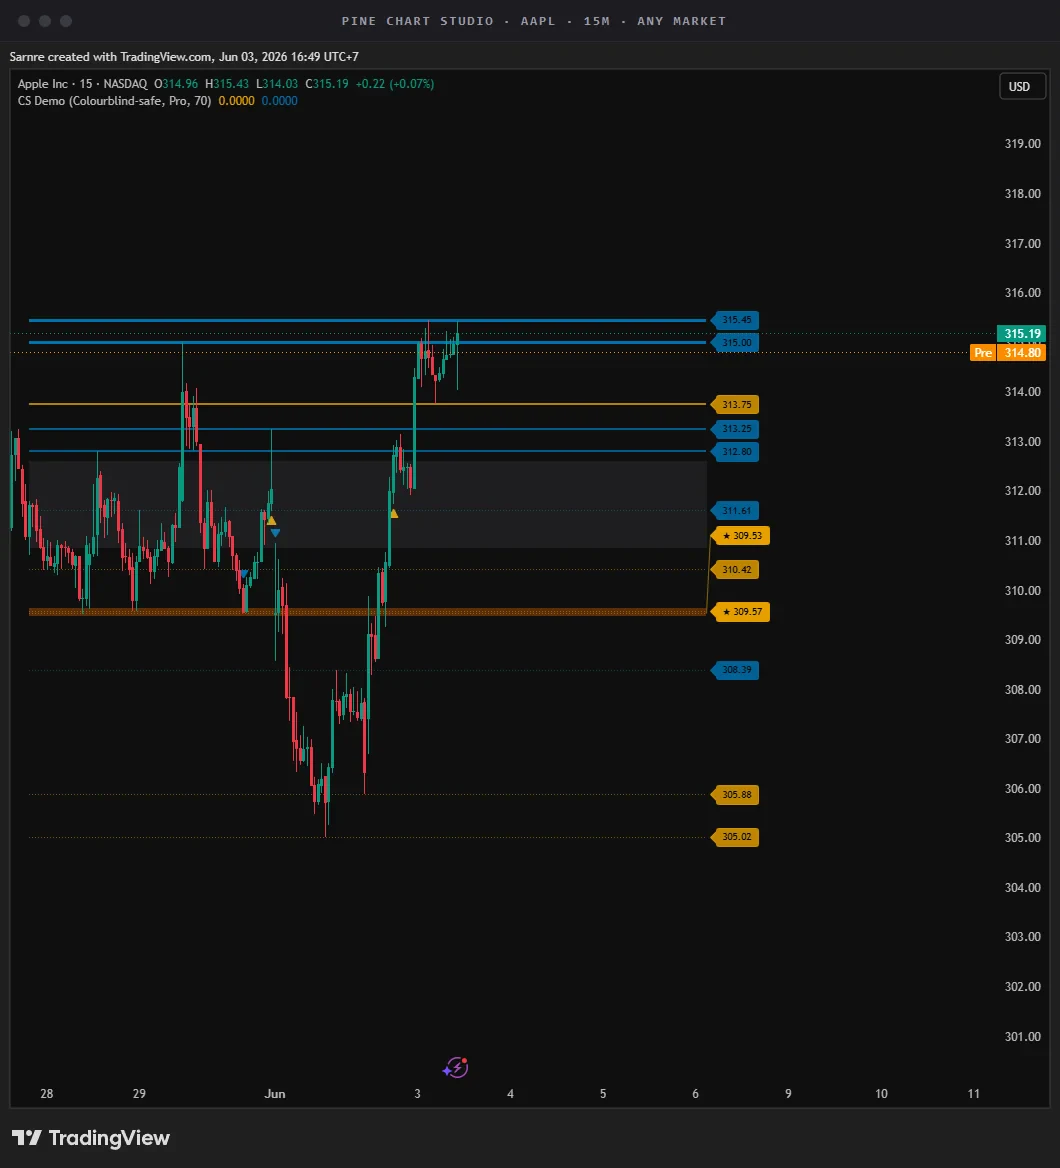
What every other indicator does — and what this does instead
| A normal indicator | Chart Studio | |
|---|---|---|
| Labels | pile up and overlap until unreadable | an anti-overlap manager nudges each one clear |
| Levels | all drawn equally loud | tiered by importance — the closest is the boldest |
| Agreement | you eyeball where things line up | a ★ marks where levels actually agree |
| Colour | red/green only — hard for many to read | colourblind-safe by default (Okabe-Ito) |
| Your edge | — | untouched — it's a render layer, never your logic |
Four governors curate the chart for you
The chart keeps itself clean automatically — no manual fiddling:
- Anti-overlap labelsNudges colliding price tags apart so every one stays readable — the one thing native TradingView can't do.
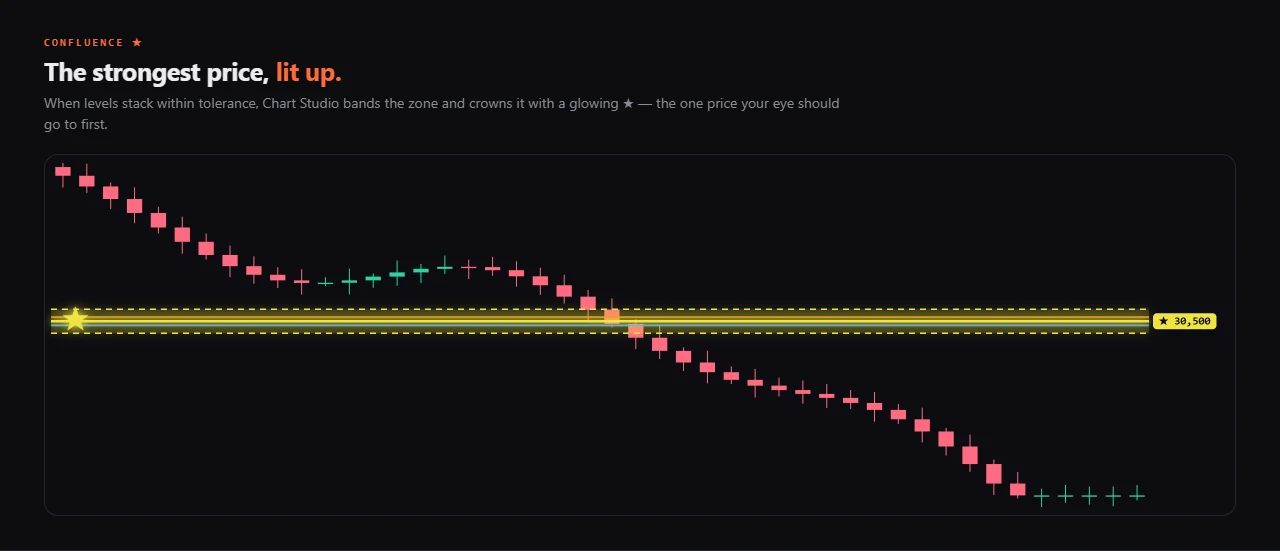
- Confluence (★)Marks the levels that agree, so your eye goes straight to where the chart is strongest.
- FocusThe live level is bright; stale and distant ones fade — one clear “now”, not ten equally-loud lines.
- BudgetCulls by importance under TradingView's object cap, so a busy system never silently fails to draw.
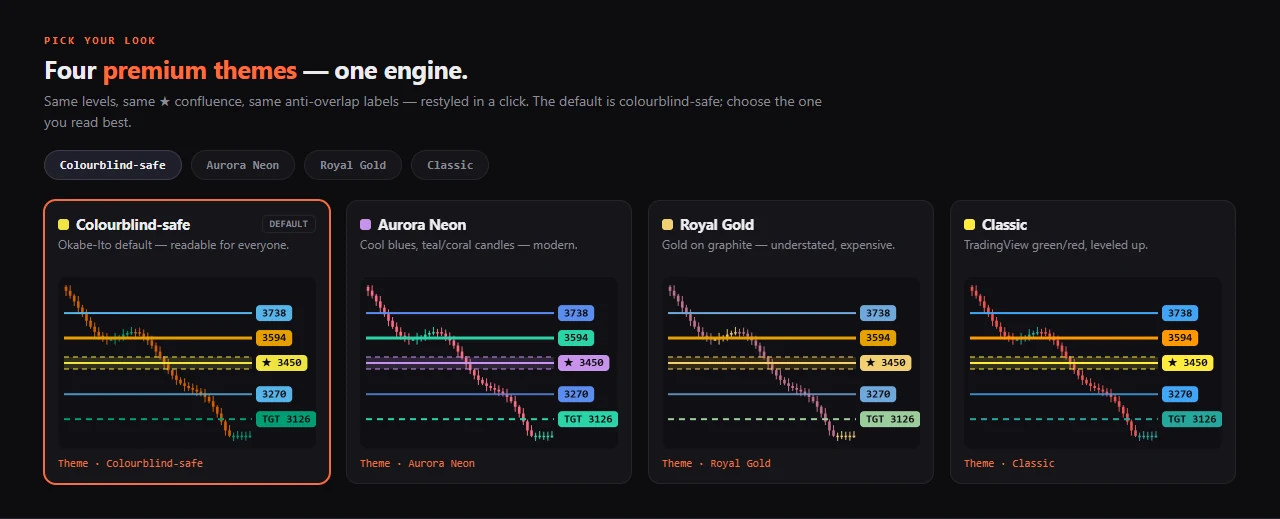
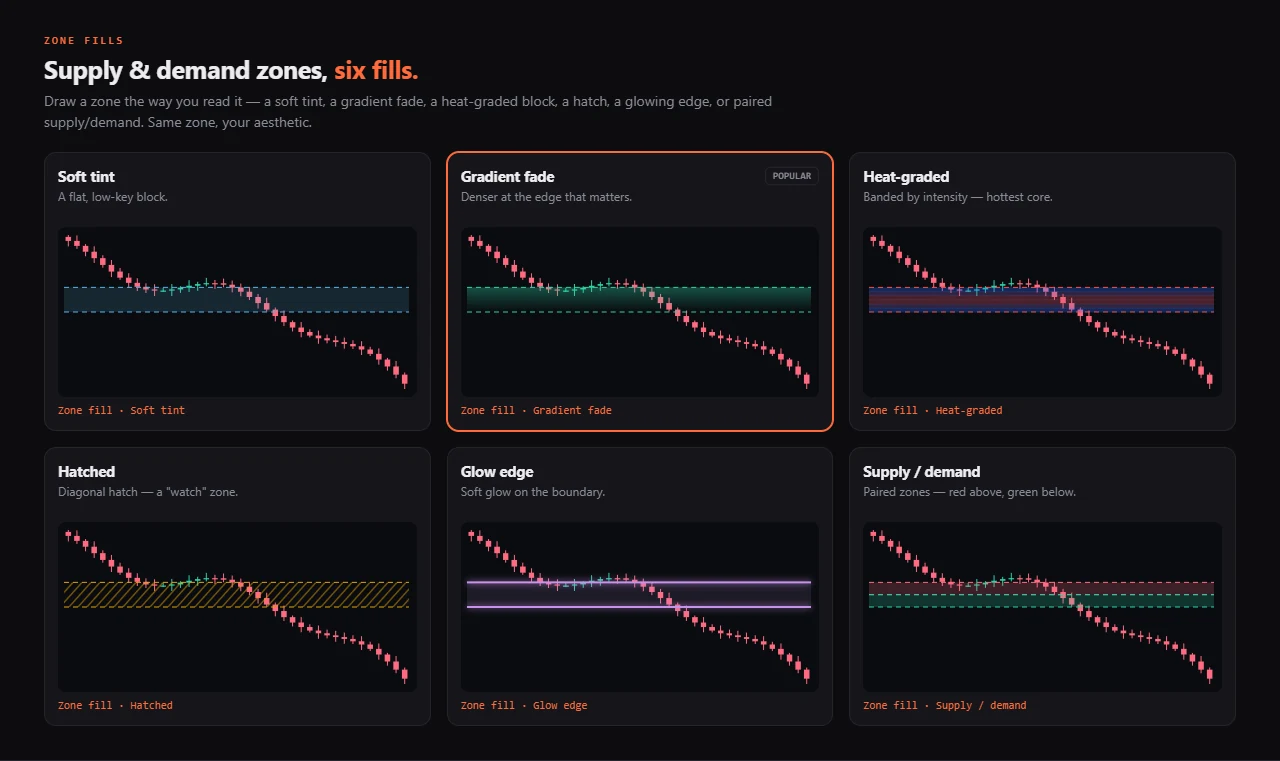
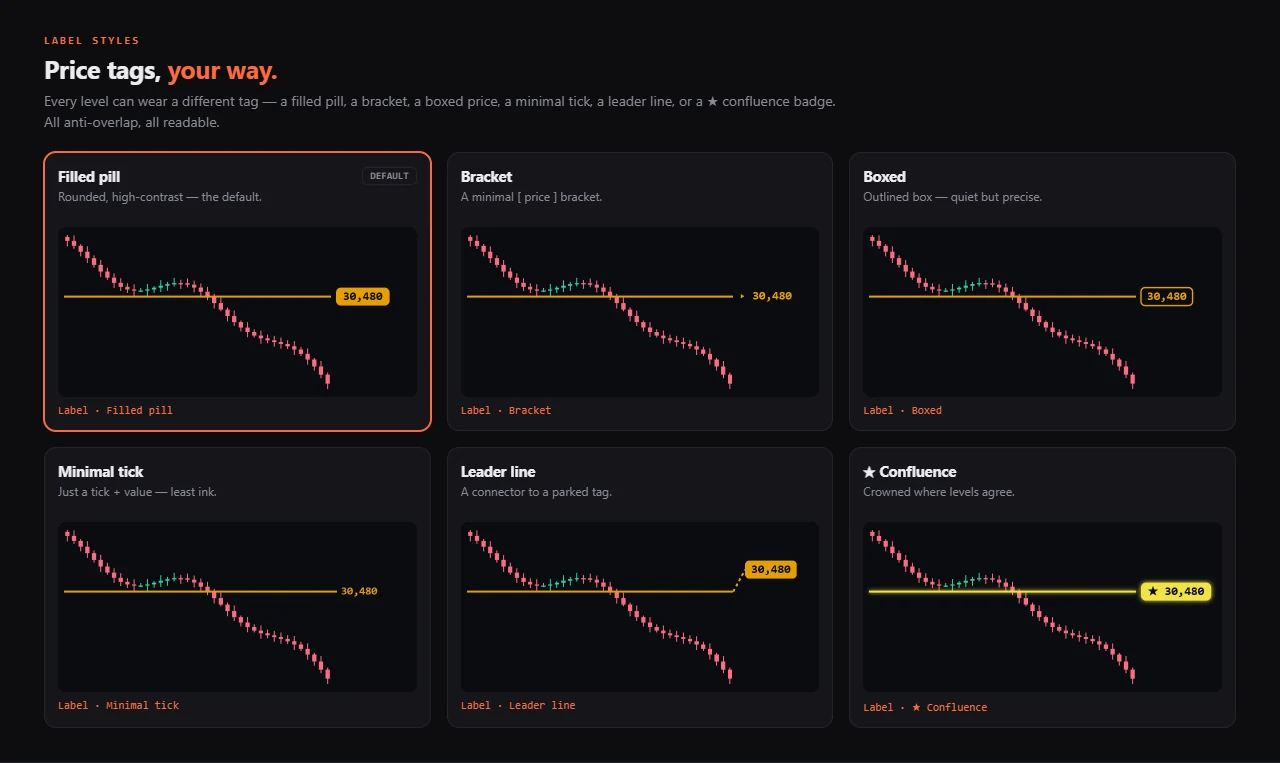
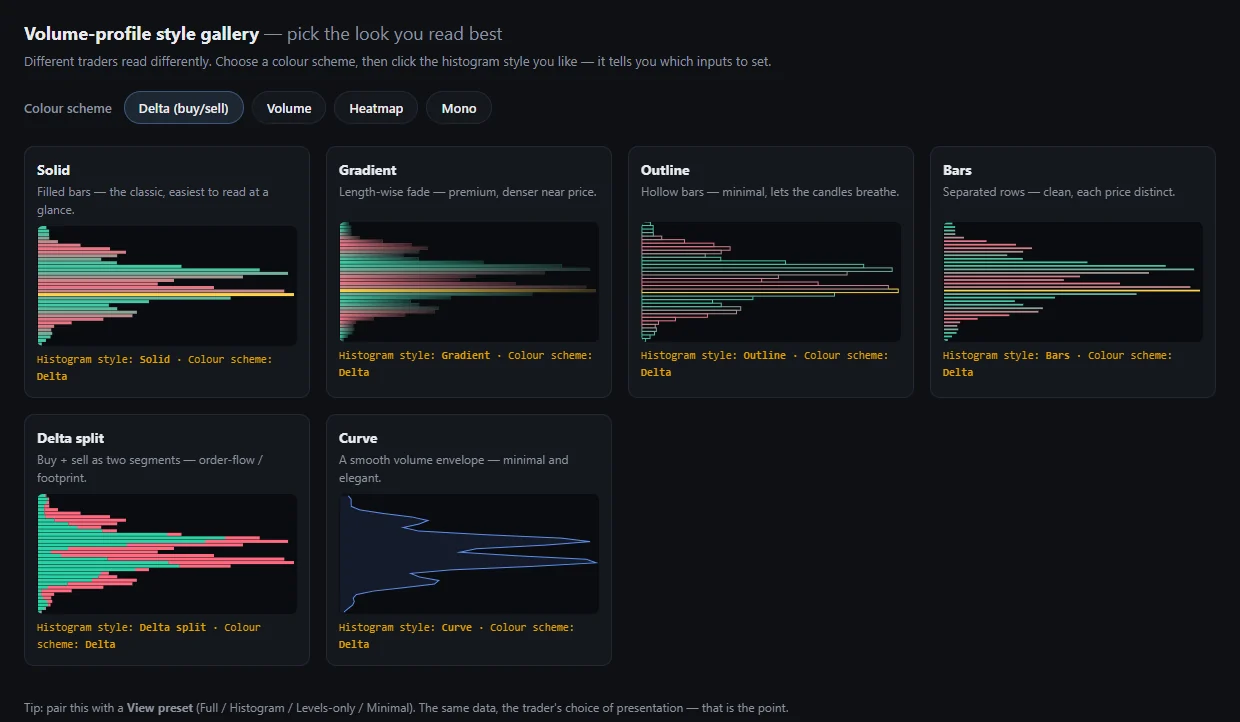
Choose your look
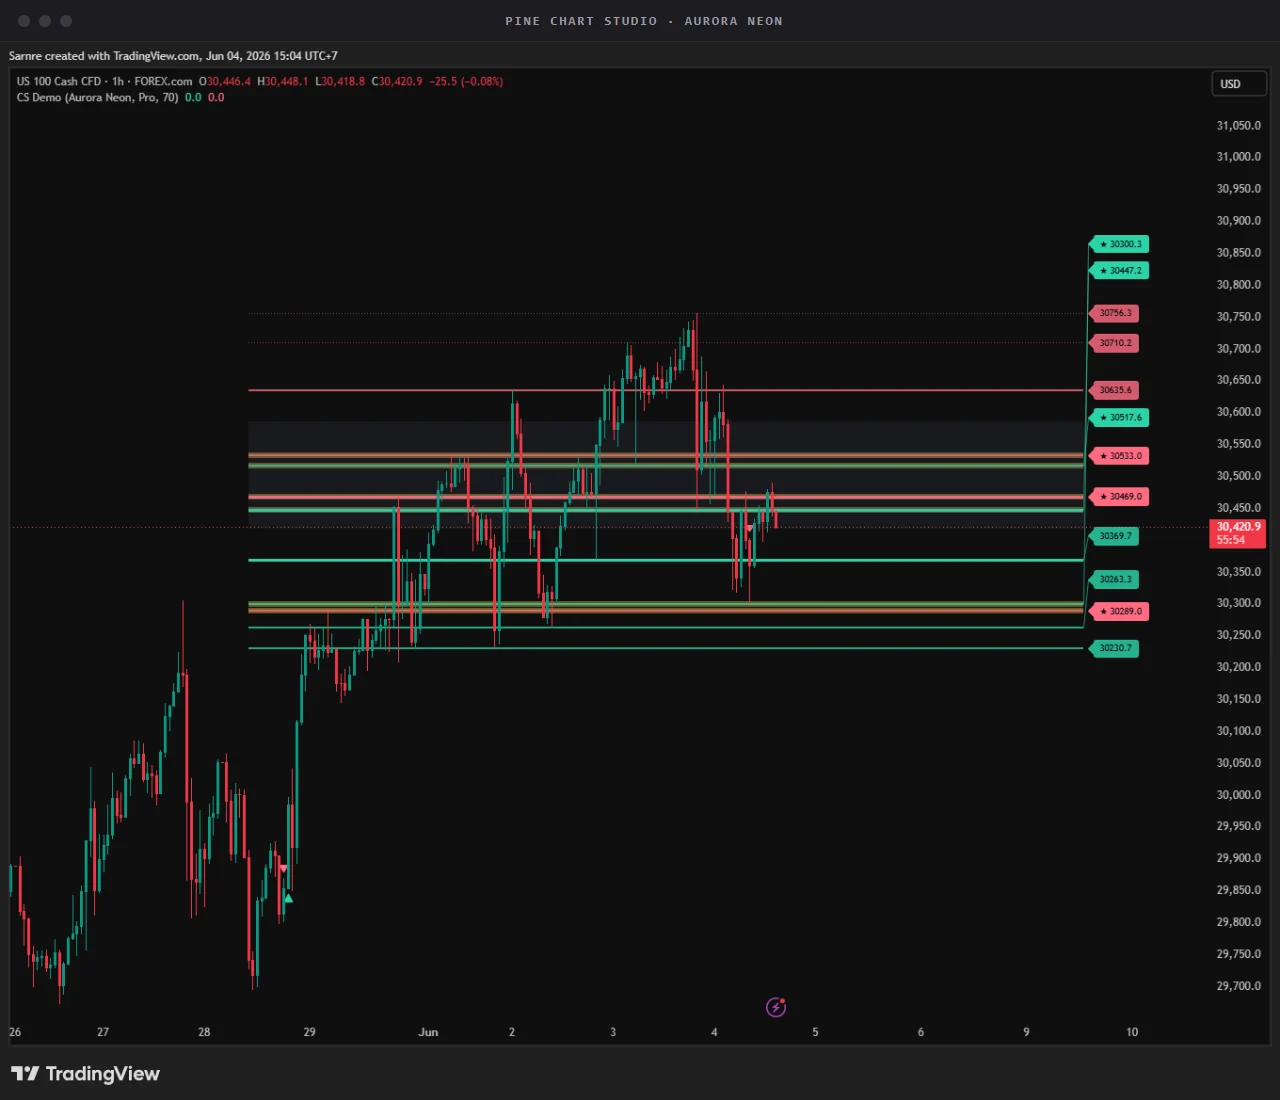
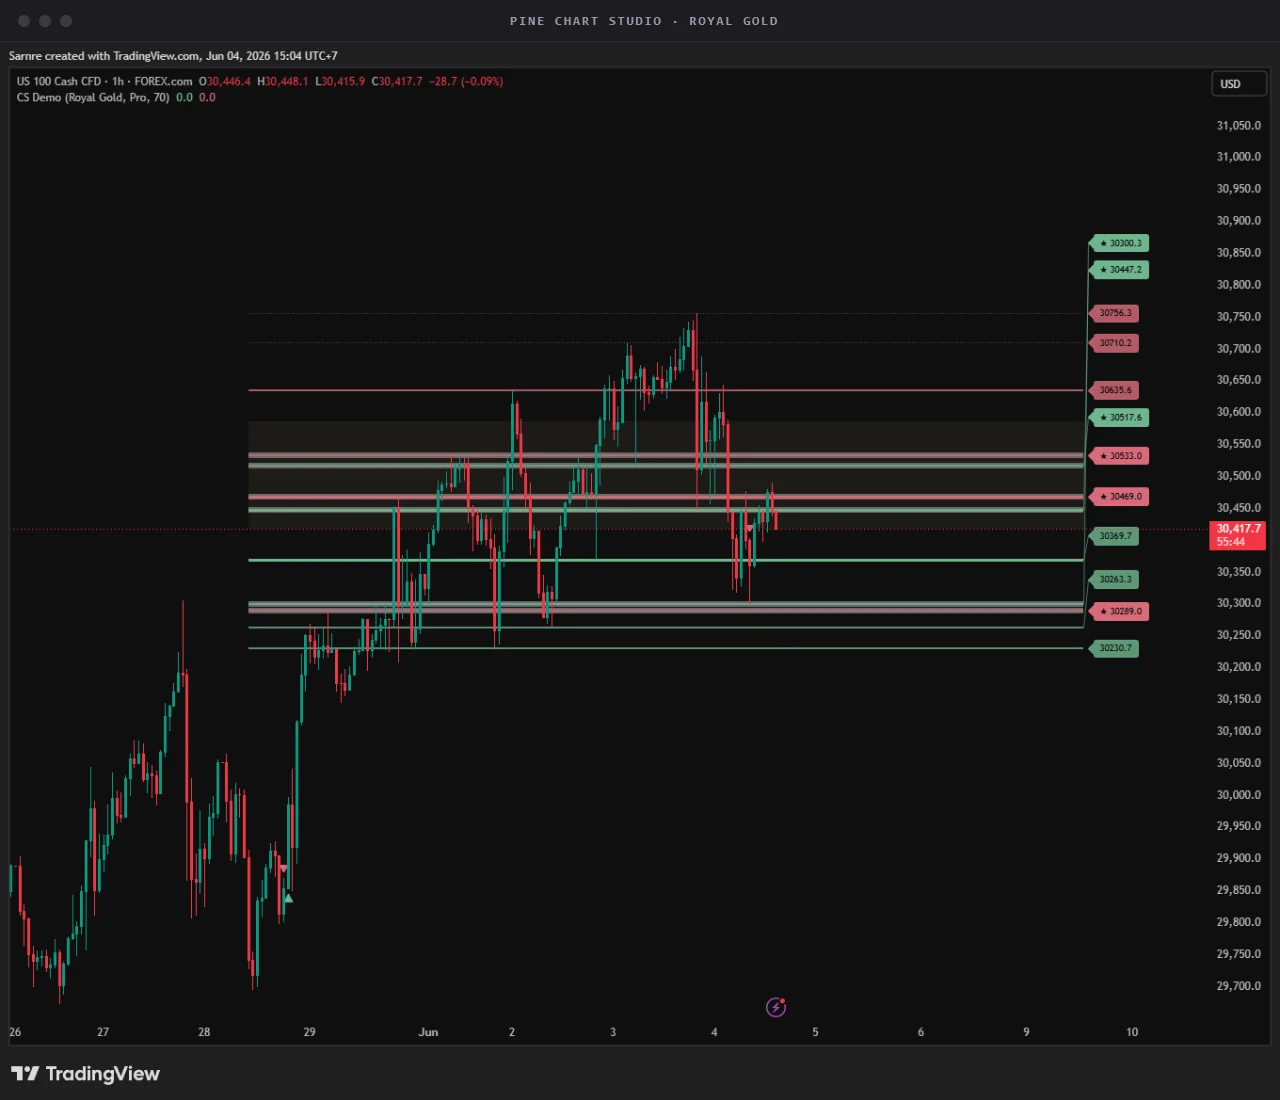
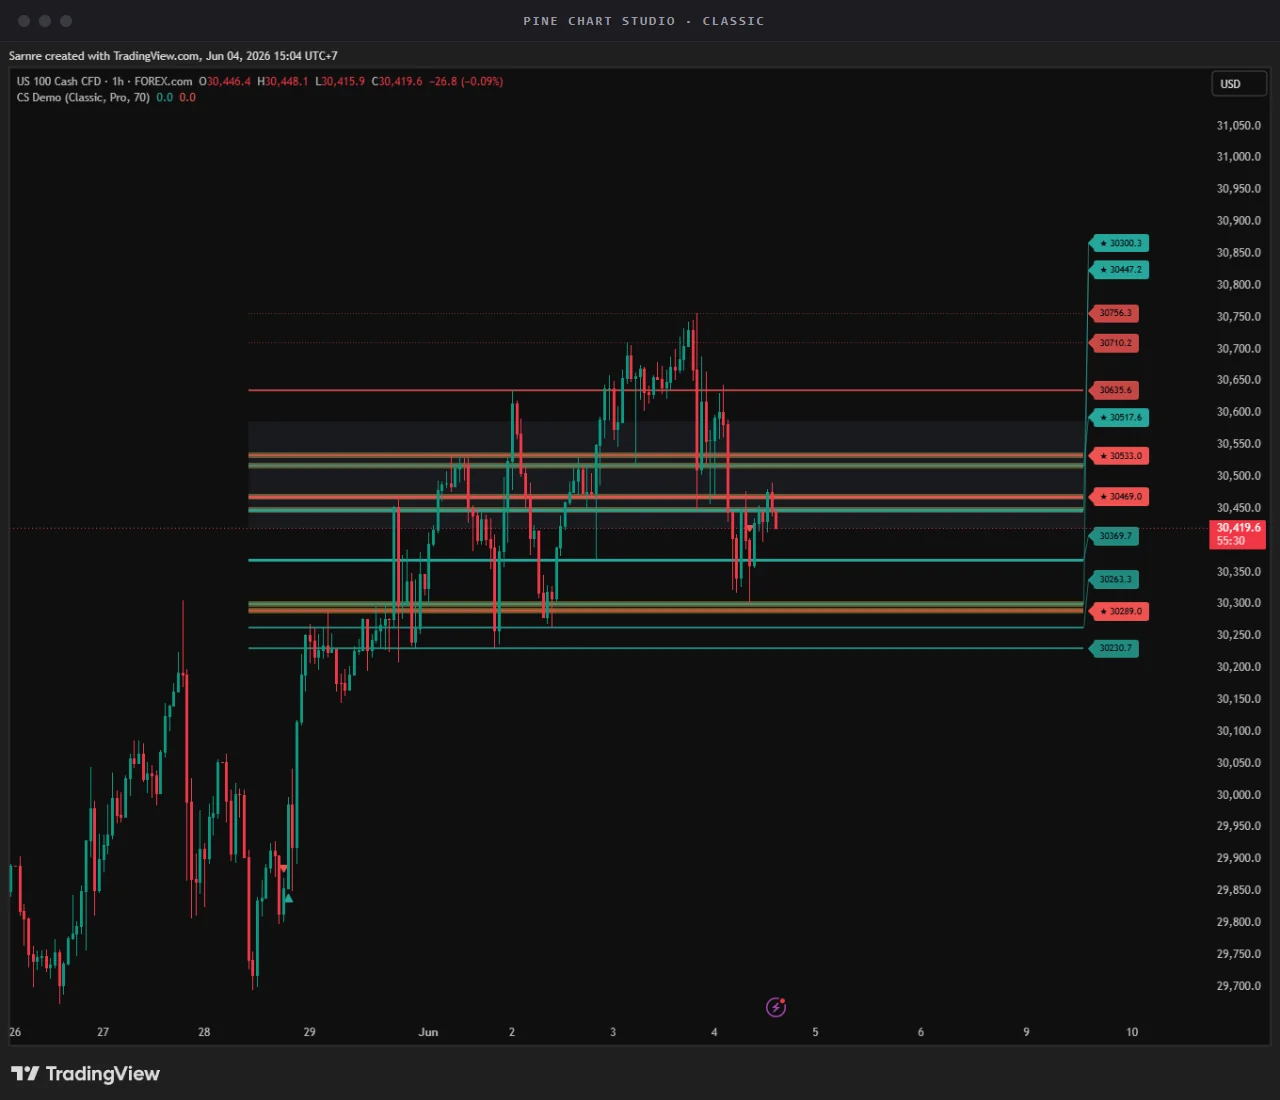
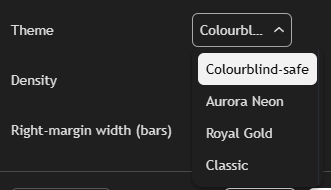
One dropdown restyles everything — same structure, same anti-overlap logic, your aesthetic.
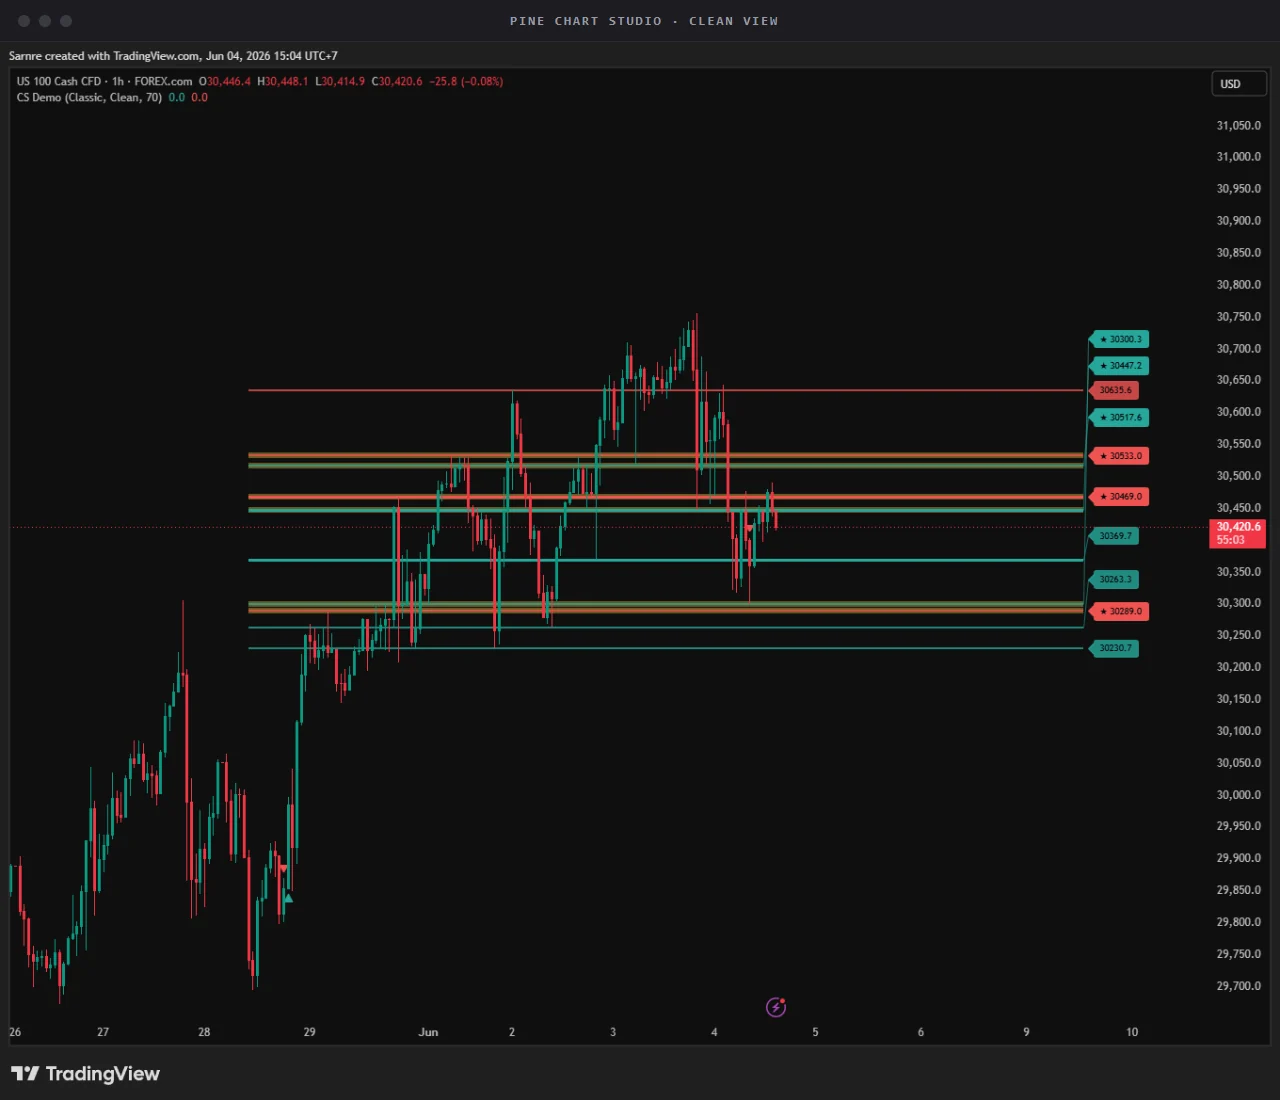
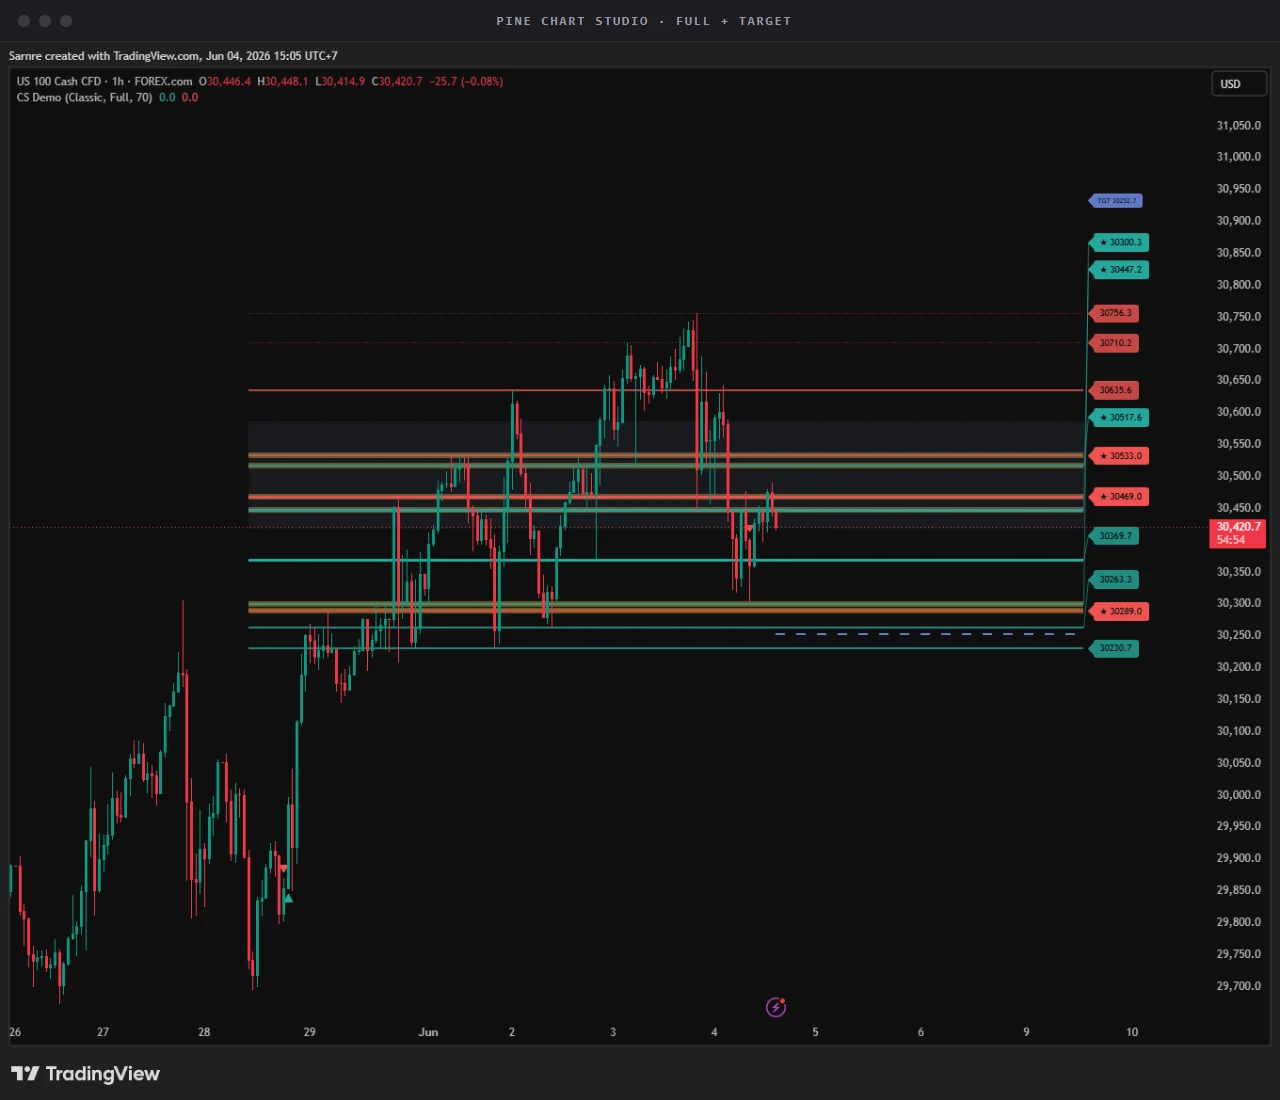
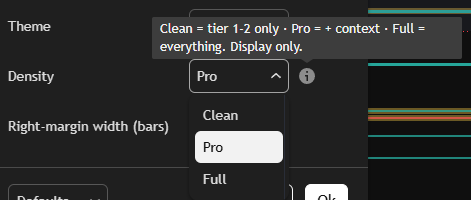
Dial the information
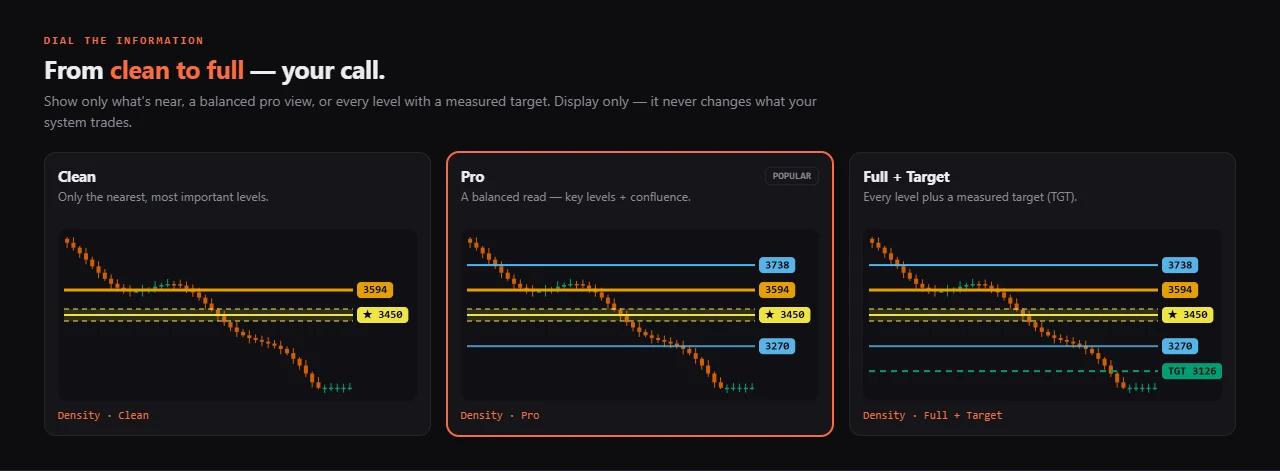
Show only what's near and what matters — or everything with a measured target — without ever touching your system.
The honest ceiling — taught, never faked
Pine is a script, not a web page: it can't really glow, gradient, bevel or round corners. Chart Studio names exactly what Pine can't do, teaches the layering law most devs get wrong, and gets the true best of the medium (depth via stacked transparency) — instead of shipping a mockup that won't compile.
Want your charts to look like this? Own Chart Studio — $49, refundable for 7 daysSignals, callouts & confluence
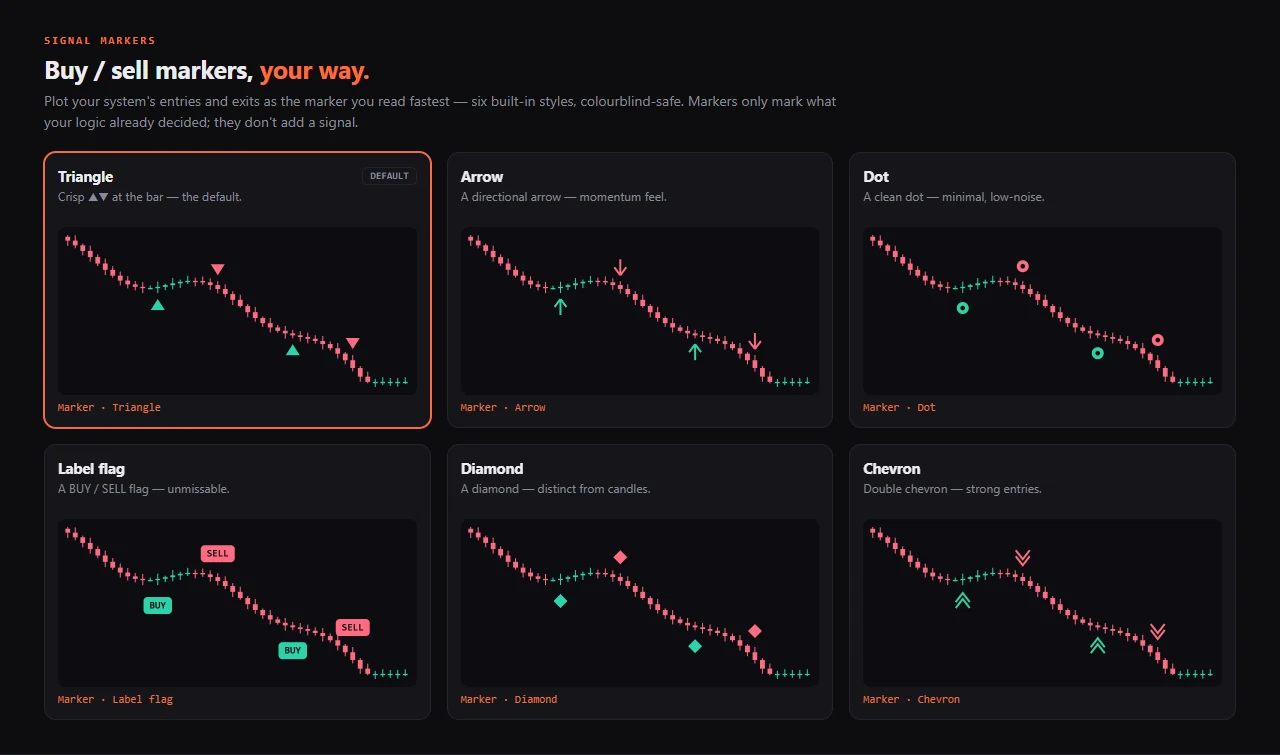
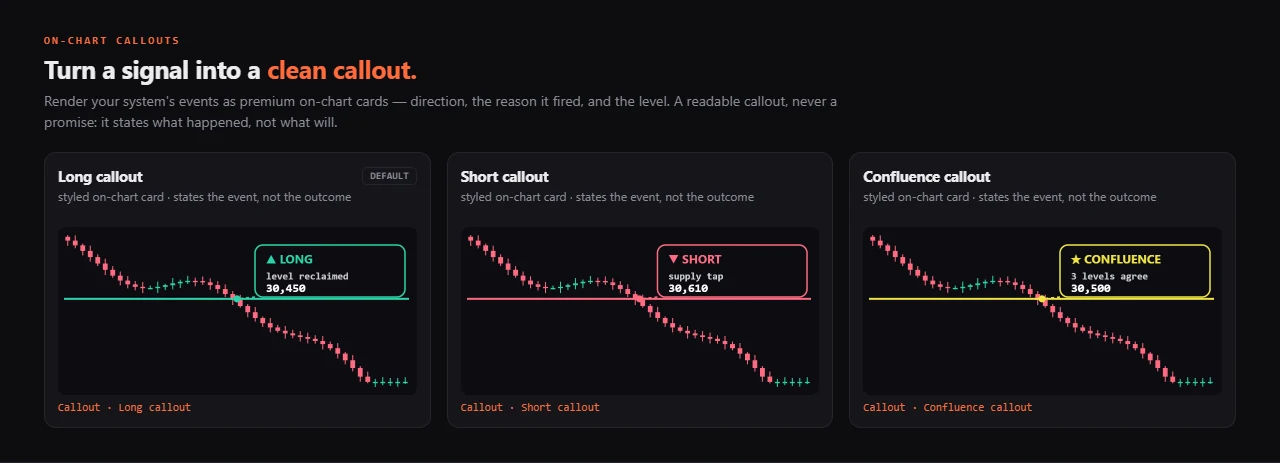
Render your system's entries, events and agreement like a pro terminal — six marker styles, premium on-chart callouts, and a glowing ★ where levels stack.
Use it & own it forever
Mocked and measured in the browser first, then a clean port — one file runs it in your AI, and the whole kit is yours to keep.
Designed in the browser first — so the chart is right, not guessed
Pine can't preview cheaply, so the slow questions — do any labels overlap? is the hierarchy right? — get answered in an HTML mock where iterating is instant. You measure it, fix it, then port the winner to Pine. That's why it compiles first try and looks designed, not debugged.
Four steps — the cheap iterations happen first
- 1 · Declare & tierMap your system's levels and signals, ranked by importance — the model on paper.
- 2 · Mock & measure in HTMLLay it out in the browser mock and measure label collisions and spacing — catch every overlap in seconds, not after a Pine recompile.
- 3 · Port to PineA clean transcription that obeys the z-order law — the look you approved, your signal logic untouched.
- 4 · Lint & verifyA checker flags z-order, the object cap, fake-glow and label discipline; then it compiles on TradingView and commits on bar close — no repaint.
How you run it — copy, paste, done.
# Open Claude / ChatGPT / Cursor / Gemini, then:
⤵  drop in:  START_HERE_AI.md   ( + your indicator )

"Read START_HERE_AI.md and pine-chart-studio/SKILL.md, then take my
 support/resistance indicator and render it with this kit — ranked
 levels, confluence emphasis, anti-overlap labels, a colourblind-safe
 theme — and give me a style menu."

→  it restyles the chart and never touches your signal logic.
What you can ask it to do
- “Make my chart premium”It maps your indicator's outputs to clean primitives, tiers them by importance and applies a theme — without touching the signals.
- “My labels overlap — fix it”The anti-overlap manager nudges every colliding tag clear.
- “Swap the theme”Apply Royal Gold or Aurora Neon instead of the default, and it explains which role maps to which colour.
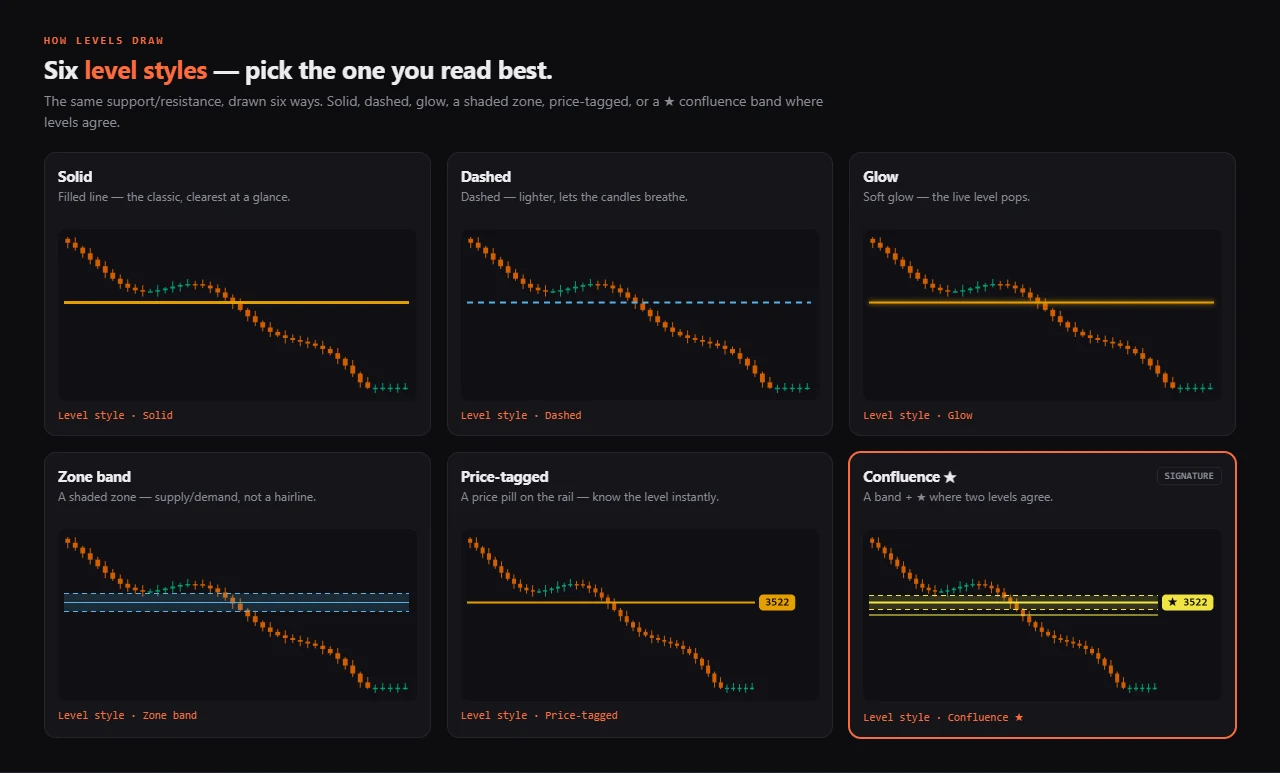
- “Build me a style menu”It exposes shape + colour + density inputs so you (or your buyer) pick the look you read best.
What's in the box
- START_HERE_AI.mdThe one file you drop into your AI. It teaches the AI the whole kit — what to read, the rules it can't break, a ready first prompt.
- The skill + the v6 libraryThe DECLARE → RANK → RENDER design system, the 8 primitives, the 4 governors and the real Pine components your AI calls.
- Themes + a style galleryColourblind-safe, Aurora Neon, Royal Gold and Classic — plus a runnable gallery to pick from.
- Plain-English guides + a lintQuickstart, copy-paste prompts and extension ideas, and a checker that keeps the render honest and compiling.
The moment you pay
- Instant accessPay by card, Google Pay or PromptPay and the kit is yours right away — one ZIP, link emailed too.
- Yours forever + free updatesNot a rental. No expiry, no seat check; every future version is free — email support@pulltrade.app.
- 7-day refund — before you downloadChanged your mind and haven't downloaded? Full refund within 7 days, no questions. Once you download, the window closes — files can't be returned.
Honest FAQ
The things you'd actually want to ask — answered without spin.
A render layer, never a strategy: it changes how a chart looks, not what it trades or its results. Pine can't glow, gradient, bevel or round corners — it teaches the honest ceiling instead of faking it, and it draws only what your system computes.
Own every line — and extend it forever.
The full source, the AI-agent kit and free updates for life — yours the moment you pay.
Launch price · full refund within 7 days · own the source forever
Eleven tools.
One honest line.
The entire ProEA Lab Pine line in one pack — five indicators and six skills & kits, every Pine v6 source and every AI-extend kit. Build a system, validate it, render it, risk-gate it, then audit it — honestly, end to end.
Pine Chart Studio is a design and rendering tool — a render layer, not a strategy and not a signal service. It changes how a chart looks; it does not generate trading signals, change a system's logic, or affect what it trades or its results. No win-rate, profit, or performance is claimed or implied. It draws only what your system computes. Not financial, investment, or trading advice. Verify every build on TradingView — and on Bar Replay for non-repaint — before publishing. © 2026 ProEA Lab.