To add a Pine Script indicator or strategy to TradingView, open the Pine Editor, create a new script, replace its template with your code, save, then select Add to chart. If you downloaded a .pine file, open it in a plain-text editor and copy the code first. For an existing community indicator, search its name in the Indicators dialog instead.
Somewhere on your machine sits a .pine file. Maybe you bought it, maybe an AI wrote it, maybe a friend exported theirs. The steps below take that source code onto your chart; you do not need to publish it or make it public.
Where is the Pine Editor in TradingView now?
Start with the Pine icon on the chart's right toolbar. TradingView's current help describes a floating editor that you can dock to the right, detach into another window, or place below the chart with Move to bottom. The launch icon and the editor's position are different things. TradingView: Pine Editor layout and controls.
If the Pine Editor is not showing at the bottom, look for that right-toolbar icon first. A tutorial screenshot may use a different editor layout; the paste, save and add-to-chart workflow stays the same. Still can't see it, or on a phone or iPad? See where the Pine Editor is on each device.

What is a .pine file, and how do I open it?
A .pine file is plain text holding Pine Script source code. The extension is a naming convention; the workflow below copies the file's code into Pine Editor. Open it with Notepad, VS Code, or another text editor, then copy the complete script. Paste the code itself into TradingView, including its //@version line. Copying the filename, dragging the file onto a chart, or pasting a Markdown code fence does not replace this step. To check a file before you paste it, open it in the browser: it identifies the version and script type and flags common paste issues. It does not compile Pine or find every code error; use the Pine Editor for that.
If the file arrived as .txt instead, nothing changes: the contents are what count, and a //@version= line near the top tells you it is Pine. TradingView's documented workflow is paste-based, so renaming the file or hunting for an upload button won't get the script onto a chart.
How do I add a script I have as source code?
For a complete indicator() or strategy() script, paste it over the editor's template, then add it to the chart. The whole route:
- Open the Pine Editor from the right rail.
- Click the script-name dropdown in the editor's header and create a new indicator. The editor fills in a small template.
- Select all in the editor and paste your script over the entire template — not underneath it, not inside it. All of it.
- Choose Save script from the script-name menu and give it a name.
- Select Add to chart in the editor. If compilation succeeds, the script appears on your chart. You can reopen your saved code from My scripts in the Indicators dialog.
This follows TradingView's documented create, replace, save and add workflow.
If the source declares library(), it supplies reusable code for another script to import. Ask its author for the published import and an indicator or strategy example that uses it; pasting the library alone is not the route to using its functions on a chart. See TradingView's library instructions.
Step 3 is where most installs die, and we know because we've worked the support ticket: a compile error complaining about two declarations. That's what happens when a script gets pasted after the template instead of over it — the file ends up with two indicator() declarations, and the compiler refuses both. Select all, paste, gone.
Keep the source's original version annotation when you install it. A v5 script uses //@version=5; changing that line to //@version=6 alone is not a migration. The annotation is optional, but Pine assumes version 1 when it is missing; it does not infer v6 from the rest of the code. If an older snippet fails to compile, read its first compiler error and check the intended version with its author. For an intentional upgrade, use the migration steps below.

A three-line installation check
If you are unsure whether the install steps or your downloaded code are the problem, create a separate new indicator and replace its template with these three lines. Keep your original script saved separately.
//@version=6
indicator("Installation check")
plot(close)
Save it, then select Add to chart. You should see a separate pane with a line plotting each bar's closing price. This uses the minimal indicator structure in TradingView's script-structure guide; it is an installation check, not a trading signal.
If this works but your original script does not, you have confirmed the basic paste, save and add route. Read the original script's first compiler error next. If TradingView instead reports that you cannot add another indicator, check your plan's indicator limit. A successful check does not validate the original script's calculations or results. If the script is a strategy, how to backtest on TradingView covers its report and the settings to check before you trust it.
The script was written for Pine v5. How do I move it to v6?
Open the Manage script dropdown in the Pine Editor and select Convert code to v6. The script has to compile in v5 first, and the converted code can still need hand fixes, according to TradingView's official v6 migration guide. Some v6 changes also compile cleanly while changing results: timeframe.period returns "1D" instead of "D", for example. We ran the common v5 patterns through the compiler and wrote up every error, fix and silent change.
Can I add Pine Script on the TradingView app (iPhone, iPad or Android)?
The dependable route is to paste and save the script once on a computer, then use it on your phone. TradingView documents the paste, save and add-to-chart workflow above for the chart on a computer. For mobile browsers where the Pine Editor doesn't appear by default, TradingView says you can open the editor on its own page through the detached-editor link (TradingView blog: the Pine editor on all devices).
We couldn't find an official step-by-step for pasting code inside the iOS or Android app, and app menus change between versions, so we won't promise a tap path we can't cite. A saved script belongs to your TradingView account, not to one device. After saving it on a computer, look for it in the app's indicator list. If your app version doesn't show it, open TradingView in the phone's browser instead.
If a long paste looks incomplete, keep the original file and compare its first and last nonblank code lines with what reached Pine Editor; check the line count too, allowing for blank lines or removed Markdown fences. Do not delete required code to make it fit. Our local .pine opener accepts a source file or pasted text and shows the line count, first and last nonblank lines, and full code to copy. Matching the endpoints alone does not prove the middle is complete, and the opener cannot confirm what another app pasted. If you cannot paste the complete script reliably on mobile, use the documented computer workflow above and reopen the saved script on mobile.
How do I add a community indicator instead?
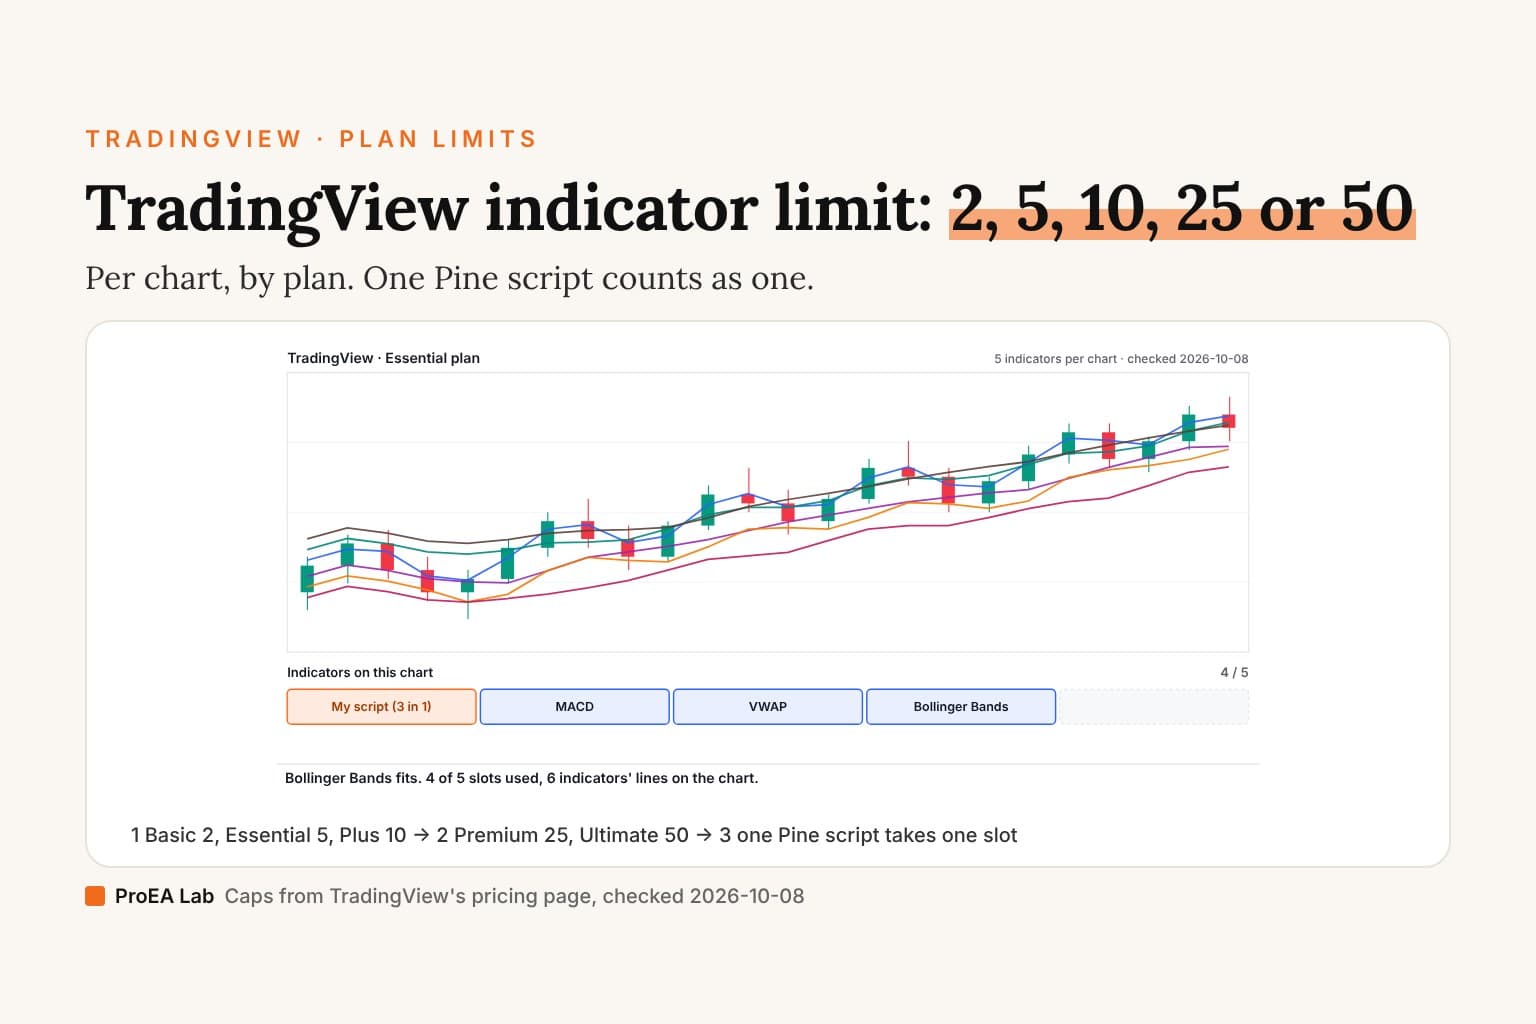
If you don't have source code and just want an existing tool: Indicators in the top toolbar opens the dialog TradingView calls Indicators, metrics, and strategies. Type what you want in the search box, click a result, and it's on your chart — that's the entire flow. If the chart refuses one more, you've hit your plan's indicator limit.
The left rail of that dialog is the map worth knowing: My scripts (everything you saved from the editor), Purchased, the built-in sets (Technicals, Fundamentals), and the Community shelves — Editors' picks, Top, Trending. Community scripts run from shared code you didn't write; some publish their source openly, some are closed. Which kind you're running matters the day a signal surprises you.

Which route should you actually want?
Where we're biased, priced honestly: our Pine v6 tools ship as .pine source files you add with the steps above — paste, save, add to chart — with an AI extension kit so you can make a model explain any line before you trust it. If you want a small script to practice the route on, VP Lite ships with its full source in Pine Pro Library; same file type, same two minutes. If you would rather have an AI write the script, we compare a hosted generator with a build kit you run in your own assistant in Pineify vs Pine Builder Lite.
The honest caveat either way: adding a script is plumbing. It changes what your chart shows, not whether the idea underneath has an edge — auditing that is its own two minutes, and it's the better use of your skepticism.
Updated 19 October 2026: clarified the library/import boundary and preserving the source's Pine version during installation.
Paste over the template, save, add to chart — then check what the script actually does.