Six kits.
One step-by-step workflow.
Build it, prove it, make it beautiful, make it explain itself, then audit it — honestly. The whole pipeline runs on one pattern: drop a file into your AI and ask in plain English — and you design each piece in the browser first, then port it to Pine.
ProEA Lab · the playbook · how the six kits become one workflow
From a vague idea to a tested, beautiful, self-explaining system.
The six skills & kits aren't six gadgets — they're one pipeline, joined by a shared System Blueprint, where each step's output feeds the next. Here's the whole thing step by step, the way a pro runs it — starting with the one pattern that drives all six, and the design-first habit that makes every step compile first try.
The one pattern
Every kit works the exact same way. Learn this once and you can run all six.
Three moves, every time
- 1 · Open your AIClaude, ChatGPT, Cursor or Gemini — any agent works.
- 2 · Drop in START_HERE_AI.mdEvery kit ships this one file. It teaches the AI the whole kit — what to read, the rules it can't break, a ready first prompt.
- 3 · Tell it what you wantIn plain English. The kit does the work and hands you Pine you can paste straight into TradingView.
The universal opener
# Open Claude / ChatGPT / Cursor / Gemini, then:
⤵  drop in:  START_HERE_AI.md   ( + the kit folder )

"Read START_HERE_AI.md and <kit>/SKILL.md, then <what you want>."

→  the same three moves for all six kits.
The pipeline at a glance
Six kits, one line — joined by the System Blueprint that every step reads and writes:
| Step | Kit | You give it | You get back |
|---|---|---|---|
| 1 · Build | Foundation | a trading idea, in plain words | a testable strategy — a blueprint + compiling Pine |
| 2 · Validate | Quant Studio | that strategy (or its blueprint) | an honest verdict — kill / promising |
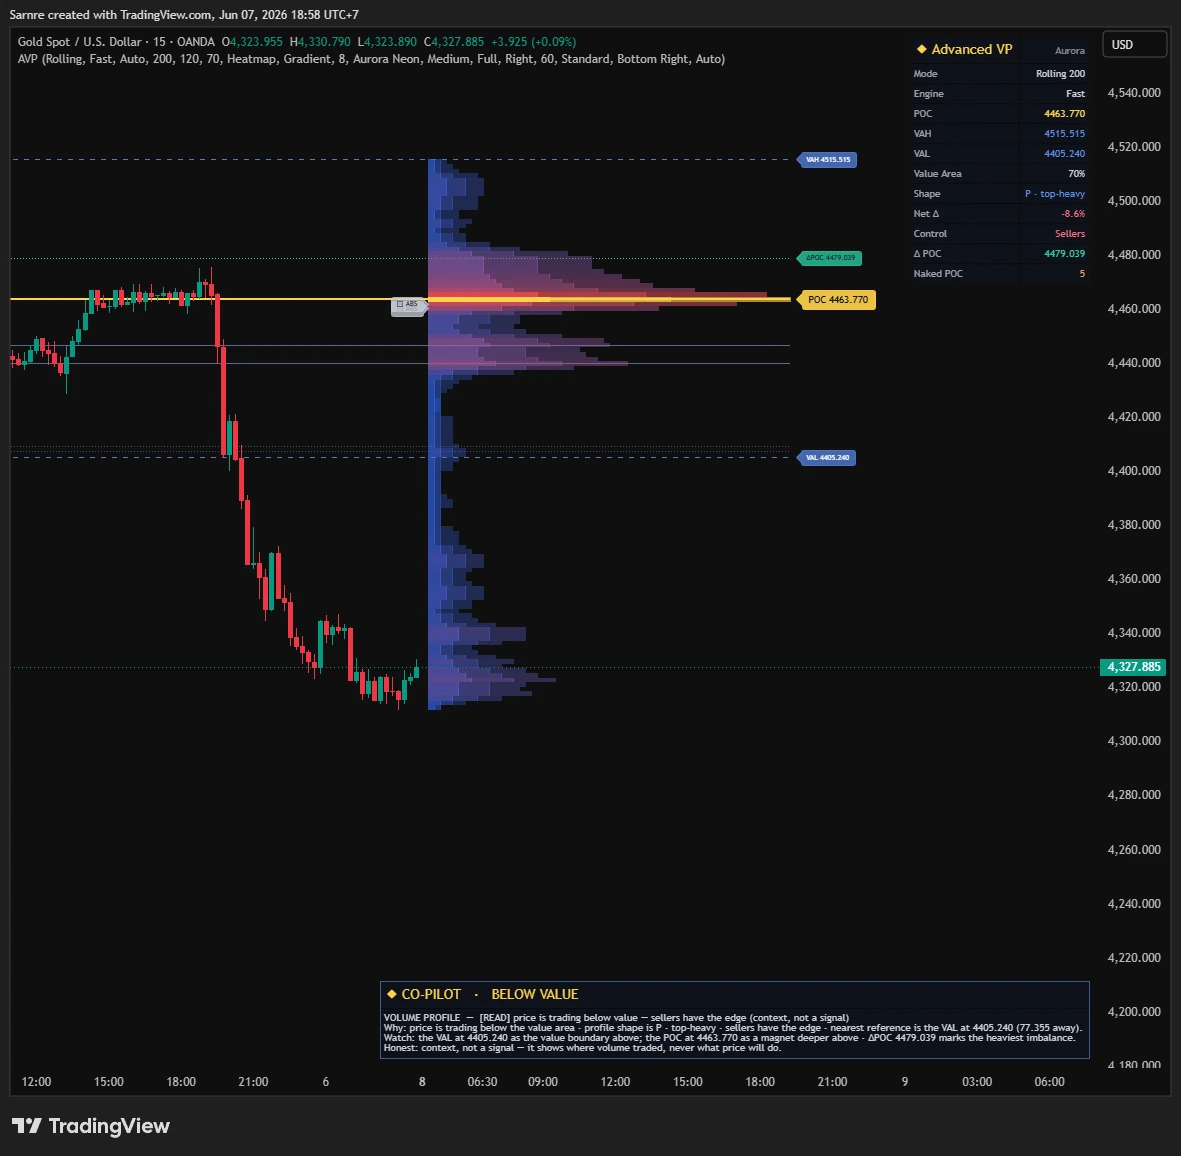
| 3 · Style the chart | Chart Studio | your indicator's levels & signals | a clean, premium, readable chart |
| 4 · Add a panel | Dashboard Studio | the system's numbers | a premium on-chart decision panel |
| 5 · Explain it | Narrative | any finished system | it narrates itself in plain English |
| 6 · Audit it | Reality Check | the whole finished thing | an honest L0–L5 audit before you trust or sell it |
Then run the Pine — with or without Claude Code
Every step hands you a Pine v6 file, and you never write code either way. Getting it onto a chart takes one of two paths:
Two ways to get it on your chart
- Claude Code + the TradingView bridgeThe AI drives a real TradingView for you — paste, compile, screenshot, self-fix — hands-free. The studios' optional Auto-Pilot does this end to end.
- Any web AI — Claude, ChatGPT, Gemini, …No bridge needed. Open TradingView and paste the Pine in yourself — four steps, shown below. A free account works.
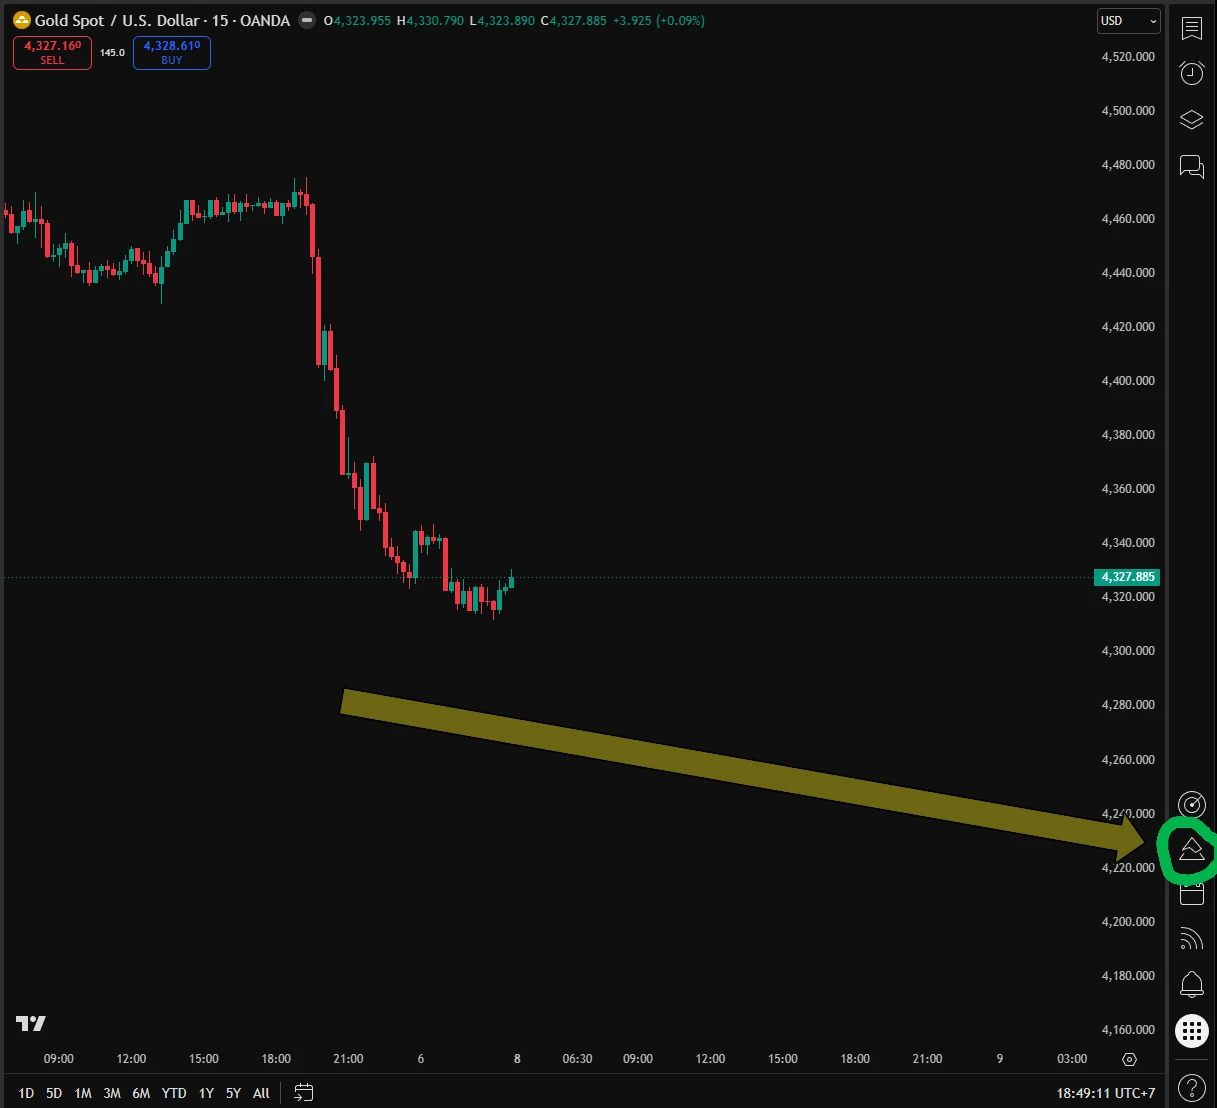
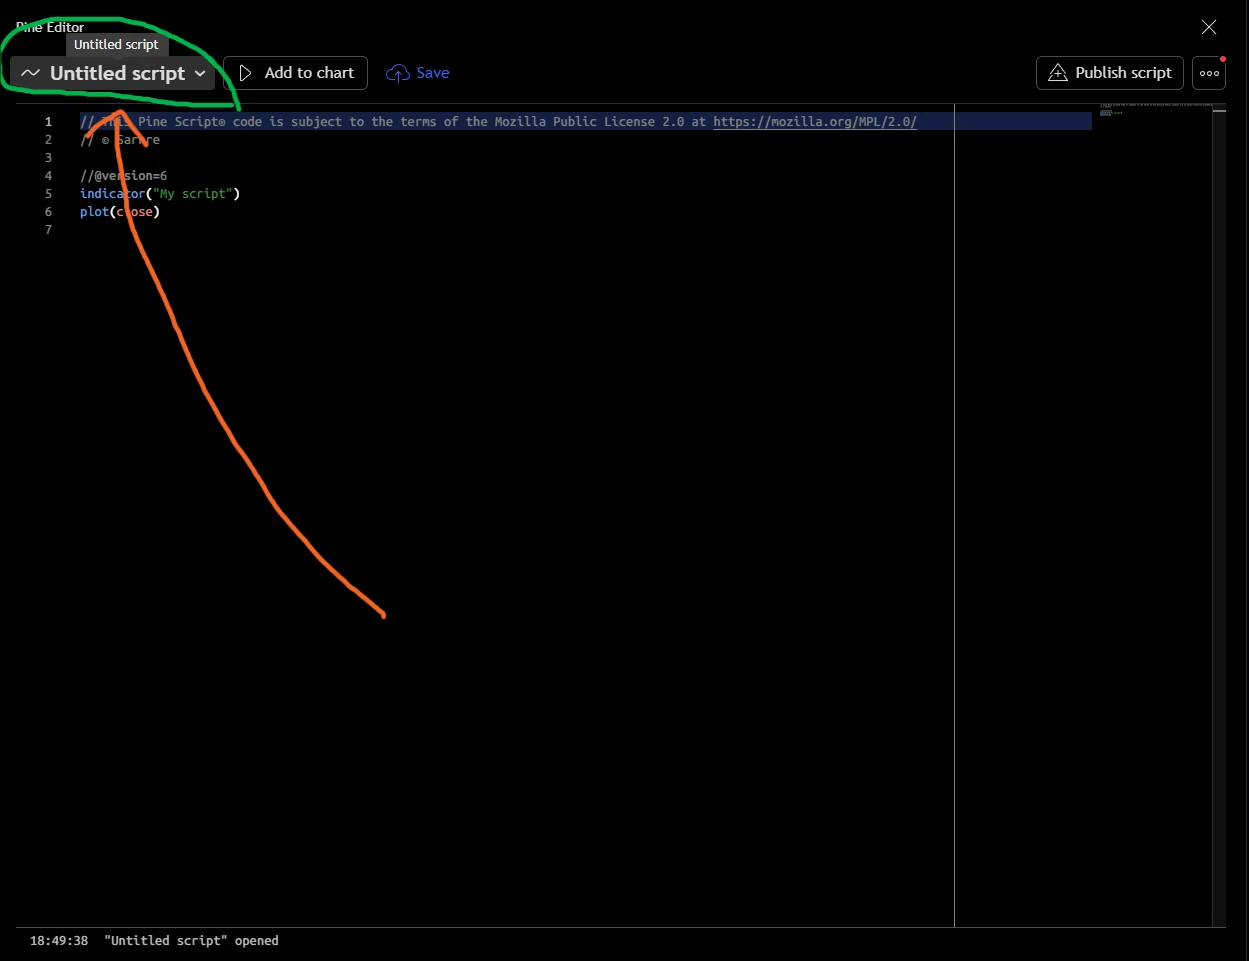
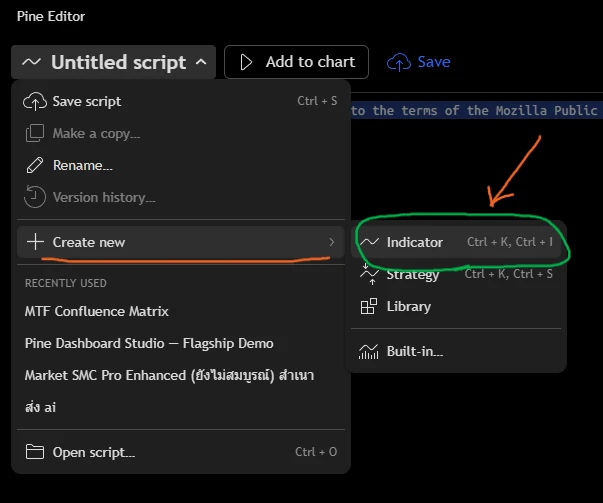
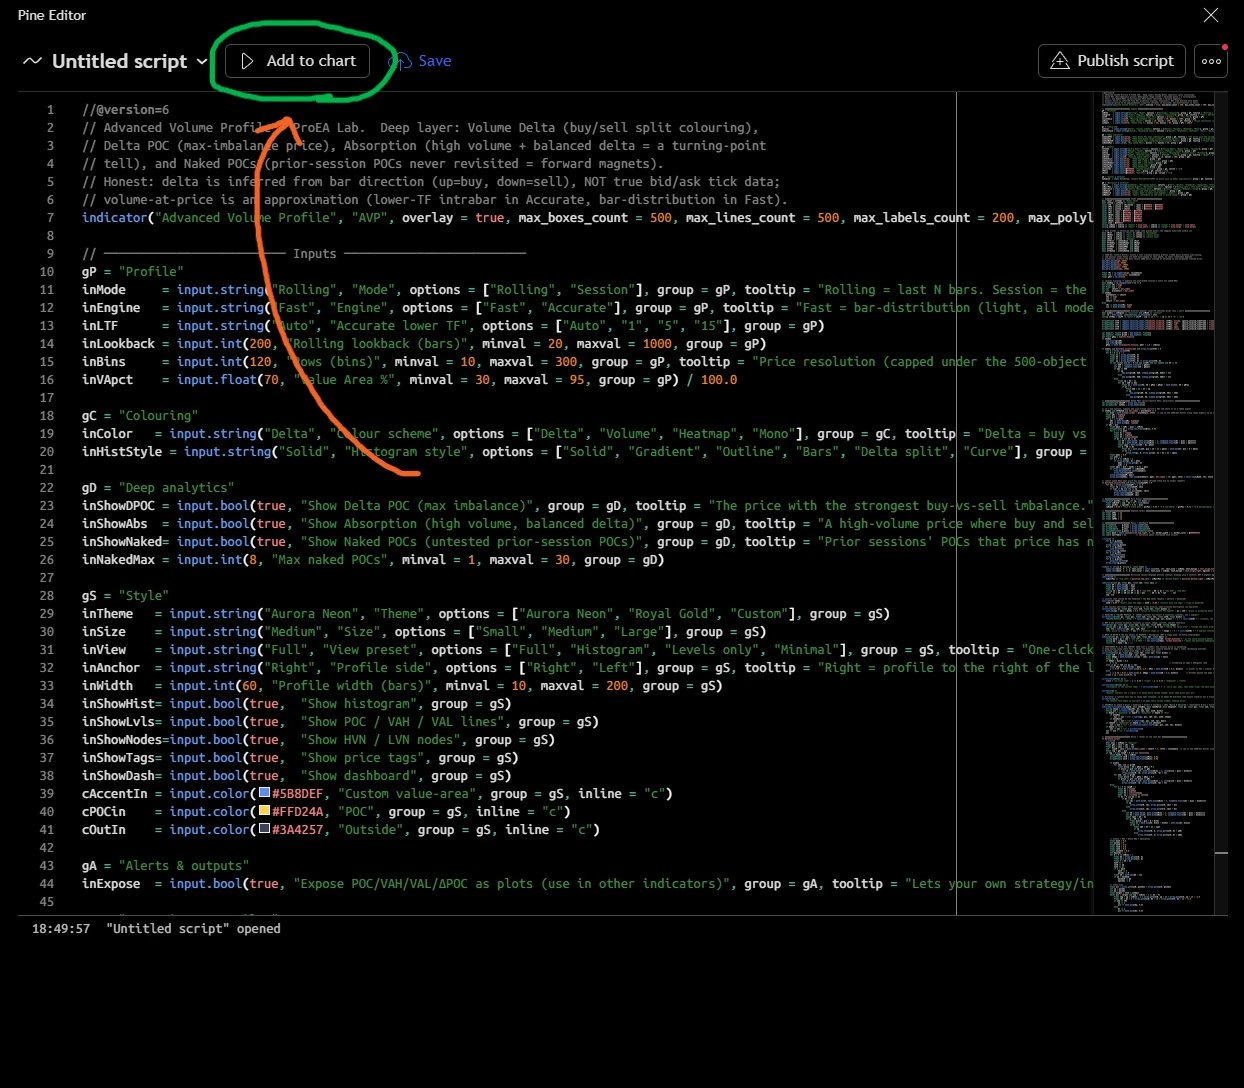
Design it in the browser first
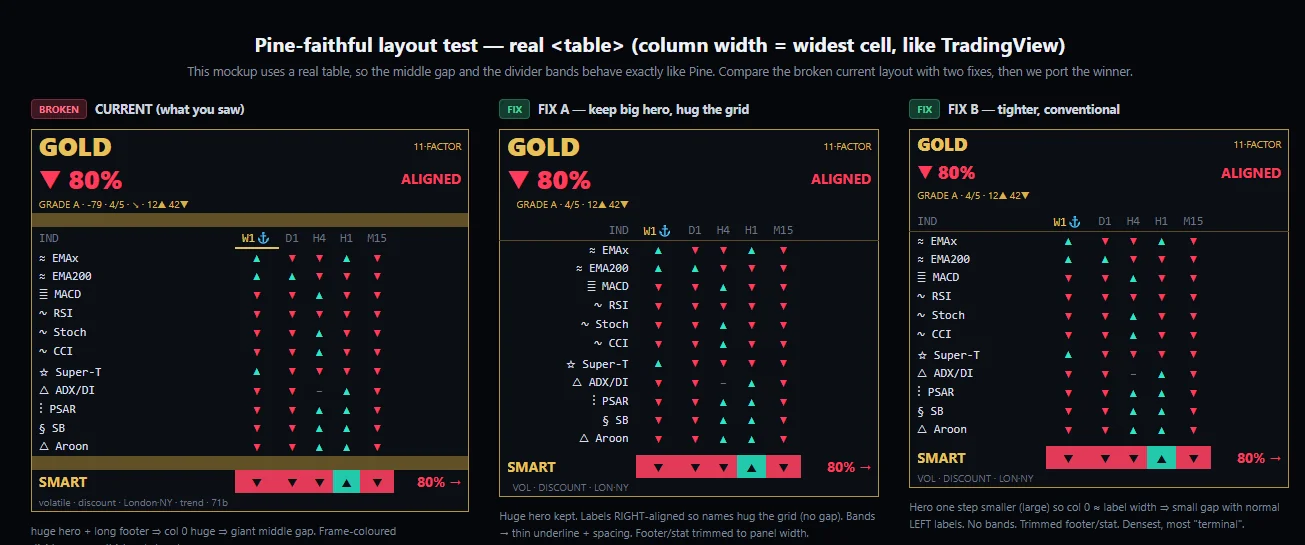
Pine can't preview cheaply — every visual or wording change is a recompile on a live chart. So every kit ships a runnable HTML mock + a DESIGN_PROCESS.md: dial the layout, the wording and the logic where iterating is instant, then port the approved result to Pine — first try.
Why design-first — and how it works
- The problemIn Pine, every tweak means a recompile on a live chart — slow, and you lose your place. Each design decision costs minutes.
- The fix — a browser mockEvery kit ships a runnable HTML mock of its panel plus a `DESIGN_PROCESS.md`. You solve the look and the logic in the browser, where every edit is instant.
- Then port, onceThe mock and the Pine say the same words — you transcribe the approved result and it compiles first try, and the mock stays as a living reference.
It's already in every box
Design-first isn't a separate tool — it's how each kit is built, now shipped to you. Open `<kit>/design/` (the studios use `templates/`), edit the mock to your own system, then follow that kit's DESIGN_PROCESS.md to port it. The same words in the mock and on the chart — that's the whole point.
Steps 1–2 · Build it, then try to kill it
Turn the idea into a real strategy — then do everything you can to prove it doesn't work, before your money does.
Step 1 — Foundation: idea → testable strategy
Start here whenever you're building a strategy from scratch.
- WhenYou have an idea (even a vague one) and want a real, compiling strategy you can backtest.
- Say“…elicit a blueprint for a trend-pullback idea on NAS100 1h, and build a Pine v6 strategy from it I can backtest.”
- HandoffIt writes a System Blueprint (blueprint.yaml) + a compiling Pine strategy, marked “untested.” That blueprint is the baton for step 2.
Step 2 — Quant Studio: try to kill it
Most ideas die here — that's the point. Failing cheap is the whole skill.
- WhenYou have a finished strategy (or a Foundation blueprint) and need the honest truth before you risk anything.
- Say“…run the full validation workflow on my strategy — in-sample and out-of-sample, Monte-Carlo and a significance test — and give me an honest verdict.”
- HandoffA verdict: KILL (back to step 1 with a new idea) or promising (carry on). It reads a Foundation blueprint directly, so steps 1 → 2 are seamless.
Steps 3–5 · Make it readable, then make it talk
Once a system survives, make it something you can read at a glance — and that explains itself. These are presentation layers: they never touch your logic.
Step 3 — Chart Studio: style the chart
- WhenYour levels and labels are a cluttered mess, or you want the chart to look premium.
- Say“…pick the look in the style-gallery, then render my support/resistance indicator — ranked levels, confluence emphasis, anti-overlap labels, a colourblind-safe theme — as drop-in Pine.”
- HandoffA clean, tiered, themed chart. Render-only — your signals are untouched.
Step 4 — Dashboard Studio: add a decision panel
- WhenYou want a premium on-chart panel that reads at a glance — regime, bias, risk, a verdict.
- Say“…design a 6-row risk dashboard in the Royal Gold theme — mock it in HTML first, then give me drop-in Pine table code.”
- HandoffA compile-first-try panel in your theme. Also a presentation layer — no logic changed.
Step 5 — Narrative: make it explain itself
- WhenYou want the system to tell you (or a buyer) what it sees and how sure it is — in plain English.
- Say“…mock the Co-Pilot panel in design/, then add it to my indicator — six layers, Pro depth, a causal track record, and the blind spots.”
- HandoffAn on-chart Co-Pilot: read · why · plan · confidence · blind spots · honest hold-%. It translates state, it never predicts.
Step 6 · Audit it — then loop
Before you trust it with money or put a price on it, turn an honest critic loose on the whole thing.
Step 6 — Reality Check: the honest audit
- WhenYou're about to ship, sell, or trust what you built — and want the bad news while you can still fix it.
- Say“…run a full Reality Check audit on my indicator — be blunt about its weakest dimension and give me the honest path forward.”
- HandoffA weaknesses-first report + an L0–L5 verdict (the weakest load-bearing dimension) + the single highest-leverage fix.
Then loop — back to the weakest step
Reality Check doesn't end the pipeline; it points you back into it. Weak evidence? → Quant Studio. Cluttered chart? → Chart Studio. A shaky idea? → Foundation, with a sharper hypothesis. Build → validate → present → audit → repeat is the whole loop, and each pass makes the system more honest, not just prettier.
Run it for full effect
The handful of habits that make the suite compound instead of just coexist.
Six habits for maximum effectiveness
- Design in the browser firstEvery kit ships an HTML mock + a DESIGN_PROCESS.md. Dial the look and the logic where iterating is instant, then port to Pine — it compiles first try, and the mock stays as your reference.
- Let the Blueprint be the batonFoundation's blueprint.yaml is the shared contract — Quant and the design kits all read it. Keep it the single source of truth and the handoffs are seamless.
- Fail cheap, on purposeExpect most ideas to die at Quant. That's the kit working — a dead idea found in an afternoon is the cheapest tuition in trading.
- Style last, not firstChart / Dashboard / Narrative are presentation. Make the system survive Quant before you spend an hour on a theme.
- Keep the numbers honestNever let a panel or a narrative claim a win-rate the validation didn't earn. The honesty is the moat — and the ad-policy shield.
- Audit before you price itRun Reality Check before you sell or size up. An L2 priced like an L4 is how a brand dies.
Two worked paths
You rarely run all six in a straight line — here are the two most common routes:
| Your starting point | The path |
|---|---|
| “I have an idea” | Foundation → Quant Studio → (Chart + Dashboard + Narrative) → Reality Check |
| “I already have an indicator” | Chart Studio → Narrative → Reality Check (skip Foundation/Quant — there's no new strategy to test) |
Eleven tools.
One honest line.
The entire ProEA Lab Pine line in one pack — five indicators and six skills & kits, every Pine v6 source and every AI-extend kit. Build a system, validate it, render it, risk-gate it, then audit it — honestly, end to end.
Educational decision-support tools — not financial advice, not a signal service. No win-rate, profit, or accuracy is claimed or implied. Entry / SL / TP levels and zone scores are reference values derived from market geometry, not predictions. SMC concepts are public methodologies, implemented originally. Trading involves risk; forward-test on a demo and manage your own risk. © 2026 ProEA Lab.
FTMO, FundedNext, Topstep, The5ers and other third-party names are trademarks of their respective owners. ProEA Lab is independent and not affiliated with, endorsed by, or sponsored by any of them.