We sell an indicator that grades order blocks and fair value gaps from 0 to 100.
We wanted to know whether the grade separated outcomes in one historical window, so we shuffled the scores across zones and compared the observed separation with that null. The result depends on the outcome definition and exchangeability assumptions; shared price paths need particular care.
The composite did not show statistically detected separation on our data. Two ingredients showed exploratory associations in that same window.
We're publishing all of it, because the same transparency that lets us write this is the product's actual pitch. A tool that prints its own track record has to survive its own audit — this is the audit.
What we tested
The SMC AI-Scored Toolkit grades order blocks and fair value gaps using volume conviction, displacement, liquidity sweep, higher-timeframe alignment and time of day, with regime-dependent weights. This study tested a particular port and frozen dataset. Storing the score at zone creation does not itself verify historical/live agreement in every Pine version; see the version-specific repaint check for the higher-timeframe input correction. This study has not been rerun here as validation of the current release.
The product's own tooltip says the score is "neither … a prediction." Its on-chart track record labels itself "small sample, NOT an edge." The pitch has always been context, not a signal.
Fine. But a 0–100 number on a zone implies, at minimum, that 80 should behave differently than 20. That is testable, so we tested it.
The design
Data. The same tape as study #1 in this series — GC=F (COMEX gold futures), 5-minute bars with real exchange volume, 50 full CME sessions from 2026-04-29 to 2026-07-10, 13,640 bars, two holiday partials excluded — re-exported at bar level, because the VP study froze aggregated profiles and this one needs raw OHLCV. Both the export script and the frozen bar file are committed; the analysis reads only the committed file.
The rig. We ported the shipped Pine rules to standalone TypeScript: detection, all five factors, regime classification, scoring, and the resolution state machine. It runs at the toolkit's default settings, with each rule annotated by the Pine line it mirrors.
Outcomes. A zone counts as tested when price returns to its proximal edge. From there, the toolkit's defaults decide the race: respected if price moves 1.0 ATR in the zone's favor from that edge; failed if a bar closes beyond the far edge. Failure wins ties.
An undecided zone expires after 50 bars and is excluded, exactly as the shipped code excludes expiries from training.
The rig detected 1,729 zones (241 order blocks, 1,488 FVGs). 1,693 resolved: 982 respected, 711 failed, for a 58.0% base respect rate. Treat that number carefully.
It comes from a mechanical race between a 1-ATR bounce and a close-through. It is not a win rate, a point we return to below.
We didn't follow the 711 failed zones any further. A failed order block that structure then breaks through is what traders call a breaker block; this study says nothing about those.
The null. For the headline test, we shuffled scores across the resolved zones 2,000 times (fixed seed, committed code). Each time, we measured the respect-rate gap between the top and bottom score terciles. Real information should beat that shuffled deck; decoration should not.
Shuffling breaks any score→outcome link while leaving everything else untouched. It needs no synthetic levels or model of "random zones," and avoids the null-design traps that bit us in study #1.
One more guard. Zones cluster: one impulse can print several FVGs onto the same subsequent price path. Those neighboring outcomes aren't independent, which makes raw p-values look better than they are.
So we re-ran everything on a thinned pool, keeping a zone only if no kept zone of the same kind and side was born within the previous 12 bars. The filter leaves 1,109 zones; we report both readings.
Finding 1 — the composite score fails the shuffle test
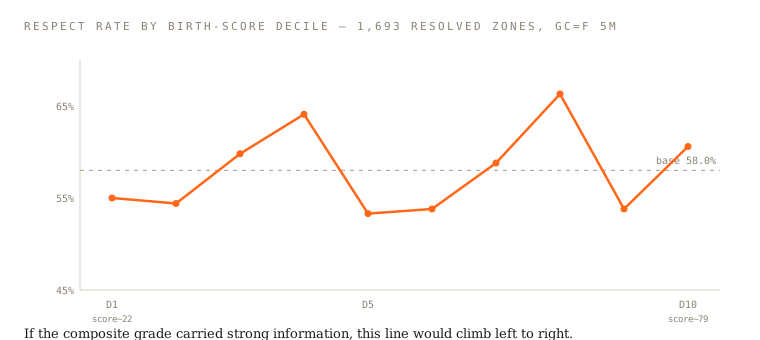
The toolkit's default "act" threshold is a birth score of 70. On this tape, zones at or above it respected 59.8% of the time.
Zones below 40 respected 58.1%. The middle respected 57.4%.
Those three numbers are the finding. The rest is confirmation:
| Reading | Top vs bottom tercile | Shuffle p |
|---|---|---|
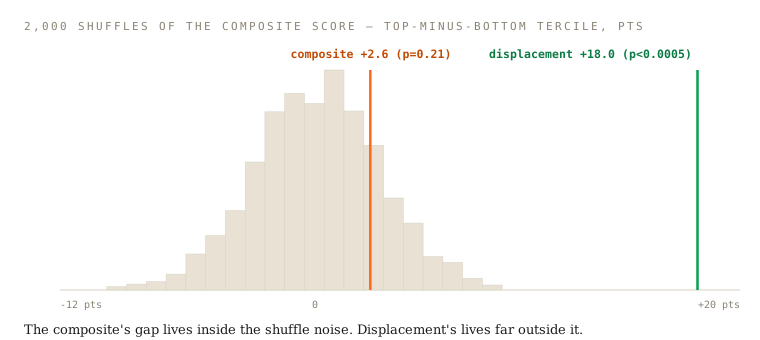
| All 1,693 resolved zones | +2.6 pts | 0.21 |
| Thinned pool (1,083 resolved) | −1.9 pts | 0.72 |
| Stricter respect bar (1.5 ATR), thinned | +4.3 pts | 0.12 |

One sensitivity reading did flash significant. Demand a 1.5-ATR reaction, and the raw pool shows +7.9 points at p=0.003. Thin the clustered zones, and it falls to +4.3 at p=0.12.
That sensitivity to thinning undermines a robust claim. It is consistent with dependence affecting the raw reading, but thinning also changes the sample; this comparison alone does not prove the cause.
Finding 2 — two factors separated outcomes in this window
We then ran the same shuffle test on each ingredient alone. The picture inverted.
| Factor | Top vs bottom tercile (thinned) | Shuffle p | Verdict on this tape |
|---|---|---|---|
| Displacement (impulse vs ATR) | +18.0 pts | < 0.0005 | exploratory association |
| Volume conviction | +10.5 pts | 0.003 | exploratory association |
| Liquidity sweep | −0.5 pts (raw) | 0.56 | no association detected |
| HTF alignment | −0.3 pts (raw) | 0.56 | no association detected |
| Killzone timing | +1.5 pts (raw) | 0.30 | no association detected |

Displacement measures how hard the impulse that created the zone moved relative to ATR. It was the strongest factor in the study and strengthened under thinning (+13.5 raw → +18.0 thinned). Volume conviction held too.
Liquidity sweep, higher-timeframe alignment and time of day did not show a detected association here. Failure to detect one is not proof their effects are exactly zero; these readings are conditional on this dataset, test and power.
Finding 3 — the composite dilutes its own signal
The weights suggest one possible explanation for the difference between the composite and component readings. This is an interpretation of the same sample, not an independently established optimal weighting.
Under the default weight tables, volume and displacement together receive 40% of the weight in a trend regime, 65% in a volatile one, and just 25% in a range. The other 35–75% goes to the three factors that measured flat here.
Range was also the most common regime in this window: 788 of the 1,693 resolved zones. So the biggest slice of the pool was scored under weights that lean hardest on factors with no detected association in this window.
The component results motivate a new weighting hypothesis. They do not show that fitting weights to this same window will improve performance on fresh data.That distinction determines the next test.
What survives, honestly
The 58% base rate is not an edge. The product already says so.
The respect definition is a mechanical race (1-ATR bounce vs close-through, failure-first). The toolkit's own dashboard labels its track record "small sample, NOT an edge."
That honesty holds. Nothing in this study contradicts the product's stated claims, because the product never claimed prediction.
What we tested is association with a mechanical zone outcome. We did not detect it for the default composite here; two ingredients showed exploratory associations. Neither statement estimates a costed strategy return.
The study points straight at a feature the toolkit already ships. Adaptive mode is off by default. Its entire job is to learn factor weights from how zones actually resolve on your chart, using online logistic regression on resolved zones only.
We built adaptive mode as an option. These results motivate testing it, but this study did not validate the online learner, its warm-up, or its future weighting choices. An adaptive strategy needs its own chronological evaluation, with learning based only on earlier resolved zones and a final untouched window.

The transparency loop closed. We could run this audit because the toolkit ships readable source for its zones and their factor and resolution logic. Owners can port those rules to another market and see whether the factors behave differently.
That is the product working as designed, even when the finding stings.
Limits — read before quoting
One symbol (gold futures), one timeframe (5m), one 50-session window. Factor behavior is plausibly market-specific; killzone timing on an FX pair may act nothing like it does on gold.
Our rig is a faithful port of the Pine at defaults, not the TradingView runtime itself. Every rule is line-annotated against the shipped source and the port is committed for inspection, but a port is a port.
Two shipped housekeeping rules are deliberately not applied, because they exist for TradingView's object budget rather than for the statistics: the 500-bar zone age-out and the 400-zone display pool. Adversarial review flagged the first, so the script now prints the age-pruned reading too — 46 late-resolving zones drop, the base rate stays 58.0%, the composite stays null (+1.8 pts, p=0.27 raw; −1.4, p=0.64 thinned), and the displacement association persists (+13.7, p < 0.0005). The headline pattern is similar within this sensitivity check.
The killzone factor applies the Pine's default session strings in New York wall clock — a deliberate mapping choice, stated so it can be argued with. Chart-timezone conventions vary (COMEX itself keeps Central time), any choice shifts the windows, and the factor measured null regardless. How the windows move with daylight saving time: ICT killzones; the one-hour windows inside them: ICT Silver Bullet.
Zones share price paths even after thinning; our 12-bar rule reduces dependence but does not eliminate it. We also ran multiple factor and sensitivity tests. The reported p-values are individual test readings, not a demonstrated family-wide error guarantee or a probability that a factor is real. Treat the selected factors as hypotheses requiring a prespecified test on fresh data.
The sensitivity grid exists to expose fragility, not to shop for significance. That is why we report the raw and thinned readings instead of selecting the most favorable p-value.
Expired zones (tested, undecided after 50 bars) are excluded exactly as the shipped code excludes them from training: 2 zones here, immaterial.
What we're changing
The research next steps are:
- Keep this study's default-weight limitation beside the scoring description.
- Specify candidate weighting changes and their evaluation protocol before testing a fresh chronological window. This original window is development evidence once it informs those choices.
- Keep adaptive mode experimental until its own evaluation supports a narrower claim. A fixed-factor association does not justify recommending an untested online learner after warm-up.
These are research requirements, not a statement that a new profitable configuration has shipped. Future results should identify the version, dataset, costs, trial history and remaining limitations.
The shuffle test
Take any indicator score. Rank what it grades, split the top third from the bottom third, then shuffle the grades a couple of thousand times and see whether reality beats the shuffle. The test takes twenty lines of code and has no respect for marketing.
The composite did not show statistically detected separation in this protocol. Two ingredients showed exploratory associations. The reported results and reproduction command are public here; the frozen-data and repository-access requirements still apply.
An honest score isn't one that always passes. It's one that was actually tested — and prints the result either way.The concepts behind those zones, one written rule each and animated: smart money concepts.