Every volume profile tutorial ends the same way.
The histogram appears. The presenter circles its fattest bar. And then the sentence arrives, always in the same confident register:
"Price is drawn back to the point of control."
Drawn. Like gravity.
Type volume profile trading strategy into a search bar and you'll drown in that sentence; type it into a test harness and the results thin out fast. We sell a volume profile indicator — it says so two sections down, with the price — and we could not find one published measurement of the sentence anywhere in the top fifty results.
So we ran one: 50 sessions of real gold-futures volume, every prior-day POC and value-area edge tested against a control group of random levels — plus the famous "80% rule," measured under three readings instead of repeated. The map survived. The magnet didn't.Two requests before we start:
- Save this next to whichever course told you "price seeks the POC."
- Send it to one trader who marks yesterday's POC every morning — the results section is going to be a strange gift.
Skip this if you want the verdicts
Sixty-second version: a volume profile is a histogram of volume at price — the POC is its heaviest price, the value area the band holding ~70% of volume around it. That construction is real and useful: it describes where trade happened. What we tested is the folklore built on top, on 50 CME gold-futures sessions (real exchange volume, 5-minute bars, April 29 → July 10, 2026), with every claim scored against a control group: random levels at a similar distance from the open, never the level itself. Results: (T1, the magnet) yesterday's POC was touched in 69.4% of next sessions — random control levels: 71.5%; VAH and VAL likewise sit at or below their controls; no detectable pull toward any of the three. (T2, respect at touch) one finding survives with an asterisk: touched POCs rejected price more often than touched control levels in all nine parameter cells (+7 to +19 points) — but at ~34 touches the per-cell uncertainty swallows the effect, so its honest grade is suggestive, unproven; VAH shows nothing; VAL flips signs by cell. (T3, the "80% rule") open outside value: the textbook traverse-the-area reading scored 46.7% of re-entries, the loose touch-the-POC reading 50.0%, and even the friendliest hybrid (73.3%, n=15) is an underpowered maybe — no reading reaches the number in the rule's own name. What survives is the profile as a map — where volume clustered, whether today opened inside or outside yesterday's value — which is context. Which is precisely why the one we sell is tagged "Context, not a signal." The calculation uses scripts and frozen data held in our private website checkout; these materials are not public downloads from this article.
| The folklore says | The measurement says |
|---|---|
| "Price is drawn to the POC" | 69.4% touch rate — random control levels: 71.5% |
| "Value-area edges hold" | VAH ≈ control, VAL sign-flips by cell — nothing stable |
| "The POC rejects price on touch" | The one survivor: +7 to +19 pts over control in all 9 cells — suggestive, unproven at n≈34 |
| "The 80% rule" | Textbook reading 46.7%, loose 50.0%, friendliest 73.3% (n=15) — none reach 80 |
| "Works on any chart" | FX "volume" is tick count, not contracts — a different object (§VII) |
I — What a volume profile actually is
Before testing the folklore, the construction — because most tutorials skip it, and it's where the honest value lives.
Take one session of bars. Slice the session's price range into bins ($0.50 wide, in our study). For each bar, spread its volume across the bins its high–low range covers. Stack. The result is a sideways histogram: volume at price rather than volume at time.
Three landmarks fall out of it. The point of control (POC): the single heaviest bin — the price where more business was done than anywhere else. The value area: expand outward from the POC, always absorbing the heavier neighbor, until ~70% of the session's volume is inside; its edges are the VAH and VAL. None of this is prediction. It's accounting: this is where the market found two-sided trade yesterday.
That's the map. It is genuinely informative the way a topographic map is — it tells you the terrain, not tomorrow's weather. The folklore starts when the map is promoted into a magnet: price seeks the POC, value edges hold, and if you open outside value you fill it 80% of the time. Those are testable sentences. Almost nobody tests them.
II — What we tested, and against what
Data. GC=F — COMEX gold futures — at 5-minute resolution with real exchange volume (why futures and not spot FX matters is §VII). Sessionized to CME gold days (18:00 ET → 17:00 ET); two holiday partials dropped by rule; 50 full sessions, 49 prior→next pairs, April 29 to July 10, 2026. The processed dataset and analysis remain in our private checkout. The method is described here, but an outside reader cannot rerun it from this page alone. This study adds the one thing the resampling piece and the ruin grids didn't need: a control group.
The trap this study avoids. Test "does price touch yesterday's POC?" naively and you'll get an impressive number — because any level near where price already is gets touched a lot. Profiles cluster near yesterday's close, which is near today's open. So every claim here is scored against a distance-band null: 1,000 random levels per session, each placed at 80–120% of the real level's distance from today's open, random side, inside yesterday's range — and never within $2 of the real level, so the control never accidentally is the thing it's controlling for. That last clause exists because our first design got it wrong: the original mirror null let most "random" draws land exactly on the real level, and our adversarial reviewer caught it. Both designs return the same verdicts; the clean one is what's published, and the one place the fix genuinely changed the picture is §IV — reported there, not buried. Seeded PRNG (seed 7, the house standard), so your rerun produces our digits exactly.
III — T1: the magnet claim
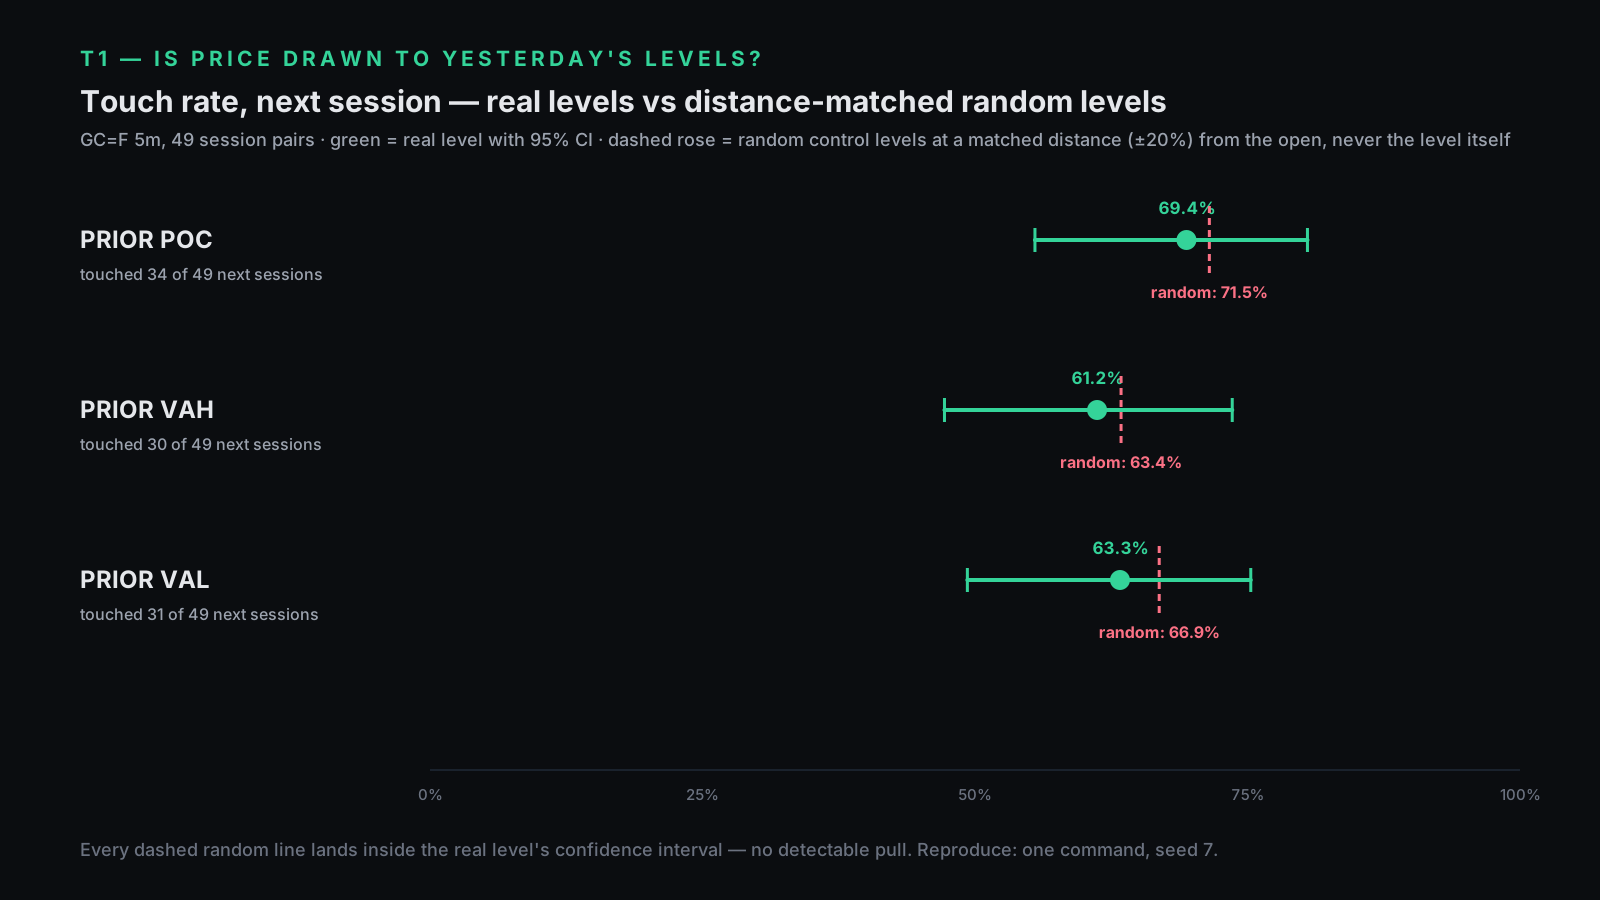
Touch rates on the next session, real levels vs their control groups:
| Level | Touched | Rate [95% CI] | Random control |
|---|---|---|---|
| Prior POC | 34 / 49 | 69.4% [55.5, 80.5] | 71.5% |
| Prior VAH | 30 / 49 | 61.2% [47.2, 73.6] | 63.4% |
| Prior VAL | 31 / 49 | 63.3% [49.3, 75.3] | 66.9% |
Read the last two columns together. Every control-group rate sits comfortably inside the real level's confidence interval — and all three real levels were touched slightly less often than their random controls. Two-thirds of the time price revisits yesterday's POC, which sounds like gravity until you learn that two-thirds of the time it revisits any line drawn that far from the open.
IV — T2: "levels get respected" — one survivor, graded honestly
Second claim: fine, price reaches the level by chance — but at the level it reacts. We measured it: at the first touch, does price move $R back toward where it came from before cutting $R through, within H bars? Because any single choice of R and H would invite cherry-picking, we ran the full grid — R ∈ , H ∈ bars — every cell against its own control group.
Two levels produce nothing: VAH hugs its control (−3.3 to +6.6 points, sign flipping); VAL swings −7.6 to +27.2 with the big values confined to one corner of the grid (R=$8) — the signature of small-sample noise, not structure.
The POC is the interesting one. Touched POCs rejected price more often than touched control levels in all nine cells, by +7.0 to +19.1 points. A sign that stable across every parameter choice is not what noise usually looks like — though the nine cells share the same ~34 touches, so they're correlated looks at one sample, not nine independent confirmations — and we'd have missed it entirely under our original contaminated null, which compared the POC mostly against itself. Honesty requires printing it. Honesty also requires grading it: at roughly 34 first-touches, the per-cell uncertainty is wider than the effect, and a paired look at the same data finds only a handful of decisive pairs. So the grade is suggestive, unproven — a hypothesis this dataset can raise but cannot confirm. If it's real, a 300-touch study would show it cleanly; ours can't, and we won't pretend otherwise.
What this section does not license: "the POC is support/resistance, trade the bounce." The magnet claim already failed (§III) — price is not pulled to the level. The open question is narrower: conditional on arriving, is the largest volume shelf slightly stickier than a random shelf? Maybe. That word, at this sample size, is the entire finding.
V — T3: the 80% rule
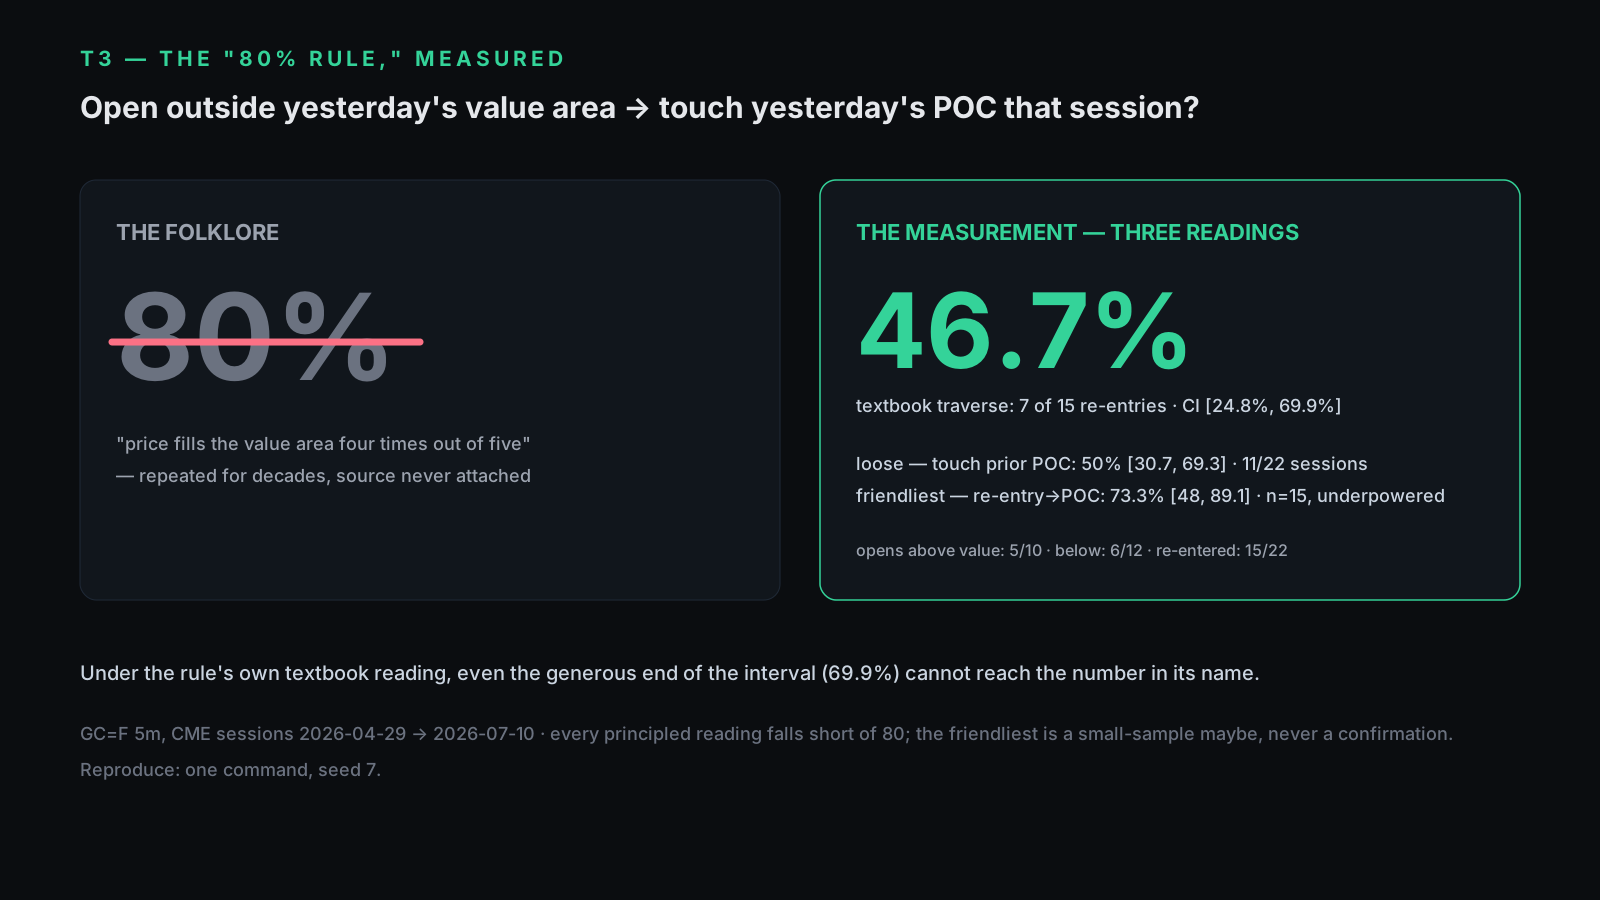
The most quoted sentence in profile trading: if price opens outside the value area and re-enters, it fills the area ~80% of the time. Recited for decades and, as far as we could find, never with a primary source attached — so we measured it under three principled readings, friendliest to strictest, on the 22 sessions that opened outside the prior value area:
| Reading | Result | 95% CI |
|---|---|---|
| Loose — touched the prior POC at any point (all 22) | 11/22 = 50.0% | [30.7, 69.3] |
| Re-entered the value area at all | 15/22 = 68.2% | [47.3, 83.6] |
| Textbook — re-entered, then traversed to the far edge | 7/15 = 46.7% | [24.8, 69.9] |
| Friendliest hybrid — re-entered, then touched the POC | 11/15 = 73.3% | [48.0, 89.1] |
The rule's own textbook form — open outside, re-enter, fill the area — happened in fewer than half of its qualifying sessions, and even the generous end of its confidence interval (69.9%) cannot reach the number in the rule's name. The loose reading is a coin flip. The friendliest hybrid gets closest at 73.3%, but on fifteen sessions its interval spans 48 to 89 — that's not a confirmation of 80; it's a shrug with error bars. Across every reading, the pattern is the same: outside-opens are a regime observation (imbalance, someone's trapped), not an appointment price keeps four times out of five.
VI — What survives
Everything above kills prophecies, not the profile. Here's what the same 50 sessions actually support:
The map is real. The value area contains ~70% of volume by construction — where the market did business yesterday is a fact, not a forecast, and knowing it beats not knowing it the same way a map beats a blank page. The regime read is real. "We opened inside yesterday's value" (balance, both sides comfortable) vs "outside it" (imbalance) is a structural observation that needs no magnet to be useful — our T3 sample is that classification, honestly computed. The context discipline is real. A profile tells you where a reaction, if you get one, would be interesting — §IV even leaves the POC a sliver of unproven stickiness once price arrives on its own. What a profile cannot do, on this data, is bring price anywhere.
What does not survive: trading a level because the histogram is fat there, expecting the fatness to pull price toward it. On this data, it doesn't.
VII — Tick volume vs real volume
The part almost no FX tutorial mentions, taught in one paragraph: futures volume (this study) counts contracts actually traded on an exchange. Spot forex and CFD charts have no central exchange — so every "volume" profile on an FX chart, from any vendor, ours included, is built from tick volume: the number of price updates, not the amount transacted. Tick count and true volume correlate decently on liquid pairs during active hours, and tick-based profiles still map where price spent effortful time — but they are a proxy, and thin-session tick spikes can paint bins no institution traded in. We used real futures volume here precisely so the folklore got its best possible chance. It still failed. On tick-volume charts, every claim above starts one honesty rung lower.
Limits
One instrument (gold futures), one ~ten-week window, 49 pairs — small; the CIs above are honest about how small, and §IV's survivor is graded accordingly. Five-minute bars force the standard uniform-spread approximation when binning a bar's volume. The parameter grid is nine cells — we report the whole grid and call its lone hot corner noise rather than fishing it for significance. Our first null design was self-contaminated (it mostly sampled the real level back at itself); adversarial review caught it before publication, both designs agree on every verdict, and the one place the fix changed the picture — the POC respect-tendency in §IV — is reported in full rather than quietly absorbed. "Touch prior POC" and "traverse the area" are two of several possible operationalizations of a rule that has never had an official one. Nothing here forecasts any account, any market, or next month's gold. The shape of the findings is the result; the second decimal is not.
Reproduction requirements and access
The analysis command is node --experimental-strip-types scripts/research/volume-profile-study.ts. It requires our private website source checkout and the referenced frozen market data; neither is supplied as a public download here. Product source access does not include this research rig. Public redistribution rights for the market data have not been established. A command alone is not independent reproducibility.
Readers can inspect the test definitions, controls and limits described in this article. A separate implementation with data you are entitled to use can test the same question, but different inputs or sampling choices may change the result. The research index distinguishes this study from the public monthly-bootstrap arithmetic package. If you identify a calculation error or obtain a contradictory result, send the method and source to support@pulltrade.app.
Where we sit
Bias, priced: we sell Advanced Volume Profile — $49, part of the 11-tool Pine v6 bundle at $46, full source included — and its tagline has said "Context, not a signal." since before this study existed. Today those four words have data under them: the profile it draws is the map (§I, §VI) — session and composite volume distributions, POC and value areas computed the same transparent way this study computes them, in source you can read line by line. What it will not do is flash "BUY — the POC is calling," because §III is what that call is worth. If you want a profile tool that promises the magnet, the internet is full of them; ours promises the accounting, and now you've seen exactly why.
Disclosure
Data: Yahoo Finance chart API, GC=F, 5-minute bars, fetched 2026-07-11; the processed session dataset and scripts are retained in our private website checkout. This article describes their method but does not provide public access to those files. Internal reruns use the frozen inputs; a fresh data window can change the findings, not merely their decimal places. The "80% rule" is quoted as circulating folklore; we searched for and could not locate a primary source, and would welcome a correction to support@pulltrade.app. Our first null design contained a flaw our own adversarial review process caught; the correction and its effect are described in §II, §IV, and Limits. We sell the indicator this article contextualizes. No number here is a promise about any market or account; this is measurement, not advice.
Your first 20 minutes
Tonight, free, on any chart with a session profile: mark yesterday's POC, VAH, VAL — then also mark one random level the same distance from today's open. Watch both for a week with the same eyes. That one habit — carrying your own control group — is this entire article in miniature, and it will inoculate you against every "price seeks the level" sentence you'll ever hear again.
The histogram was never wrong.
The prophecy stapled to it was.
Volume profile earns its place as a map of where the market did business — and loses it the moment someone sells you the map as a magnet. Buy maps. Test magnets.