You're down 30%.
Your brain says you need 30% back. Sounds manageable.
The real number is 42.9%.
That gap turns up in every blown account's autopsy. Losses and gains aren't symmetric. The deeper the hole, the harder the math bites.
This piece gives you the whole recovery table and shows you how to diagnose which of three drawdowns you're actually in. Then comes one number most vendors would bury from our own system: 73%.Two requests before we start:
- Save this for the day you're down 20% and calm, before you're down 40% and anything but.
- Send it to one trader who just doubled his size to "make it back."
I — Why -30% needs +42.9%
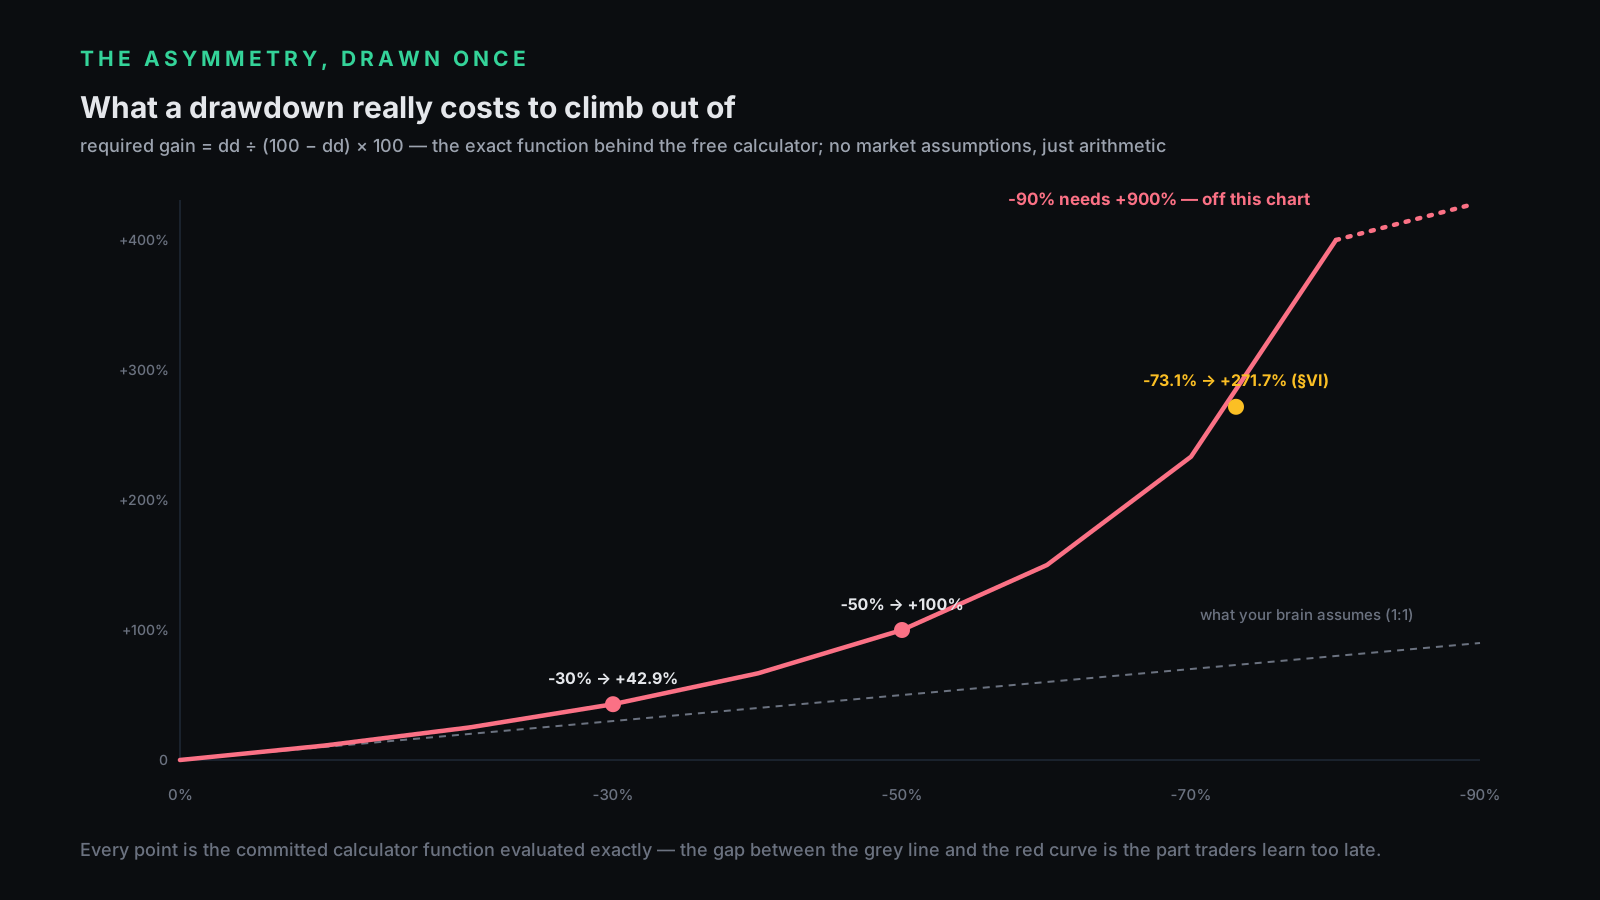
After a loss, you're earning gains on a smaller base. The formula fits on one line: required gain = drawdown ÷ (100 − drawdown) × 100. That's it.
Put dollars on it. A $10,000 account drops 30% and holds $7,000.
To climb from $7,000 back to $10,000 you need $3,000 of profit, and $3,000 on a $7,000 base is 42.9% rather than 30.
The base shrank beneath you, leaving the percentage you lost and the percentage you owe as different numbers. Small drawdowns hide that gap; deep ones are made of it.
II — The full recovery table
This table comes straight from the same public function our calculator runs. Find your row.
| You're down | You need back |
|---|---|
| 10% | 11.1% |
| 20% | 25.0% |
| 30% | 42.9% |
| 40% | 66.7% |
| 50% | 100.0% |
| 60% | 150.0% |
| 73.1% | 271.7% — hold this row for §VI |
| 80% | 400.0% |
| 90% | 900.0% |
Two things jump out: the tax stays annoying but civilized down to -20%; past -50%, you're building a new one with worse morale.
The table leaves out the hard questions: how long recovery takes, and whether your edge survived at all. Percentages are the easy part.
III — Which drawdown are you in?
There are three kinds of drawdown, and the right treatments can point in opposite directions. Diagnose yours wrong and you go after the thing that wasn't broken.
Strategy drawdown. Your edge stopped paying. You followed your rules and still bled, trade after rule-following trade.
Execution drawdown. The edge is fine, but you stopped trading it. The record shows revenge entries and dragged stops, along with sizes your plan never approved.
Regime drawdown. The market changed shape under your strategy. A trending system gets trapped in a two-month chop; a mean-reverter meets a runaway trend.
You cannot diagnose this by feel. Feel always votes "execution," because blaming discipline flatters the strategy you built.
Use your journal's plan-followed flag. Split the drawdown period into two piles: trades that followed the written rules and trades that didn't. A profitable rule-following pile beside a hole made by the rule-breakers points to execution. If the rule-following pile dug it, that's strategy or regime.
IV — How to recover from a trading drawdown
The plan is boring on purpose. A drawdown puts emotion in charge, and the recovery protocol takes decisions away from the brain itching for revenge.
First: stop adding data to the wound. Close the platform for a couple of days. The point is distance, enough to read your own journal like evidence instead of accusation.
Second: run the split from §III. One evening is enough to sort the two piles and do the arithmetic honestly. Now you know which problem you're solving.
Third: match the fix to the diagnosis. For an execution drawdown, your rules survive; your access to them failed. Add the day-ceiling sentence and a cooldown rule, then trade small until the rule-break count reads zero for twenty trades. For a strategy or regime drawdown, stop trading it live. Take it back to testing: more live trades won't wake a dead edge.
Fourth: come back at quarter size. The first job is proving the process still works. At 0.25×, that proof is cheaper, even though the money comes back more slowly.
The honest version fits in one line: recovery is an audit with small trades attached.
V — The trap that digs the hole deeper
The most dangerous week of a drawdown begins when you size up to "make it back fast." The danger is in the math.
You're down 40%, owing 66.7%. Doubling your risk feels like halving the distance.
But doubled risk on a shrunken base is how -40% becomes -60%. At -60%, the account no longer owes 66.7%; it owes 150%.
We measured what risk-scaling does to survival odds across twenty thousand simulated accounts in the ruin study. Between 2% and 5% risk per trade, the curve falls off a cliff. Recovery sizing heads straight for it when your judgment is worst.
Down big, the sizing question that matters is: what's the largest size at which I genuinely don't care if the next trade loses? Trade that size, however much smaller it is than you want. That's the point.
VI — Our 73%
We sell a gold EA. Its long backtest once sat 73.1% below its own peak, and we publish that number because you should ask every vendor for theirs.
The modelled 28-month run behind MTR's headline curve peaked at $4.54M in November 2025. It fell to $1.22M by March 2026, then closed at $3.72M. Peak to trough, that lands on the 73.1% row in §II's table.
Now watch the row work. Off that trough the run climbed 205% in eleven weeks, a monster recovery by any standard. Still not enough.
The table demanded 271.7%. At close, the account sat 18% below its old peak — a comeback that looks heroic on a chart, and it hadn't finished paying the hole's bill.
Be careful what you take from this. It's a modelled backtest, Model=0 generated ticks; the same config has produced anywhere from 166× to 575× across data snapshots, and none of it is a promise about any account. The drawdown row does not prove profitability; it shows what surviving a deep hole looks like in data, plus what any seller's "smooth" equity curve leaves out.
Every "best EA" page shows you a peak. Ask for the trough. If they won't print it, you've learned something more useful than their win rate.
The 20-minute drawdown audit
Minutes 0–5: compute your real drawdown from peak equity to now, not deposit to now; find your row in §II and write both numbers down. Minutes 5–12: run the §III split on the drawdown window, pile one (followed plan) vs pile two (didn't); one evening of honesty beats a month of feel. Minutes 12–17: write the diagnosis in one sentence and put the matching fix from §IV under it. Minutes 17–20: set the comeback size at a quarter of normal; where tomorrow-you can see it, write the condition for scaling back up: twenty trades with zero rule-breaks.
Disclosure
Every recovery percentage here is the output of our published calculator function; the 73.1% drawdown and its dates come from the committed dataset behind MTR's public backtest chart, which is modelled and labeled as such everywhere it appears. We deliberately cite no third-party trauma statistics. The cortisol studies and journaling surveys that circulate in drawdown articles never come with sources we could verify, so they don't come with this one. We sell tools in this lane: a free calculator, a $47 journal that splits system from tilt, and an EA whose worst drawdown you just read. If any number above disagrees with the calculator, email support@pulltrade.app — this page and that function can't both be right, and whichever one is wrong gets corrected where everyone can watch.
Before you open the platform again
The audit above takes one calm evening, and nothing in it requires talent. That's the design. Talent is what got optimistic; arithmetic is what walks you home.
Find your row. Name your drawdown. Come back at quarter size, and let the table be the only thing in the room without an opinion.