A backtest cannot tell you whether a system works — only whether it worked, once, on one path, under assumptions someone chose. This field manual is the full list of what a perfect curve hides, and the checks that expose each one.
The equity curve is the body on the floor.
The report is the witness statement — confident, partial, quietly self-serving.
The strategy code is the suspect.
The broker model is the alibi nobody checked.
Your job is not to admire the chart.
Your job is to find out what actually happened.
Most traders do the opposite. They see a clean curve, a high win rate, a balance line that only climbs, and they feel the small dopamine click that says finally. Then they buy the EA. Three weeks later the live account behaves like a different animal, and the verdict comes fast: "the strategy broke."
Maybe. But more often the strategy didn't break. The screenshot was never the strategy.
Before we go further, two requests:
- Save this before you buy your next EA, signal, funded-challenge bot, or "AI trading system."
- Send it to one trader who's about to hand real money to a beautiful backtest.
Not because backtests are useless — they're one of the sharpest tools we have. But a backtest read like prophecy is dangerous, and a backtest read like an investigation is priceless. Here's how we run the investigation.
Skip this if you already know why screenshots lie
A backtest is one sentence with too many clauses:
If the future rhymes with this slice of the past, if your broker fills like the tester did, if spread stays inside the assumed range, if slippage doesn't bite harder than modeled, if the code never accidentally saw the future, if you execute every trade without flinching, and if the next bad regime is no worse than the sampled one — then this is what would have happened.
Count the ifs. That's not a prediction. It's a conditional, and a fragile one. Which doesn't make it worthless — a good backtest earns its keep:
| A backtest CAN | A backtest CANNOT |
|---|---|
| Kill a bad idea cheaply | Promise a single dollar of future profit |
| Expose fragile logic | Reproduce a regime that hasn't happened yet |
| Show whether an edge survives basic costs | Match your broker's spread, slippage, and fills |
| Reveal the shape of drawdown | Prove the worst drawdown is behind you |
| Compare variants on equal footing | Turn a hypothesis into a guarantee |
Here's the part that should bother you most: most bad backtests aren't frauds. Nobody photoshopped them. They're incomplete — every number technically true, with the one number that matters left off the page. Incomplete truth is far easier to sell than a lie, and far harder to catch.
I — The screenshot is not the system
We've watched smart people fall in love with a JPEG. Not beginners — engineers, founders, traders who understand variance in theory and forget it the moment a curve is smooth enough.
You know the picture. Bottom-left to top-right, shallow dips, no ugly months. The kind of line that makes the brain whisper finally. That whisper is the most expensive sound in trading.
Because the screenshot is not the system. The system is everything underneath it: the entry and exit logic, the order lifecycle, the position sizing, the spread and slippage models, the tick path, the stop and hedge and recovery behavior, the open-equity path, the stuck inventory, the regimes it loved and the ones it barely survived. A retail report hands you the movie poster. A real audit asks for the raw footage. Three cuts get you most of the way there.
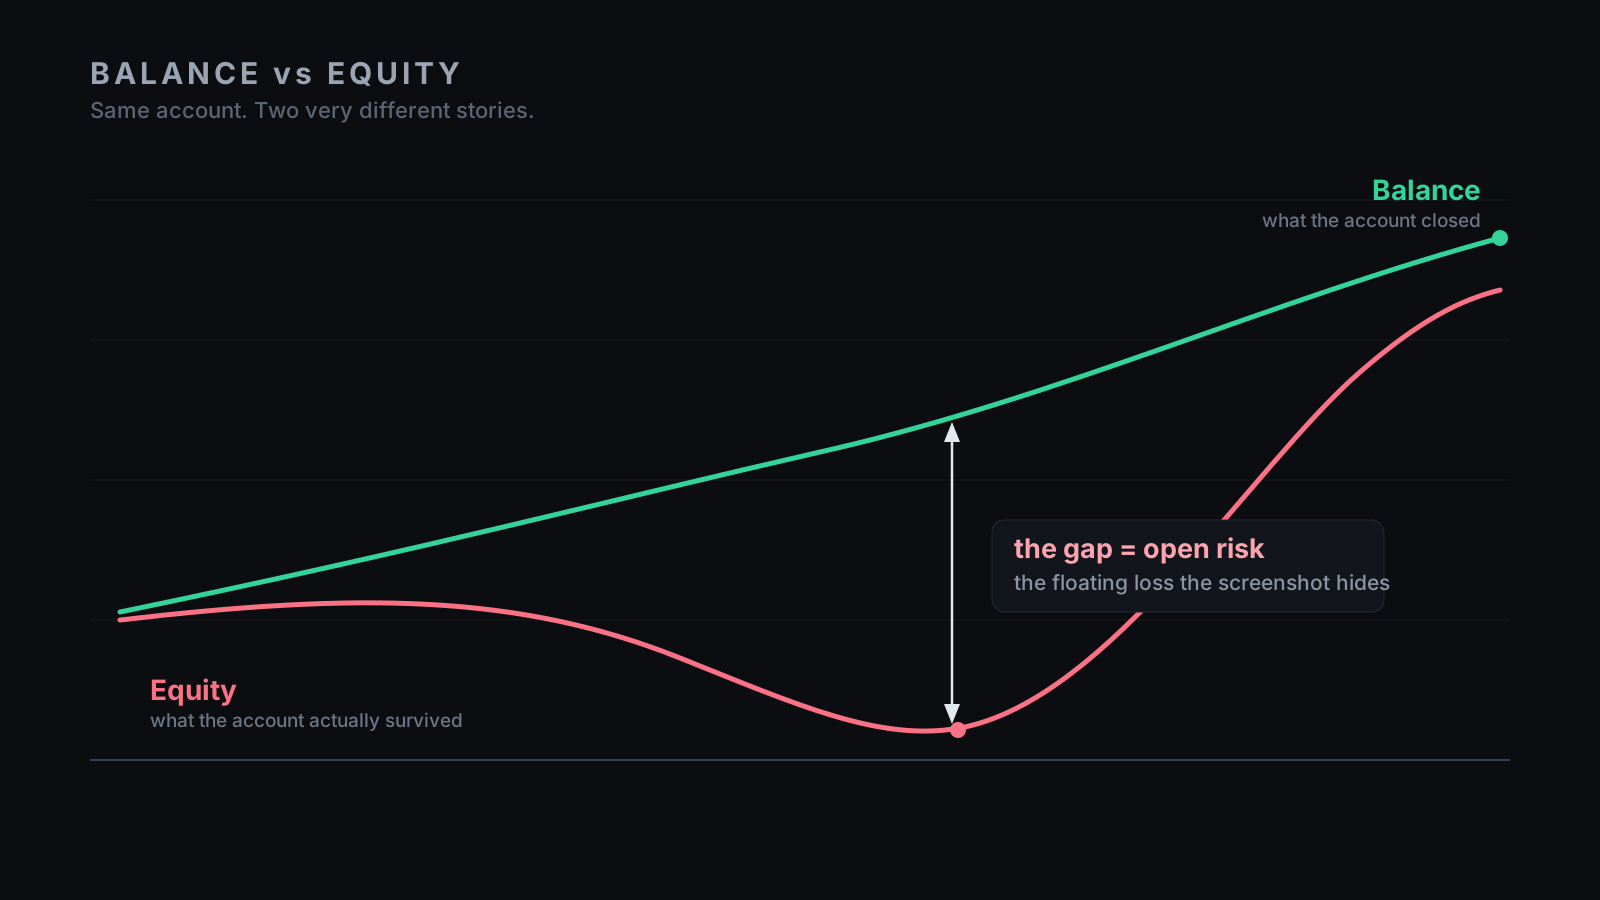
Step 1 — Separate balance from equity. Balance is what the account has closed. Equity is what it's living through. Plenty of EA reports look serene on balance and brutal on equity, because the system books small winners daily while carrying one enormous floating loss. The balance curve smiles. The equity curve screams. See only balance and you've met the friendly half of the animal.
Step 2 — Separate closed profit from open risk. Closed profit is not solved risk. A grid books winners and lets losers float. A hedge closes profitable baskets while net inventory grows. A recovery ladder looks stable right up until price trends and never hands it a clean exit. The report isn't lying — it's doing something more dangerous: telling the truth with the worst number missing.
Step 3 — Separate strategy logic from broker fantasy. A system doesn't run in a vacuum; it runs inside a broker. So the real rule isn't "buy here, sell there." It's "buy here if spread is this, exit there if the stop fills there, hold overnight if swap doesn't bleed, recover if margin survives, close if the book gives you the liquidity." A backtest that assumes a polite broker isn't conservative. It's fantasy with decimals.
II — Where backtests cheat without meaning to
"Look-ahead bias" sounds criminal. It rarely is. Most of the time nobody meant to cheat — the code just built a tiny time machine, and a tiny time machine is enough.
The signal-bar fill. A signal forms when the candle closes, but the fill gets logged at a price from inside that candle. That's not trading; that's entering after you've seen the end of the scene and pretending you were early. For scalpers and breakout systems, that single shift can be the entire edge.
Repainting. Some structures look flawless because their past keeps editing itself — ZigZag-style pivots, certain "non-lag" indicators, support/resistance that only confirms after future candles arrive. On history it's clean. In real time it was guessing. A repainting system doesn't show you what the trader saw; it shows you what the chart wished it had seen.
Full-sample normalization. Subtle and common. You z-score a feature using the mean and standard deviation of the entire dataset — so a 2022 signal is computed with 2024 statistics, and the early bars quietly "know" the future. The chart won't confess. The code has to.
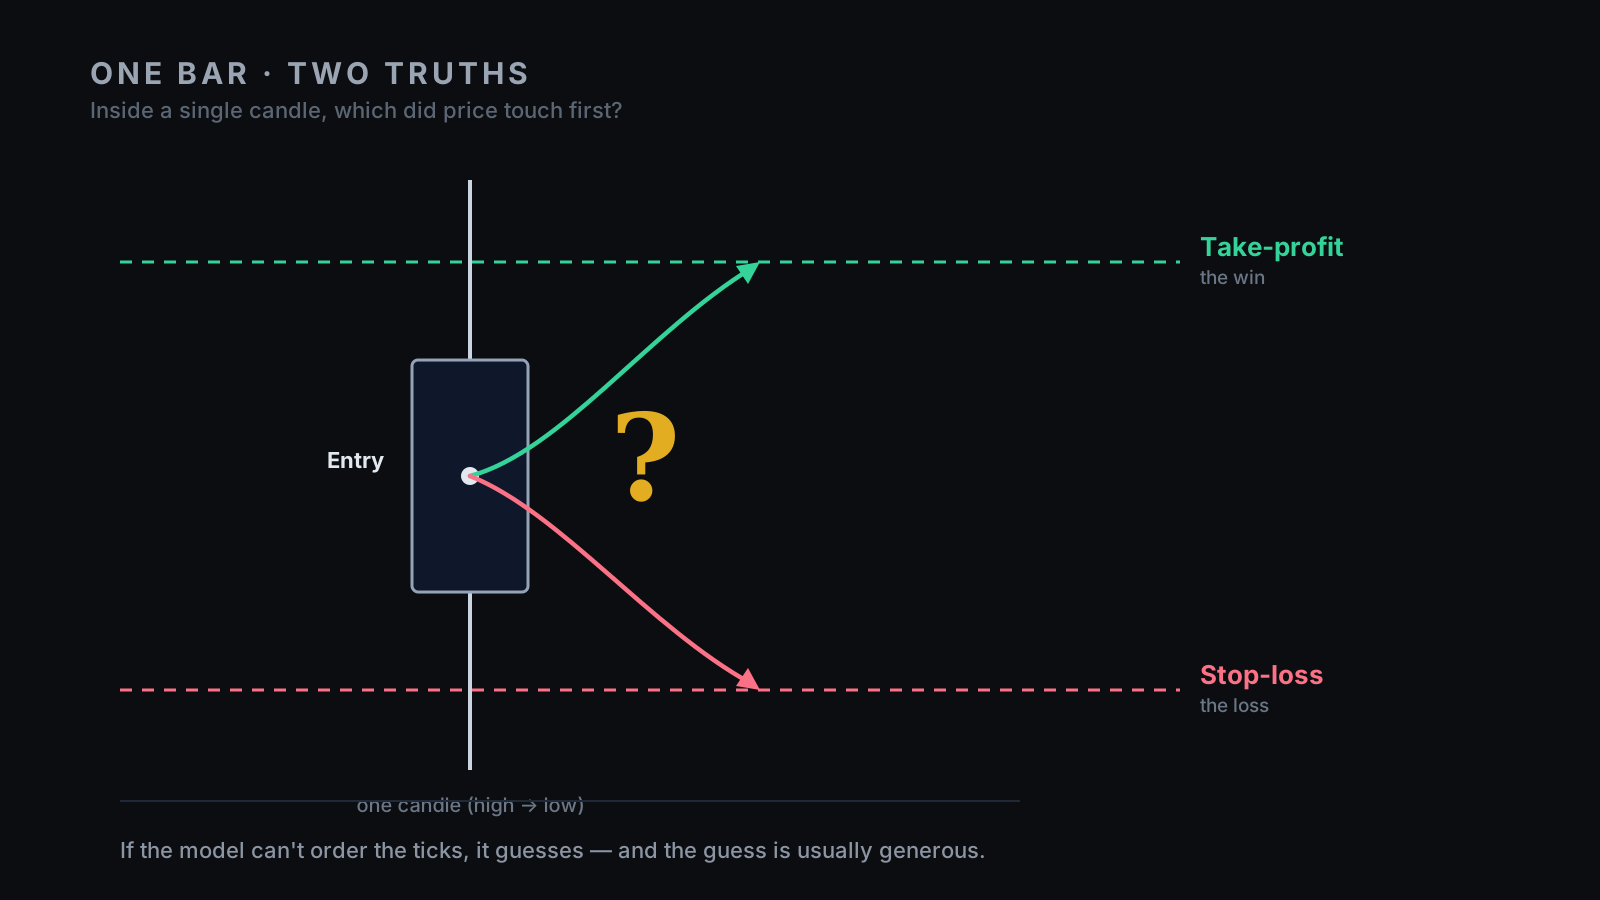
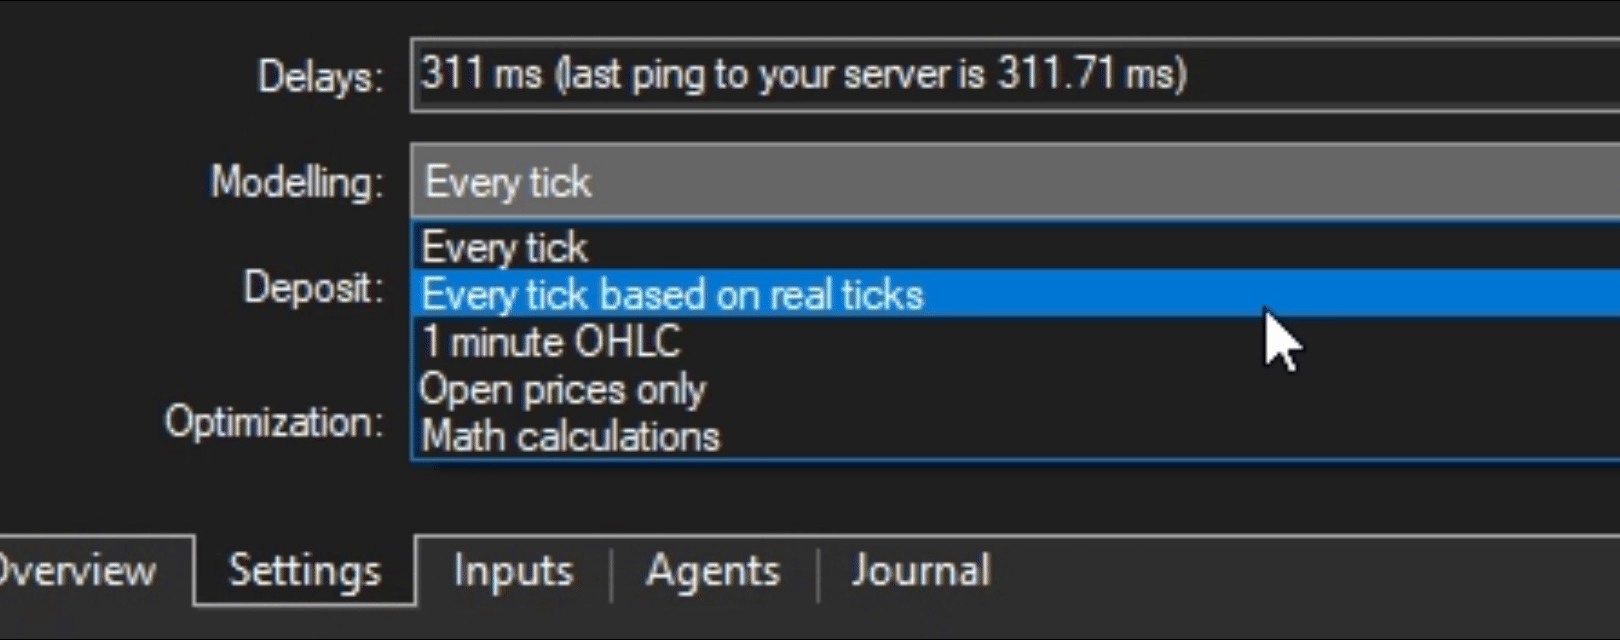
The friendly tick path. Huge in MT5 systems. When one candle touches both the take-profit and the stop, which filled first? If the model doesn't know, it guesses — and the guess is often generous. For anything with tight stops, trailing exits, or basket closes, the assumed intra-bar sequence can flip a loser into a winner. That isn't a rounding detail. That is the trade.
The only defense is paranoia: assume a leak until the code proves there isn't one. Which, again, you can only do if you can read the code.
III — The hidden-drawdown problem
Here's where systems stop being merely disappointing and start being dangerous — not because they lose (everything loses) but because they hide the shape of losing.
An honest strategy loses by closing losing trades. A dangerous one loses by refusing to admit the loss exists yet. It stores the loss — in floating drawdown, in hedged exposure, in recovery ladders, in stuck inventory, in margin, in time — and keeps showing you closed profit and a tidy win rate. That isn't risk management. It's risk storage, and the bill arrives all at once.
Grids. A grid isn't automatically bad; it can be engineered with real discipline. But its core dependency is brutal in its simplicity: it needs price to give it exits. Range, and it looks brilliant. Trend slowly with pullbacks, still fine. Trend hard and refuse to breathe, and it starts negotiating with gravity — layer by layer, basket by basket. So the question is never "did the grid profit in backtest." It's "what did the grid need to survive the worst path" — how many layers, how much margin, how deep the equity drawdown, how long inventory sat stuck, and how much profit came from clean exits versus from recovery. If those answers are hidden, the system isn't transparent.
Hedges. Hedging sounds safe; sometimes it is, and sometimes it's accounting theater. Opposing tickets feel like protection, but the account doesn't care about the comfort of symmetry — it cares about net exposure, margin, swap, and whether the basket has a defined way out. A hedge with no exit policy isn't protection. It's a waiting room.
Recovery. Recovery can help, but recovery is not an edge. Adding size after pain doesn't manufacture alpha; it reshapes the distribution — usually smoothing the small and medium outcomes while making the tail uglier. That trade can be acceptable, if it's measured out loud. The only honest question is whether recovery solved risk, or merely postponed it until the sample happened to end.
IV — Costs are the battlefield
This is the boring section, which is exactly why it's the one that empties accounts. Entries are fun. Filters are fun. Dashboards are fun. Costs are where the fun goes to get liquidated.
Spread is a tax you can't see. It collects rent on every trade, win or lose, and it widens at precisely the wrong moments — news, rollover, thin liquidity, fast moves, broker stress — the same moments a backtest politely averaged away. A scalper living on a few points of edge can be underwater the instant a 1-pip assumption meets a 3-pip reality. A grid pays that tax on every single layer. (We wrote a whole piece on this one number; it's the most underestimated cost in retail trading.)
Slippage isn't symmetric. Backtests love clean stops; markets don't. Your best fills come when you don't need them, and your worst come when everyone wants the same exit at once — so slippage bites hardest exactly when the system is already under stress. Average slippage is still too kind. You need the stress case, because the day it shows up is the only day that matters.
Swap and commission are quiet. Small per trade, decisive over thousands. Commission bites high-frequency systems; swap bites long holds; grid and recovery underestimate both because the pain is slow. Slow pain is still pain — it just has better manners.
Rollover is where polite assumptions die. Spread gaps, liquidity thins, swap posts, stops and basket exits get messy. If a system trades through rollover, the test has to respect it. If it avoids rollover, the rules should say so. If nobody knows, that's not a detail — it's an untested risk wearing a confident face.
Model costs pessimistically, or the market will model them for you, at a worse price.V — Overfitting is gravity
Everyone knows overfitting is bad. Almost nobody respects how strong the pull is.
The honest version of research looks completely innocent. You try a parameter — meh. Another — better. Add a filter — better. Drop a bad session — better. Test twelve symbols, keep the three that worked. Every step feels like intelligence, and some of it is. The rest is asking the past so many questions that it eventually tells you something flattering. That's the garden of forking paths: the more variants you run, the prettier your winner looks and the less that beauty means — unless you penalize it for winning a contest against its own history. (Quants formalize this as the deflated Sharpe ratio and the probability of backtest overfitting. Plain version: an in-sample Sharpe measures how hard you searched, not how good the strategy is.)
Reference: López de Prado, "The Deflated Sharpe Ratio" (2014); Bailey & López de Prado, "The Probability of Backtest Overfitting" (2014).
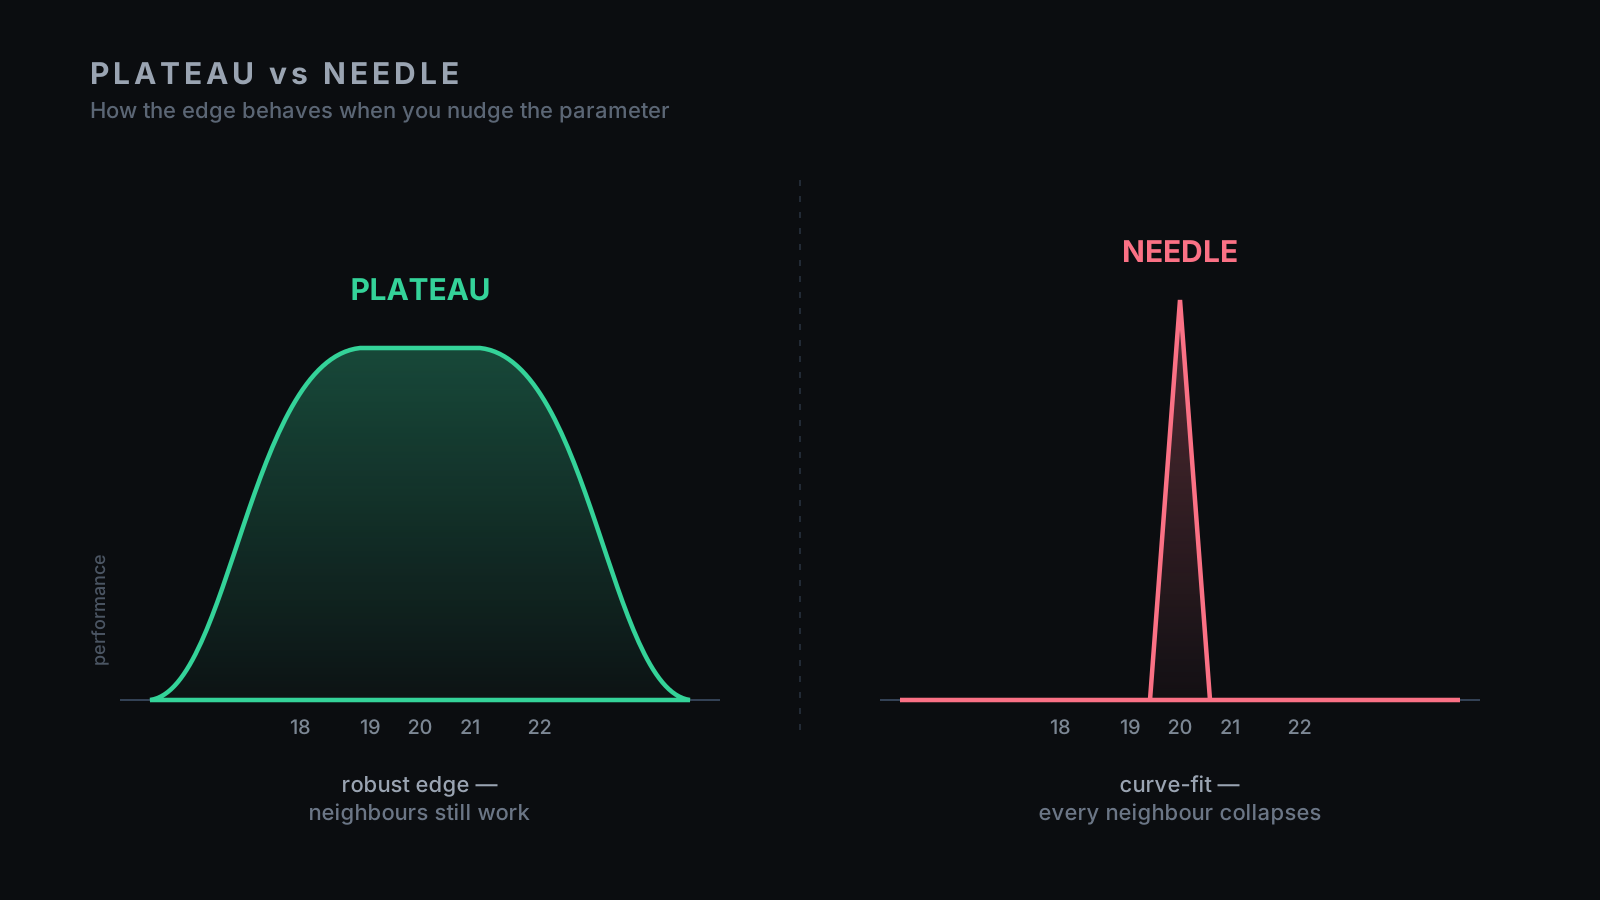
So we never want to see only the best setting. We want the neighbourhood. If a 20-bar lookback works, what do 18, 19, 21, 22 do? If an ATR multiple of 1.8 works, how about 1.6 and 2.0? A real edge sits on a plateau — nudge it and it holds. A fitted ghost sits on a needle — every neighbor collapses. The peak is where the marketing screenshot lives. The plateau is where trust begins.
Fewer knobs isn't automatically better, but unexplained knobs are a warning. A parameter is fine when it has a job — a risk cap, a volatility scale, a spread guard, a position limit. If it exists only because it made the curve prettier, that's not design, it's curve decoration. Every parameter should answer one question: what failure mode are you controlling? If no one can answer, the parameter is probably controlling the past.
VI — You have less data than you think
A thousand trades sounds like a mountain of evidence. As a sample, it's often a hill — and a smaller one than the row count suggests. What matters isn't the number of trades; it's the number of independent market stories underneath them.
A thousand trades inside one macro regime is closer to a single story told a thousand ways. A system that thrived in one gold uptrend isn't proven across gold's other moods. One that loved quiet ranges isn't proven against news shocks; one that fed on London liquidity isn't proven in thin Asian sessions. Markets cluster — volatility, liquidity, behavior, and losses all arrive in runs (so does confidence, which is rude but accurate). Bars are not regimes. Trades are not independent units of truth.
Which leads to the single most important sentence in systematic trading: the worst drawdown in your backtest is not the worst drawdown that can happen — it's only the worst that did, in that one sample. Treat it as a lower bound, never a promise. The next regime can run deeper, arrive sooner, last longer, and land on an uglier broker. A system that barely survived its backtest hasn't survived anything yet. It survived a rehearsal. (We later measured how wide that rehearsal really is — resampling our own 24 published months into 10,000 alternative years — and broke down what separates the rehearsal from the live account, layer by layer.)
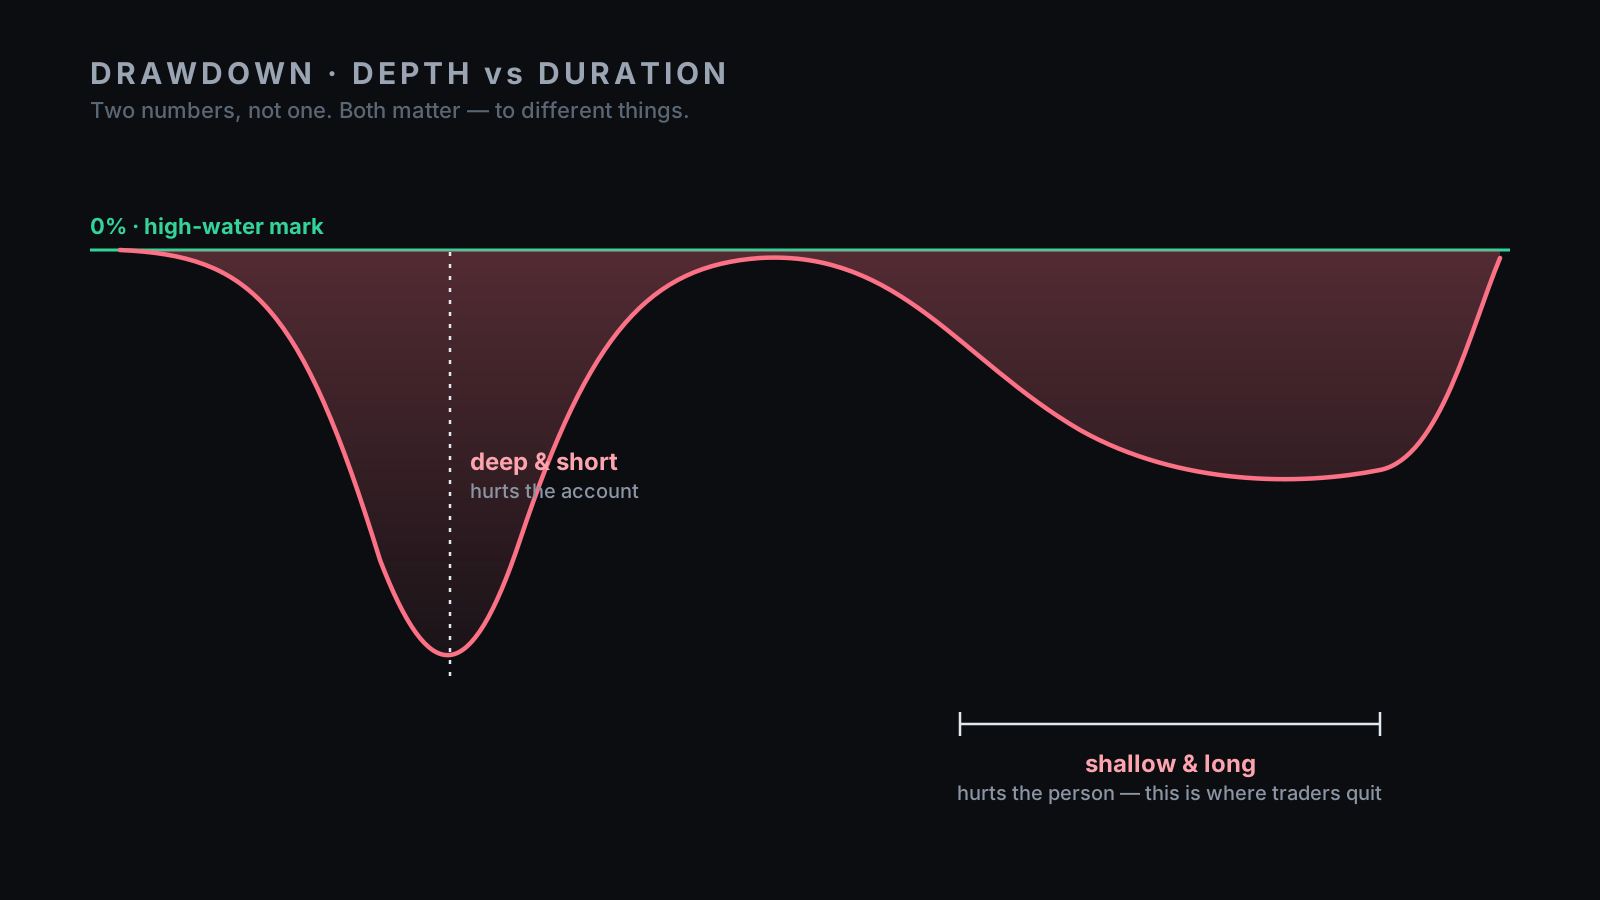
And read drawdown in two dimensions, not one. Everyone asks how deep. Ask how long. A 20% drawdown that heals in three weeks is a different animal from a 12% one that grinds for nine months. Depth damages the account; duration damages the person. Most systems are abandoned not at the mathematical bottom but somewhere in the long, boring middle — where nothing works and the trader starts "improving" the rules. A system has to survive the market. The trader has to survive the system. Both bars are real, and the second one is the one people fail.
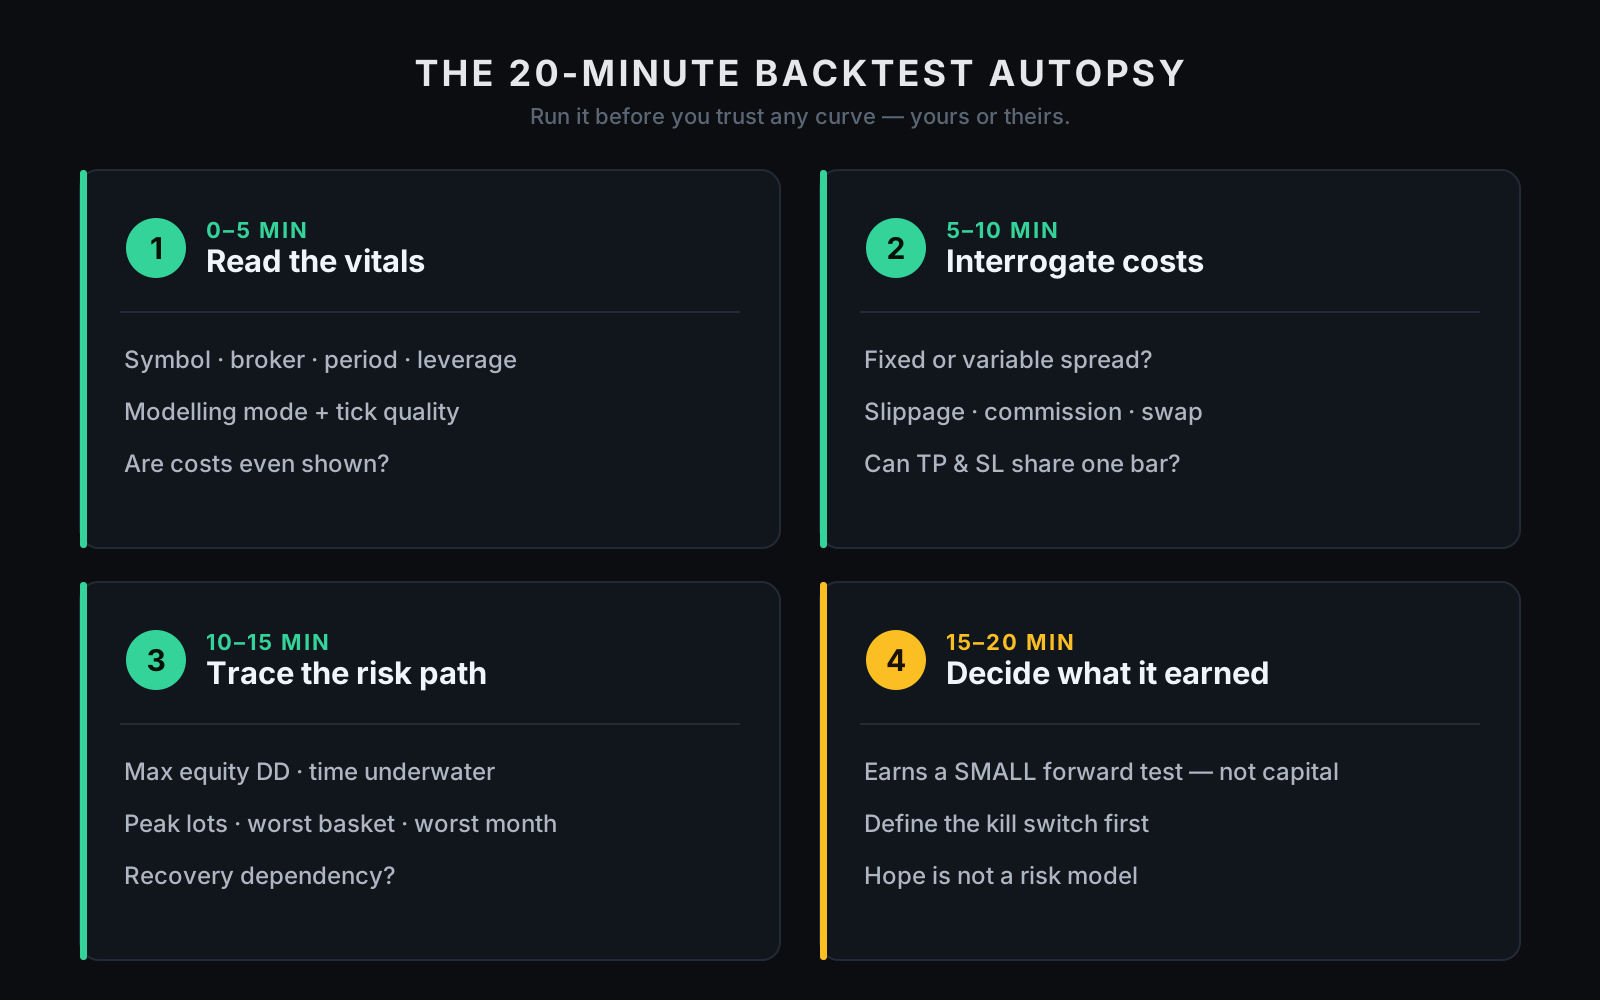
VII — The 20-minute backtest autopsy
You don't need a PhD to dodge most bad systems. You need a ritual. Here's the 20-minute one — run it before buying an EA, before trusting your own strategy, before showing anyone a curve.
Minutes 0–5 · Read the vitals. Symbol, broker, timeframe, test window, modeling mode, deposit, leverage, commission, spread model, swap on/off, real ticks or not, deposit currency, sizing rule. Missing fields don't prove fraud — they prove incomplete, and incomplete is already enough reason to slow down.
Minutes 5–10 · Interrogate costs and execution. Fixed or variable spread? Slippage modeled? Commission and swap included? Does it trade through rollover, or dodge news? Market orders, pendings, or both? Can TP and SL both sit inside one candle — and if so, how is order priority decided? This five-minute block catches more false confidence than any indicator ever will.
Minutes 10–15 · Trace the risk path. Ignore profit. Hunt for pain: max equity drawdown, max balance drawdown, worst floating loss, longest time underwater, max open positions, peak lot exposure, worst basket, worst month, worst regime, recovery dependency, margin level at the worst point. If the report can't answer these, it doesn't understand its own risk.
Minutes 15–20 · Decide what it has earned. A good backtest doesn't earn your capital. It earns a small forward test — and only if you can define the kill switch first. When do you stop? What drawdown invalidates the thesis? What live spread or slippage breaks the model? How many weeks until review? What would prove the backtest was misleading? If you can't write the abort rules before you start, you're not testing. You're hoping. Hope is not a risk model.
VIII — Why we sell source code, not a screenshot
Now MTR, plainly — not as a miracle, as a machine you can open.
A signal asks you to trust the seller. A screenshot asks you to trust the curve. Source code lets you distrust both, productively. You can read the logic, test it on your own broker, change the assumptions, inspect the order rules, stress the spread, rerun the ugly months, hunt for time machines, and decide for yourself whether it has earned even a small forward test. That's the whole pitch — not trust. Verification.
Here's the honest ledger.
What it has going for it. It's full MT5 source — 16,923 lines across 21 files — so nothing load-bearing hides behind a curtain. The published backtest spans 28 months with the bad stretches left in; the drawdowns and flat months sit in the KPI grid, not cropped out of the screenshot. It's tested in a Rust tick simulator with explicit cost assumptions, not a fixed-spread fantasy. And because you hold the source, every claim in this article is something you can check against our own work instead of taking on faith.
What it absolutely is not. It is not a holy grail, not a guarantee, and not a promise that the next 28 months will rhyme with the last. It isn't immune to your broker's spread, to slippage, to swap, or to gold trending too far, too fast, without handing inventory a clean exit. It is not a press-one-button-and-retire machine. Anyone — us included — who implies otherwise has earned your suspicion on the spot.
None of that is a reason to walk away. It's the reason the source, the risk controls, and the ability to rerun hostile windows matter more than any screenshot: you can't stress-test a promise, but you can stress-test code.
Who it's for, and who should skip it. It's for the trader who wants to inspect rather than worship, who asks uncomfortable questions, who would rather own a machine they can audit than rent a signal they have to believe. It is not for anyone hoping to never look under the hood — that person doesn't need MTR, they need a quieter imagination, and the market will charge them for it either way.
Disclosure: nobody's broker is paying us to write this
We don't care whether you run MTR, another EA, a discretionary system, or nothing at all. We care about one thing: stop buying screenshots.
A screenshot is not a strategy. Even a verified Myfxbook link still needs context — the broker, the open risk, the equity path, the lot exposure, and whether the strategy was closing risk or storing it. A win rate is not a risk model. A smooth balance curve is not proof the account was ever safe. Good trading products survive suspicion; bad ones need you excited, rushed, and under-informed. Don't hand them that edge.
So the next time someone shows you a beautiful curve, don't just ask how much it made. Ask what it assumed, what it hid, what it survived, what it failed. Ask what happened to equity, to open risk, to costs when they turned ugly, to the parameters when you moved them, to the system when the market stopped being polite. The good ones get clearer under those questions. The bad ones evaporate. That's the whole point.
A backtest isn't reality. It's a hypothesis with a chart. Treat it like one.
Your first 20 minutes with MTR
If you do get it, don't open by asking "how much can it make." Open like an investigator.
Minutes 0–5 · Read the source. Find the risk controls, the entry and exit rules, the spread checks, the position limits — and the places where the system says no. A strategy is defined as much by what it refuses to do as by what it does.
Minutes 5–10 · Reproduce the baseline. Change nothing. Same broker if you can, same symbol, timeframe, modeling mode, assumptions. Before you improve a system, prove you can reproduce it — otherwise you're debugging fog.
Minutes 10–15 · Stress one assumption. Not optimize — stress. Widen the spread. Add slippage. Shift the date window. Run a known-bad month. Feed it a different broker's data. One variable at a time. You're not trying to make it look good; you're trying to find where it stops being good. That number is worth more than the profit number.
Minutes 15–20 · Decide the next test. If it breaks here, good — you learned before paying tuition. If it holds, also good: it has earned a small forward test, strict abort rules, no hero lot size, no emotional overrides. That's how serious traders use tools — not as magic, as machines.
One last thing
If this saved you from a single beautiful, dangerous curve, it did its job. Send it to the trader who needs it before the next "99% win rate" screenshot finds their wallet.
And if you want the opposite of a screenshot — source you can read, question, stress, and try to break before you trust it — that's the only reason MTR exists.