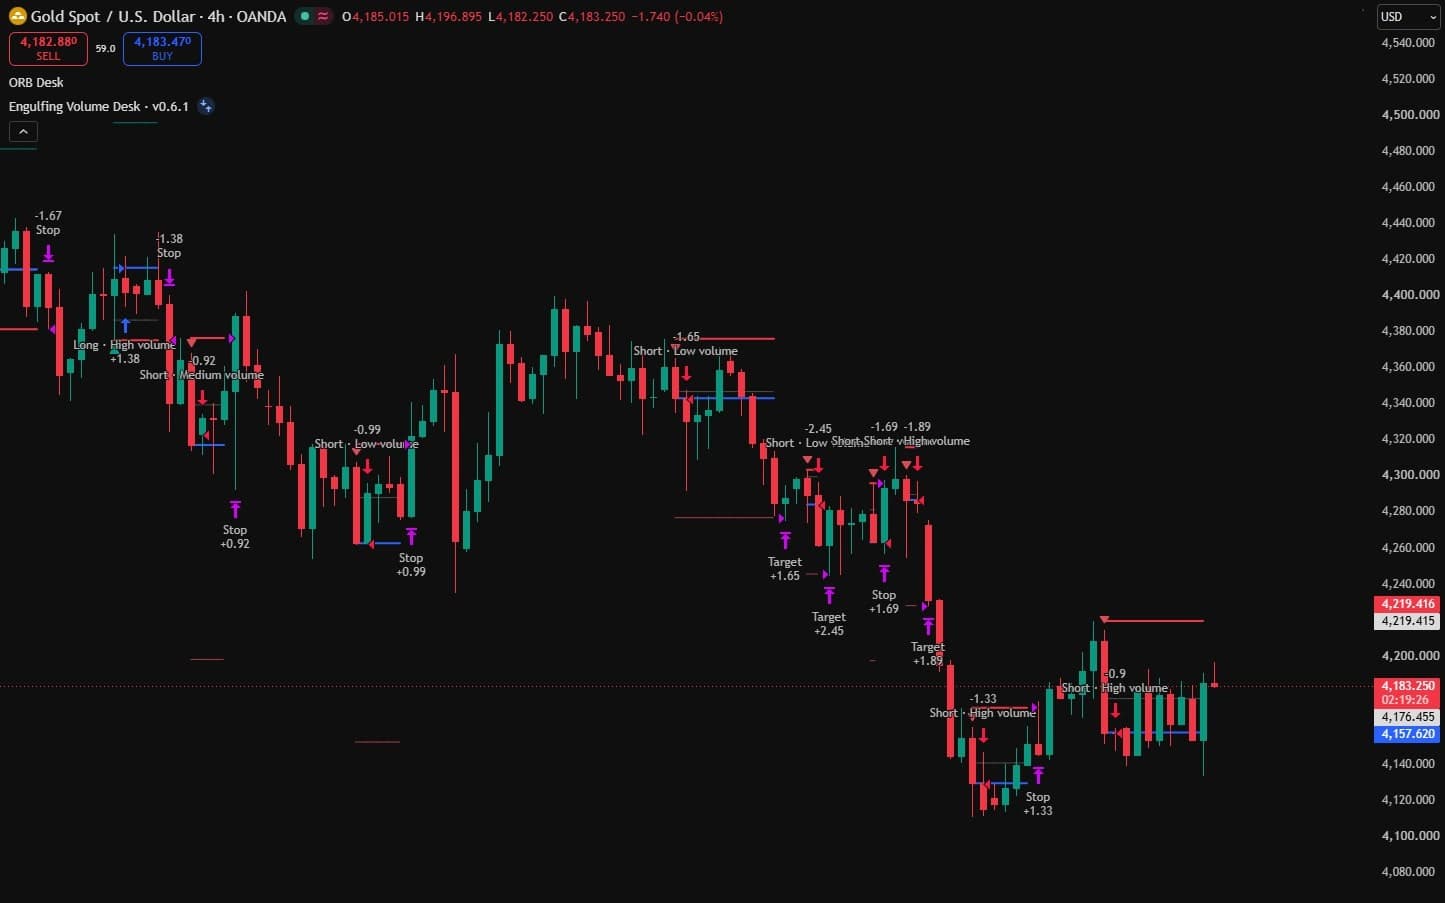
Short version: traded as a 4-hour swing plan on OANDA gold, the plain rule — a confirmed engulfing candle in the direction of the 200 EMA, a breakout entry, a stop beyond both candles, a 2R target — finished 2025–26 ahead by USD 862 on a USD 10,000 account after stressed costs and overnight financing, with a deepest equity fall of 4.2%. We then ran it, once, on 2023–24, a stretch of history we had kept aside for exactly that purpose. There it lost USD 950 under the same costs, and it lost before financing too. Same rule, same settings, two different markets.
This article is where the numbers live. The free page carries none of them.
The rule
On a closed candle: the body is larger than the previous candle's body, covers both ends of it and has the opposite colour (bullish engulfing after a red candle, bearish after a green one). Longs need a close above a rising 200 EMA, shorts a close below a falling one. Relative volume is the candle's volume over the average of the previous twenty: Low below 1.0, Medium from 1.0, High from 1.5. Every grade is accepted; the grade is recorded, not used as a filter.
The plan is fixed at the close of the engulfing candle: entry one tick beyond the previous candle's high (long) or low (short) as a stop order, or at the next bar if the close is already through; stop one tick beyond both candles; target at twice the planned risk; the pending order expires after five candles or if the stop is touched first. Risk is 0.5% of equity per setup, with the position capped at 95% of equity. One setup at a time. These are the release's defaults.
How we measured
- Market: OANDA:XAUUSD on TradingView, 4-hour candles. Every number below is TradingView's own Strategy Tester ledger, read trade by trade from the native report. Account USD 10,000.
- Costs: base — USD 0.30 commission per ounce per fill and 100 ticks (USD 0.10) slippage on market and stop orders; stressed — USD 0.60 and 200 ticks.
- Overnight financing (TradingView does not charge it): for every New York 17:00 rollover a position is held through, position value × the annual rate ÷ 365, Wednesdays counted three times, charged to longs and shorts alike, a full day per rollover. The rate is 6.5% a year at base and 10% stressed, set from OANDA's published method for gold (the tom-next swap rate plus a 1% admin fee) with US policy rates at their 2023–24 peak, and no short credit.
- Two periods: 2025-02-20 to 2026-09-28 (signal closes) is the one we developed on. 2023-03-01 to 2024-12-31 was set aside in an earlier round and opened once, after the rule and every setting were fixed in writing.
2025–26: the period we developed on
| Trades | Before financing | Financing | After financing | Deepest fall | Won | Profit factor | |
|---|---|---|---|---|---|---|---|
| Base costs | 83 | +1,203.69 | −146.12 | +1,057.58 | 4.02% | 45.8% | 1.49 |
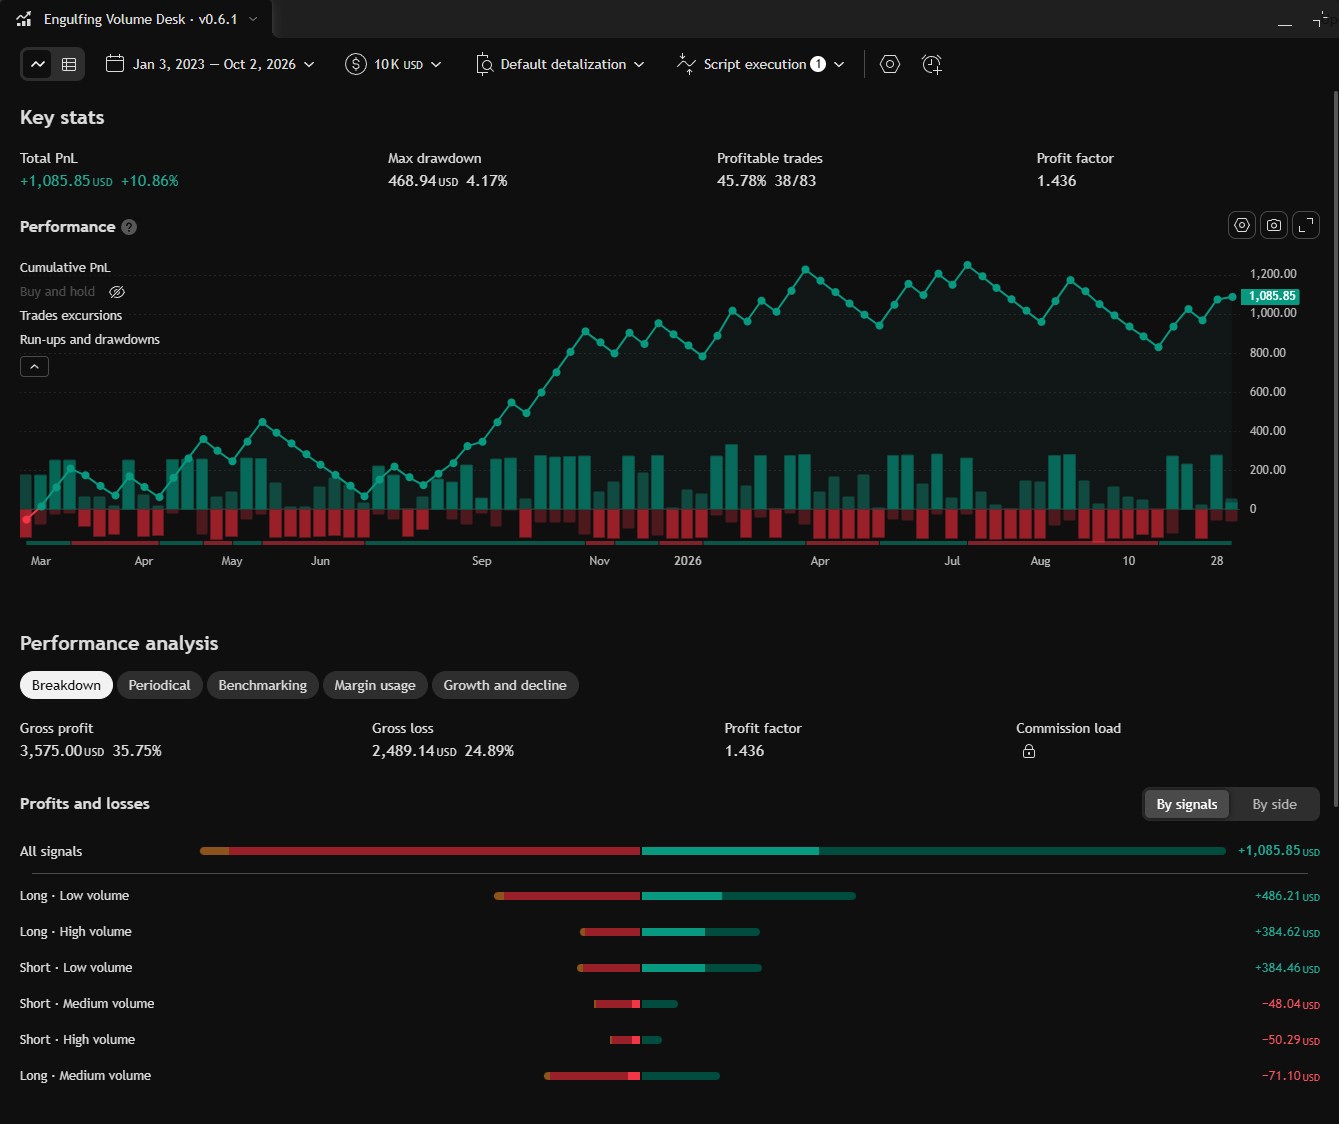
| Stressed costs | 83 | +1,085.85 | −223.61 | +862.24 | 4.17% | 45.8% | 1.44 |
Under stress, after financing: longs 57 trades, +632.96; shorts 26, +229.28. February–December 2025 +758.24 (45 trades); January–September 2026 +104.00 (38). Without its five best trades the period still ends +308.79.
2023–24: the history we had held back
| Trades | Before financing | Financing | After financing | Deepest fall | Won | Profit factor | |
|---|---|---|---|---|---|---|---|
| Base costs | 134 | −147.72 | −283.13 | −430.85 | 6.62% | 35.1% | 0.96 |
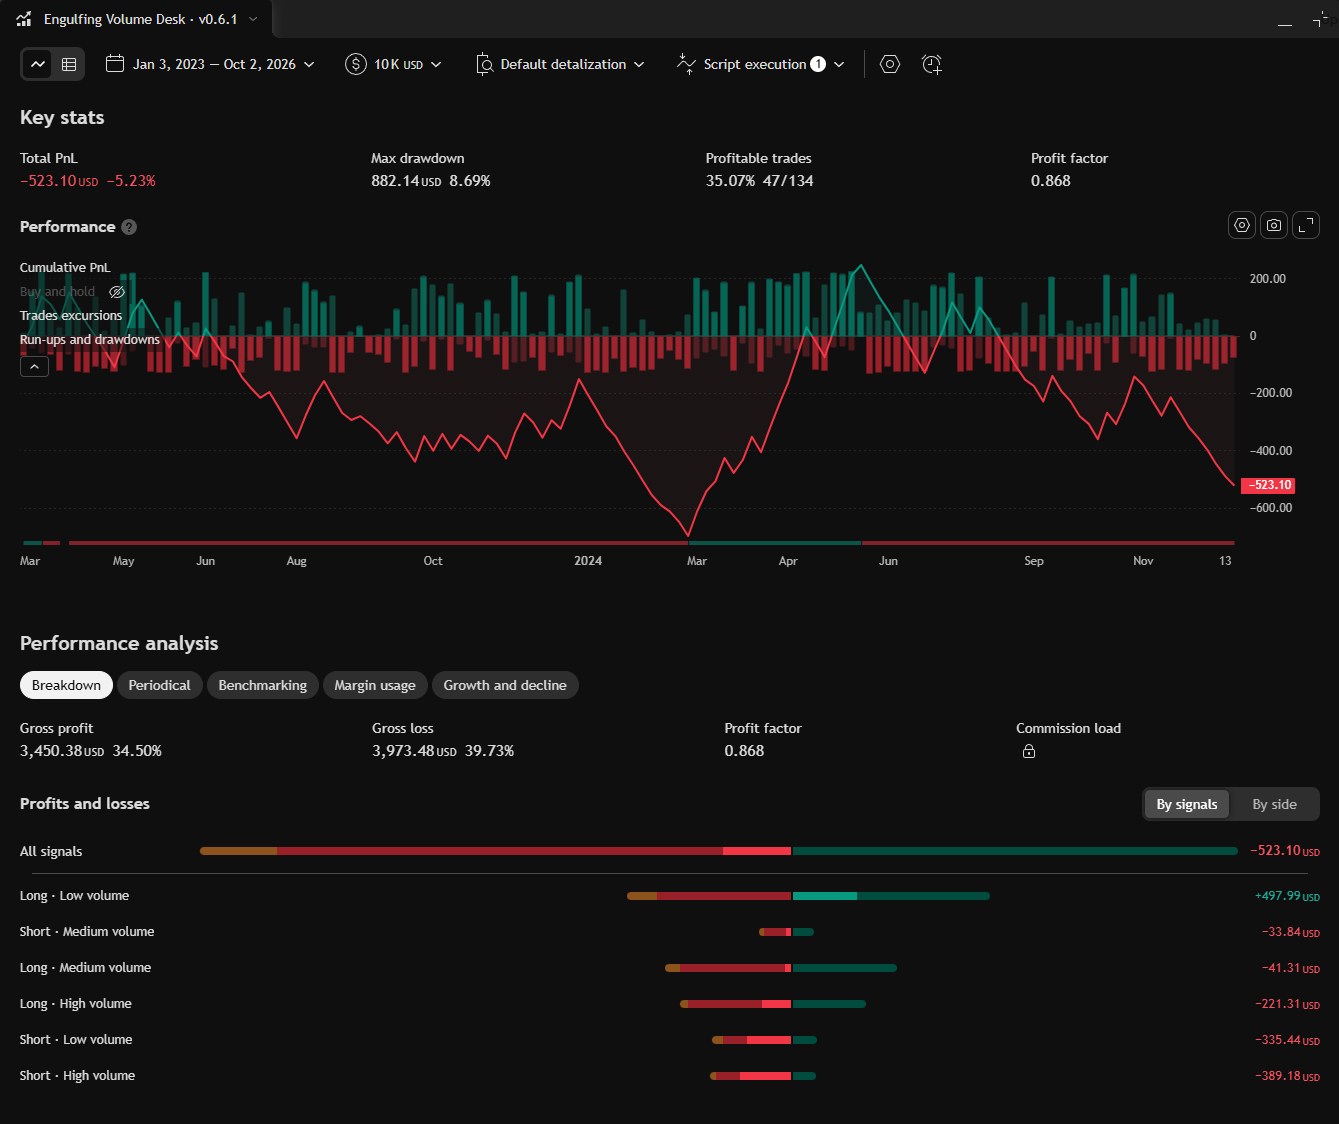
| Stressed costs | 134 | −523.10 | −427.14 | −950.24 | 8.69% | 35.1% | 0.87 |
Under stress, after financing: longs 97 trades, −29.26; shorts 37, −920.98. March–December 2023 −371.72 (62 trades); 2024 −578.52 (72). Without its five best trades: −1,412.25. The loss is not a financing artefact: the rule lost before financing in both cost settings.
What the volume grade did
TradingView splits each period by the label on the entry (stressed costs, before financing). In 2025–26, Low-volume longs (+486.21), High-volume longs (+384.62) and Low-volume shorts (+384.46) carried the gains, while Medium-volume entries and High-volume shorts lost a little. In 2023–24 the High-volume shorts — the setups "volume confirmation" is supposed to favour — were the biggest losing group (−389.18), High-volume longs lost too (−221.31), and the only group that gained was Low-volume longs (+497.99). In this test the grade described the candle; it did not tell good setups from bad ones.
Holding overnight versus flat before the rollover
We also ran the same rule closing every position before the 17:00 New York rollover (and only accepting setups early enough to allow that). On 4-hour candles that leaves few trades: 35 in 2025–26 (+150.43 stressed) and 75 in 2023–24 (−350.12). Holding through the rollover was the better choice in 2025–26 and the worse one in 2023–24.
How we got here
This was the sixth round of tests on this idea, all on gold, and the earlier ones count:
- Rounds 1–4 (15-, 30- and 60-minute charts). After costs the rule was close to break-even or losing on these charts; commission and slippage alone were 9–18% of the typical risk per trade. A retest entry, a trend-efficiency context, an entry router, a rollover cutoff and a cost screen each changed the results, but no version was positive in every period with enough trades.
- Round 5. We screened 26 variants offline with a simulator that reproduces TradingView's fills trade for trade, picked one by a rule written in advance, and it failed on TradingView. The cause was ours: the offline 4-hour candles had been assembled incorrectly from hourly data.
- Round 6. The original rule on the 4-hour chart, as above. One thing changed between rounds 5 and 6, and we chose it after seeing 2025–26: the financing charge. Earlier rounds charged USD 5 per ounce per night — roughly 46–91% a year at these gold prices, and not based on any broker. Under that charge 2025–26 was about flat (+7.15 stressed) and 2023–24 lost USD 4,217.85. We replaced it with the published-method rate above before opening 2023–24. The 2023–24 result does not depend on that choice.
What you can take from it
- On gold's intraday charts, the classic engulfing-with-volume rule didn't clear its costs in our data.
- On the 4-hour chart it did well in 2025–26 and badly in 2023–24. Our reading: the rule follows what gold happened to do, rather than holding an edge that carries across years.
- Relative volume is worth seeing on the chart. As a filter, it didn't help here.
- If you add the desk to a 4-hour gold chart with its defaults, TradingView's report covers everything your plan loads — on ours, January 2023 to now — and shows a positive total before financing, because 2025–26 outweighs 2023–24. Set the window you care about, add your broker's real costs, and account for financing yourself.
Limits
One market, one feed, one timeframe, a default OHLC fill model without intrabar detail, and financing modelled from a published method rather than an account statement. Two periods are two samples of history, not a forecast. Nothing here is advice to trade this rule.
Source: Engulfing Volume Desk v0.6.1 (SHA-256 844c5de3…c4b09c). The measurements ran on v0.5.1 (3919ec52…40379e) with identical trading logic; v0.6.1 changes the title, the default research window and the chart labels, and reproduces both ledgers exactly on TradingView.