A trader messaged us last week.
He buys Nifty options. Calls and puts, nothing fancy.
He rents two signal indicators. Both light up his chart several times a day.
Both hit the stop about as often as the target.
He asked for one thing: fewer calls, stronger calls. One or two a day he could trust.
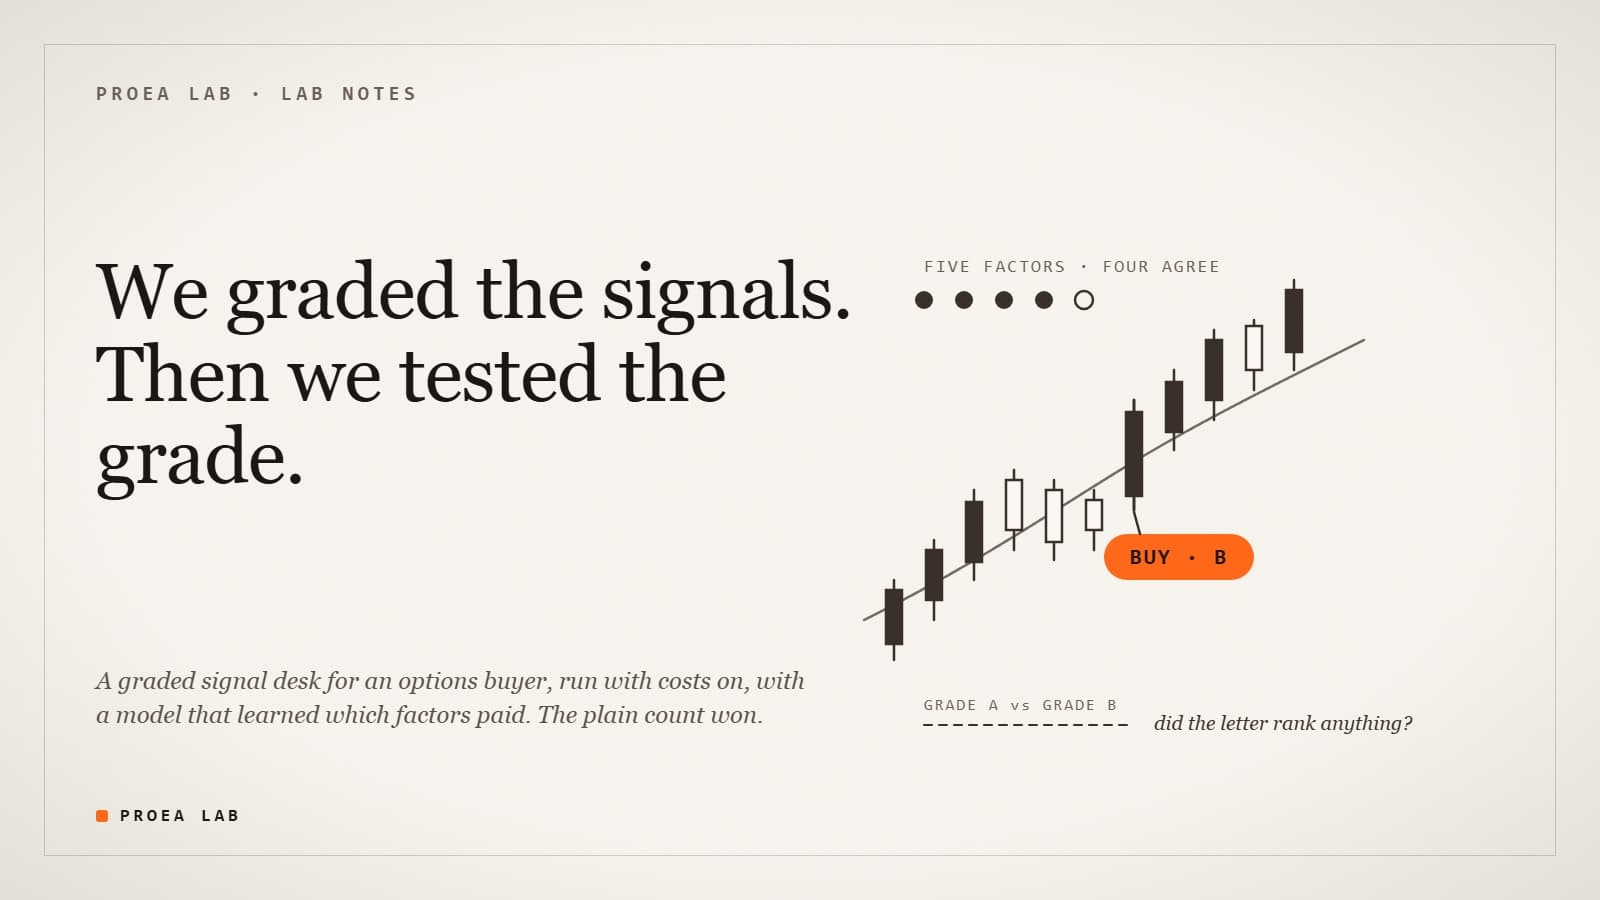
So we built it. Then we did the part nobody who sells signals does. We tested whether the grade on the signal meant anything at all.
It mostly didn't. And the versions we made smarter got worse.
That is the whole article, and we're publishing it anyway, because a grade you never tested is a costume.
Two requests before we start:
- Save this before you pay for the next "premium signals" subscription.
- Send it to the friend who trades the arrows and never asks where the arrows come from.
Skip this if you already distrust arrows
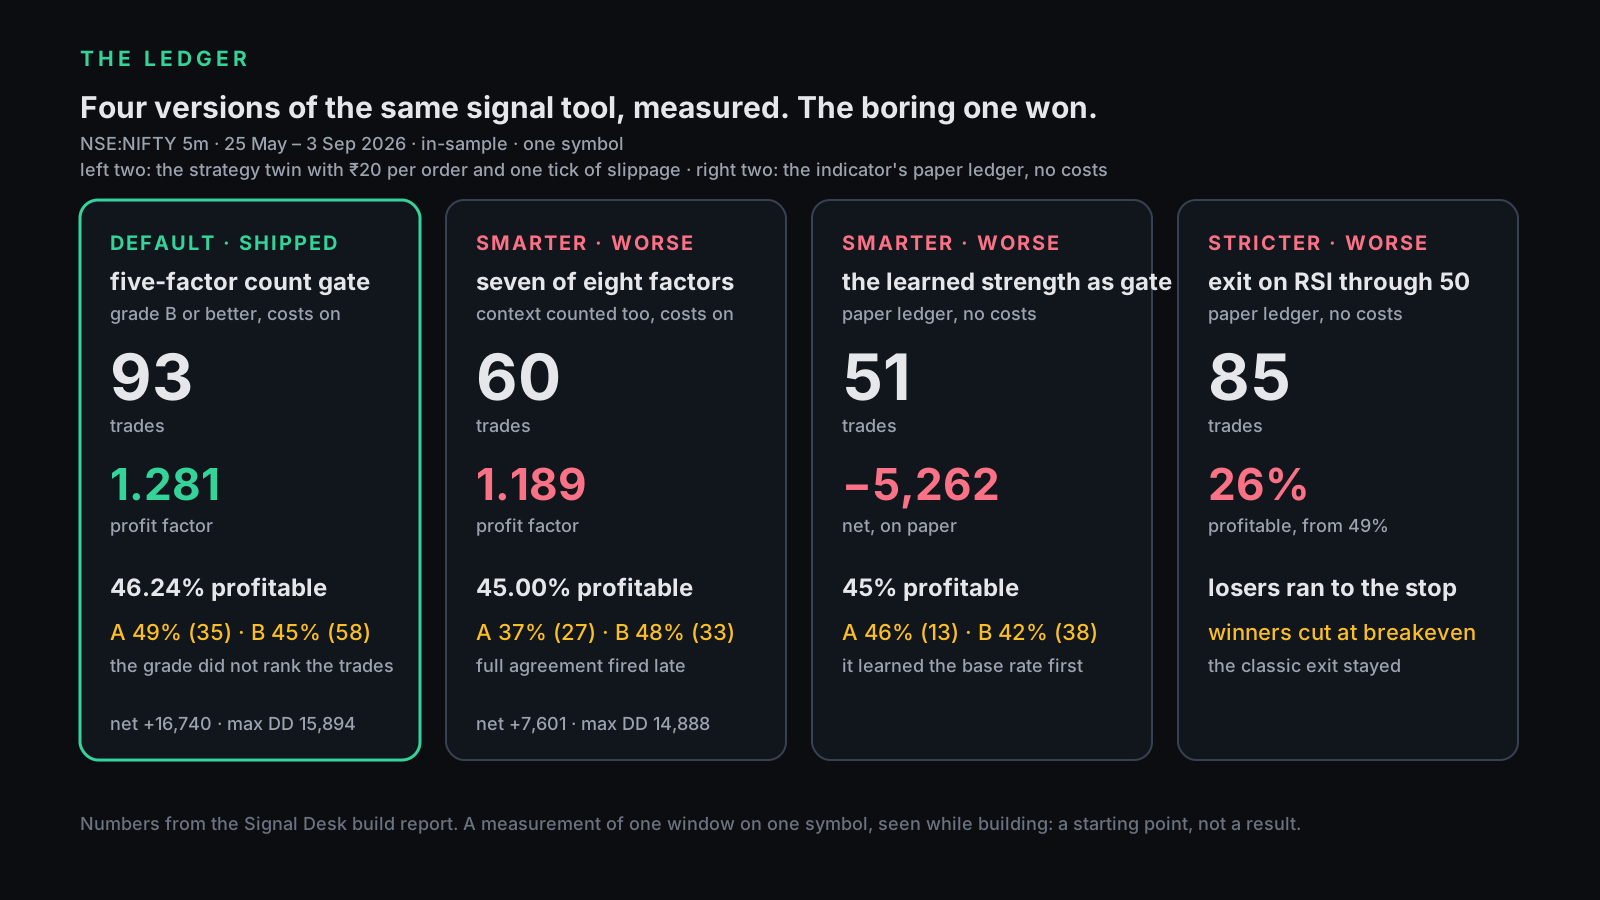
The 60-second version. We built a signal indicator for an options buyer, measured it on NSE:NIFTY 5-minute over about three months with ₹20 per order and slippage on, and got 93 trades, 46% profitable, profit factor 1.28. Fine as a draft, in-sample, one symbol, not an edge.
Then we checked whether grade-A signals beat grade-B signals. They didn't (49% versus 45%). Requiring more factors cut the trades to 60 and dropped the profit factor to 1.19. Letting a learning model gate the signals cut them to 51 and turned the paper net negative.
The plain five-factor count won. We shipped it as the default and left the clever parts on as switches, with their numbers printed next to them.
| What the signal seller implies | What we measured |
|---|---|
| "Strong" and "weak" signals are different animals | Our A and B grades won at nearly the same rate |
| More confirmation = better trades | More factors = fewer trades, worse average |
| A model that learns your chart beats a fixed rule | Ours learned the base rate and shut itself off |
| The number on the sales page is the number you'll get | The only number you can trust is one you measured with costs on |
I. What he was actually paying for
Both rented tools fire on the same thing: a momentum flip wrapped in decoration. Strip the overlays off and the entry is an oscillator crossing its own average, gated by slow filters. On a five-minute option chart that fires on every impulse, including the impulse candle itself.
He described the failure exactly. "A big bullish candle closes, I take the trade, the market starts to fall from the next candle and hits the stop." That is not bad luck. That is buying the top of the move that triggered the buy.
Neither tool ships a way to measure itself. You get arrows and a P&L box that starts at zero every morning. A signal tool without a measuring stick is asking you to grade its homework by feel.
Skip §II if you build indicators for a living. It's the design, not the finding.
II. What we built instead
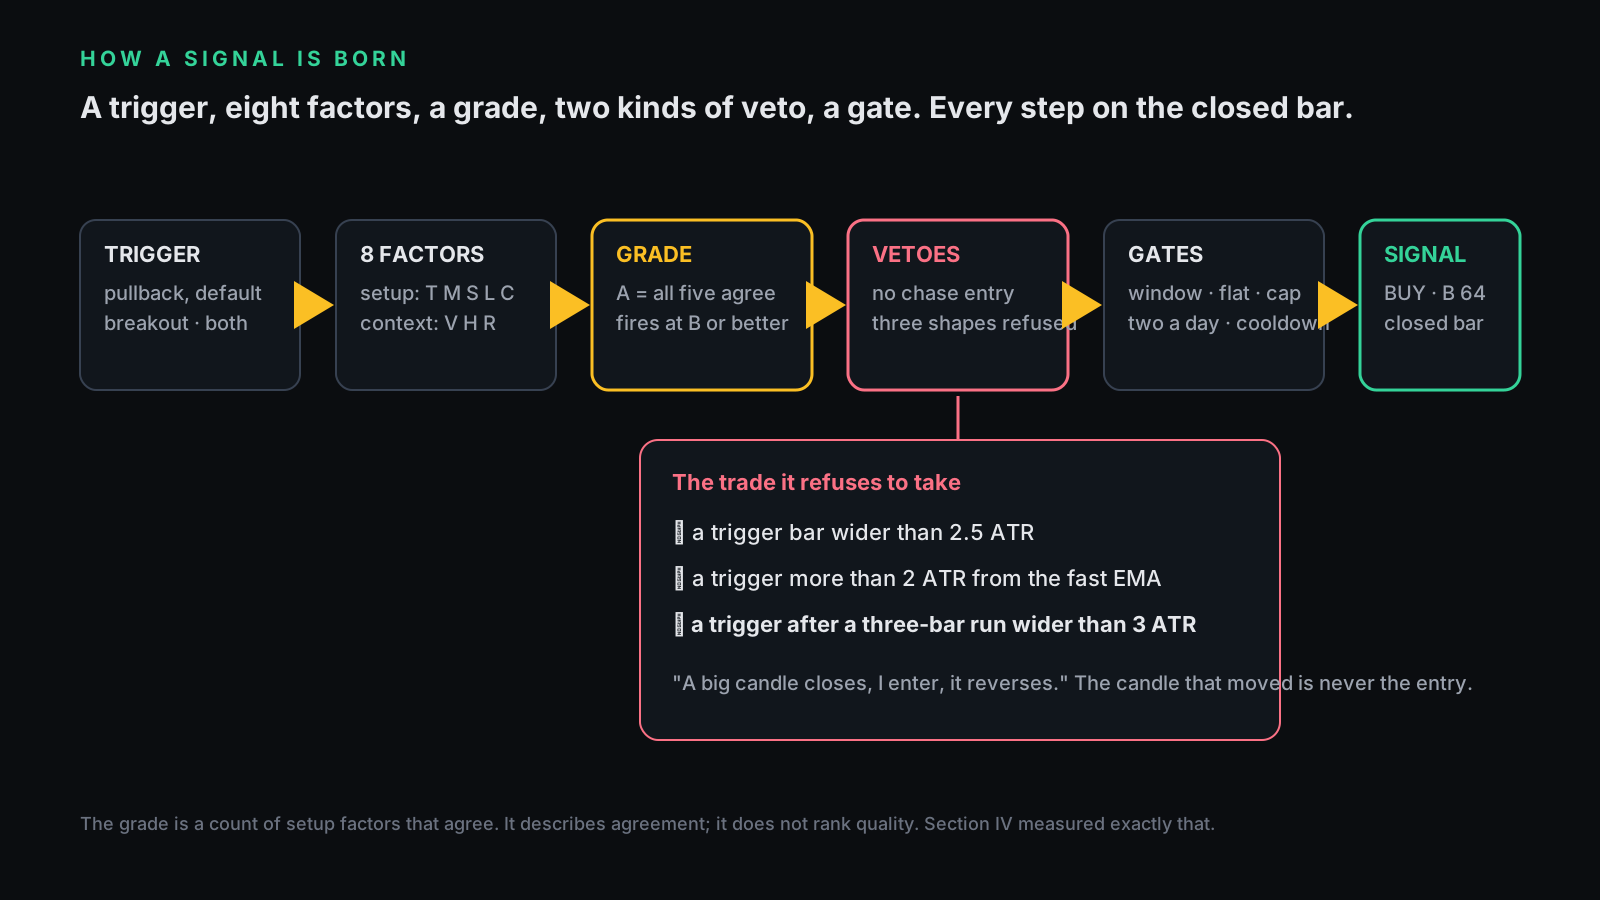
Every signal is born the same way: a trigger, then eight factors, then a grade, then two kinds of veto, then a gate.
The trigger is a pullback by default. Trend up, price comes back to the fast EMA, a strong close back above it while momentum turns. The breakout version exists, but the pullback is the calm one, and calm was the brief.
Five setup factors score the bar: trend, momentum, structure, location, candle. Three context factors ride along: which side of VWAP, the 15-minute bias from its last closed bar, and whether there is room before the day's high. The grade is a count. Five of five is an A.
The veto is the part built straight from his complaint. A trigger on a bar wider than 2.5 ATR is skipped. So is one that fires more than 2 ATR from the fast EMA, or after a three-bar run wider than 3 ATR. That is the "big candle closes, I enter, it reverses" trade, refused by rule.
Then the gate: inside the entry window, grade B or better, flat, under a cap of two entries a day, and past a cooldown. Everything commits on the closed bar. Nothing repaints.
You can run this yourself. Signal Desk is free and open-source, no signup, and the strategy twin we measured with is in the same download. Get it on the free page →
III. The measuring stick
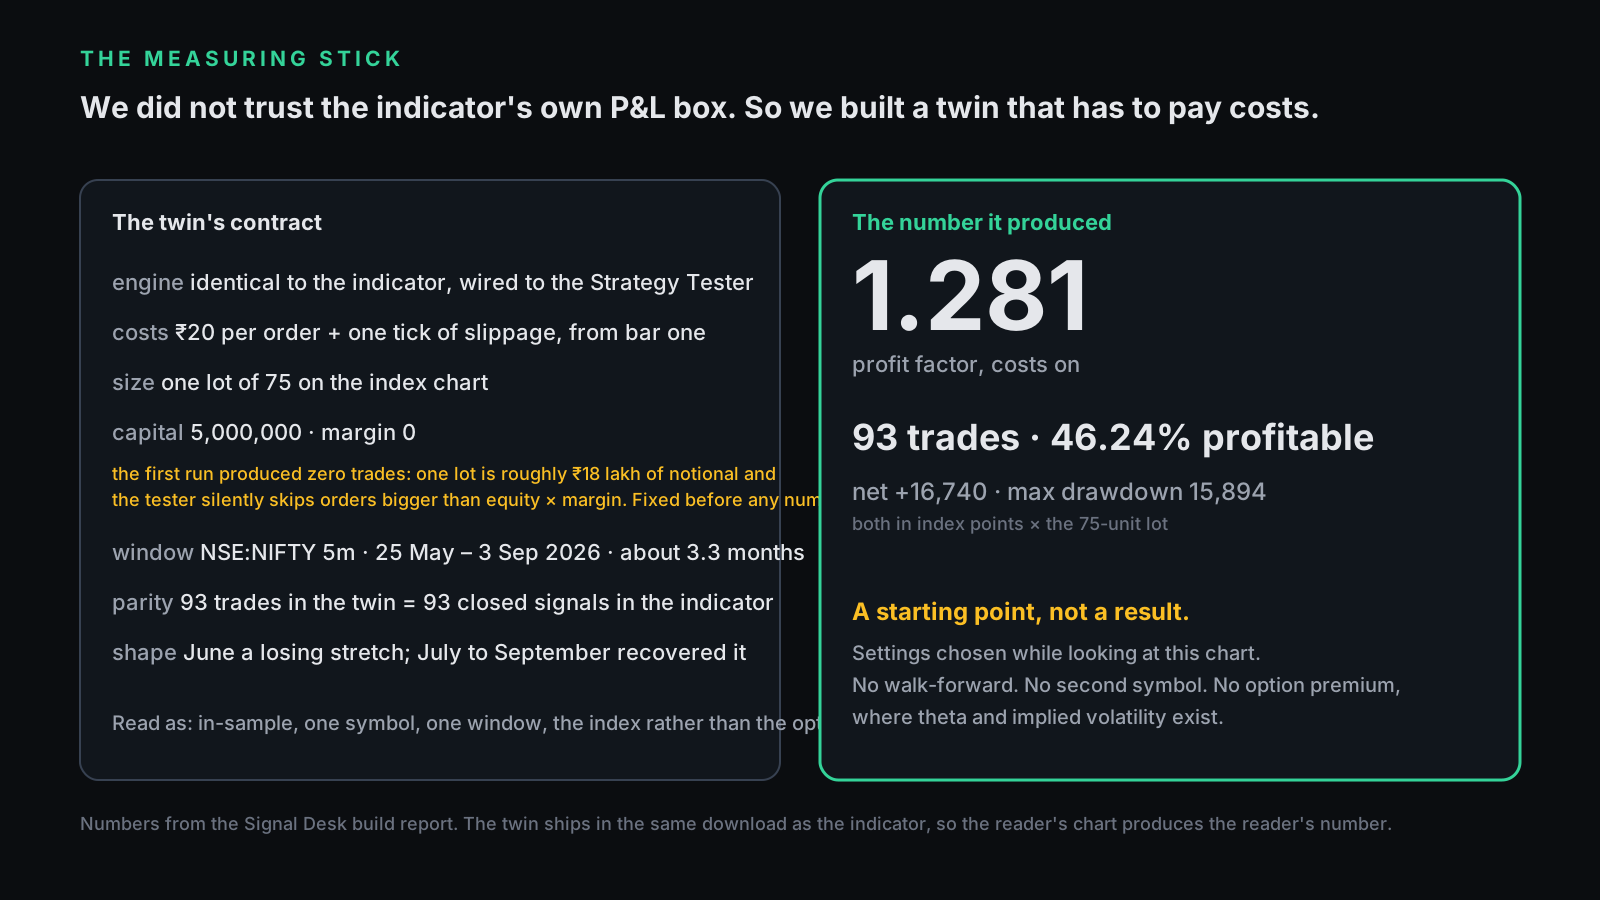
Answer first: we didn't trust the indicator's own P&L box, so we built a second file, the strategy twin, that runs the identical engine through TradingView's Strategy Tester with ₹20 per order and one tick of slippage from bar one.
The twin's first run produced zero trades. One lot of Nifty on the index chart is roughly ₹18 lakh of notional, and the tester silently skips orders bigger than equity times margin. We raised the test capital and zeroed the margin rule before a single number existed. That bug is in the changelog because a measuring stick that fails silently is worse than none.
The run we're reporting: NSE:NIFTY, 5-minute bars, 25 May to 3 September 2026, one lot, defaults.
93 trades. 46.24% profitable. Profit factor 1.281. Net plus 16,740 and a max drawdown of 15,894, both in index points times the 75-unit lot. June was a losing month; July through September recovered it.
Read that as what it is. In-sample, because we chose the settings while looking at this chart. One symbol, one window, and the index rather than the option premium he actually trades, where theta and implied volatility exist. A profit factor of 1.28 on one window is a starting point, not a result.
IV. The grade didn't rank anything
Answer first: on those 93 trades, grade-A signals won 49% of the time and grade-B signals won 45%. Four points on 35 versus 58 trades is noise.
We had expected the opposite. A is "every setup factor agrees." B is "one is missing." If the factors carry information, A should be clearly better. It wasn't.
So we tried the obvious fix. Count all eight factors and demand seven of them. That produced 60 trades instead of 93, a profit factor of 1.19 instead of 1.28, and the A grade got worse than B: 37% versus 48%.
There is a reason, and it's an old one. When every factor lines up at once, the move is usually already spent. Full agreement is a late signal wearing a confident face.
V. We made it smarter. Three times. It got worse.
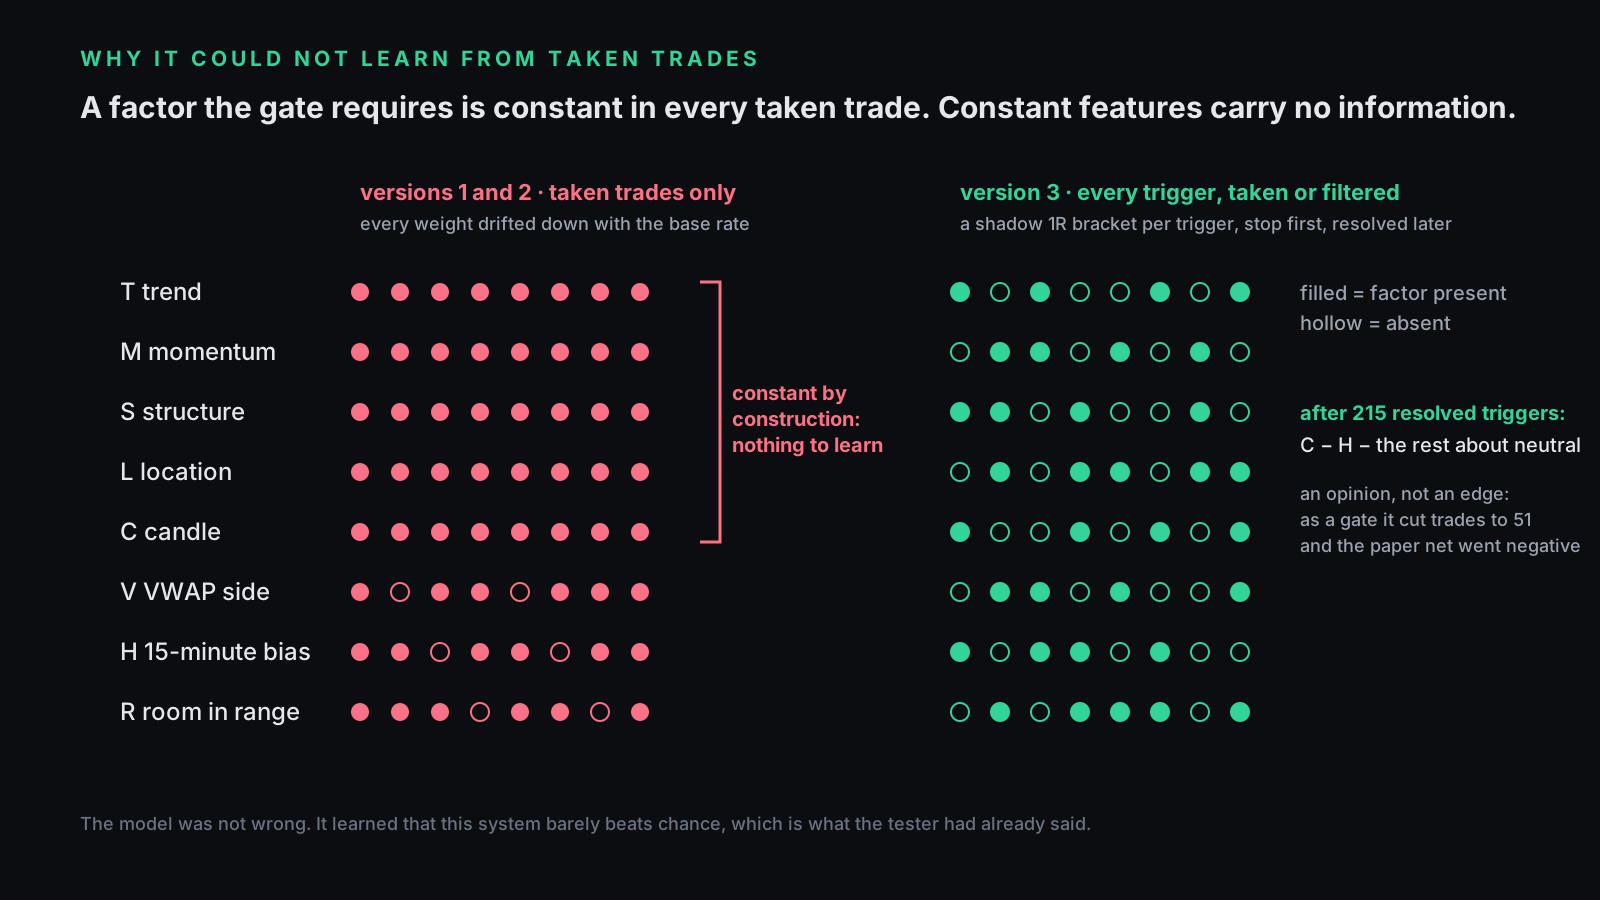
Answer first: we added an online logistic regression that learns the eight factor weights from outcomes on the chart. Used as the gate, it cut trades to 51 and turned the paper net negative. Three versions failed for the same reason before one learned anything real.
Version one learned from the taken trades only. Every weight drifted down together. The reason is selection bias: every taken trade already has trend, momentum and a clean candle by construction, so those features are constant in the training set. Constant features can't be told apart from the base rate, and the base rate of a 46% system is below half.
Version two centred the features on 0.5. Same drift, same reason.
Version three follows every trigger, taken or filtered, as a shadow 1R bracket, stop first, resolved only on later bars, and centres each feature on its running mean. That finally separates the factors that vary from the ones the trigger requires. After 215 resolved triggers it had an opinion: candle quality and the 15-minute bias hurt slightly on this chart, everything else about neutral.
An opinion is not an edge. When we let that model gate the signals, the result was 51 trades and a paper net of minus 5,262, with no costs charged yet.
We also tried a stricter momentum exit, closing when RSI crosses back through 50 instead of its own average. The profitable share went from 49% to 26%, because losers now ran to the full stop while winners got stopped at breakeven. The classic exit stayed.
Skip §VI if you never plan to touch the settings. It's the product decision.
VI. What we shipped, and why the default is the boring rule
Answer first: the free Signal Desk grades by the five-factor count, because that is what measured best. The context factors, the learned strength, and the strategy twin all ship in the box, switched on as information and available as gates, with the numbers above printed in the tooltips.
Every entry label reads BUY · B 64: the grade from the count, then the model's strength. The dashboard shows setup factors, context factors, a Learned row that prints which factors have paid on that chart, and a By-grade row that tallies A against B as trades close. If A never beats B on your instrument, the tool tells you so instead of hoping you won't check.
Every trade paints its risk and reward on the chart as two gradients that fade away from the entry. The red one shrinks as the stop moves to breakeven and trails. A week of signals reads at a glance, wins and losses alike.
The honest ledger:
- Good: the chase veto does what he asked. The trigger candle itself is never the entry. Costs are on in the twin from bar one.
- Unproven: the grade. On this chart the letter did not rank quality. Treat A as "everything agrees," not "stronger."
- Dangerous if misread: the learned strength. It learns this chart's base rate first and its factors second. Read the Learned row as a hint, never as a promise.
Want the full engine? The learning idea here is a slimmed version of the one in our SMC AI-Scored Toolkit, which learns separate weights per market regime. And if you'd rather build your own with the same discipline, the build loop we used is Pine Builder and the measuring loop is Quant Studio. Free first is the right path; both paid tools assume you've run the free one.
The 20-minute audit for any signal you rent
Minutes 0–5. Find the entry rule in words. If the seller can't state it in one sentence, the arrows are the product and the rule is the secret.
Minutes 5–10. Ask for the measuring stick. Is there a strategy version with commission and slippage set, or only a P&L box that resets daily? No twin, no number.
Minutes 10–15. Tally the grades. Take twenty "strong" signals and twenty "weak" ones from the tool's own history. Count how many reached one R before the stop. If the two piles look alike, the grade is decoration.
Minutes 15–20. Check the entry bar. Sort the last thirty entries by the size of their trigger candle. If the biggest candles are the worst trades, you're being sold the top of the move that triggered the move.
Disclosure
We build and sell indicators. This one is free because a signal tool that publishes its own failures is the pitch for every tool we charge for. Nothing above is advice, and the numbers are one window on one symbol, measured by us, not validated out of sample.
The one question to ask any signal seller: what did the grade do on the trades you didn't show me?
A signal you can't audit is a rumor with an arrow on it.