A commenter on our thread listed three scripts.
An EMA 200 with its smoothing line. The Stochastic Pop with an EMA on the line. An analysis table.
Could they be one script, and could it say what is still missing before a signal fires?
So we built it. A four-step checklist on the chart, a Co-Pilot that explains it in words, and a strategy twin to measure it.
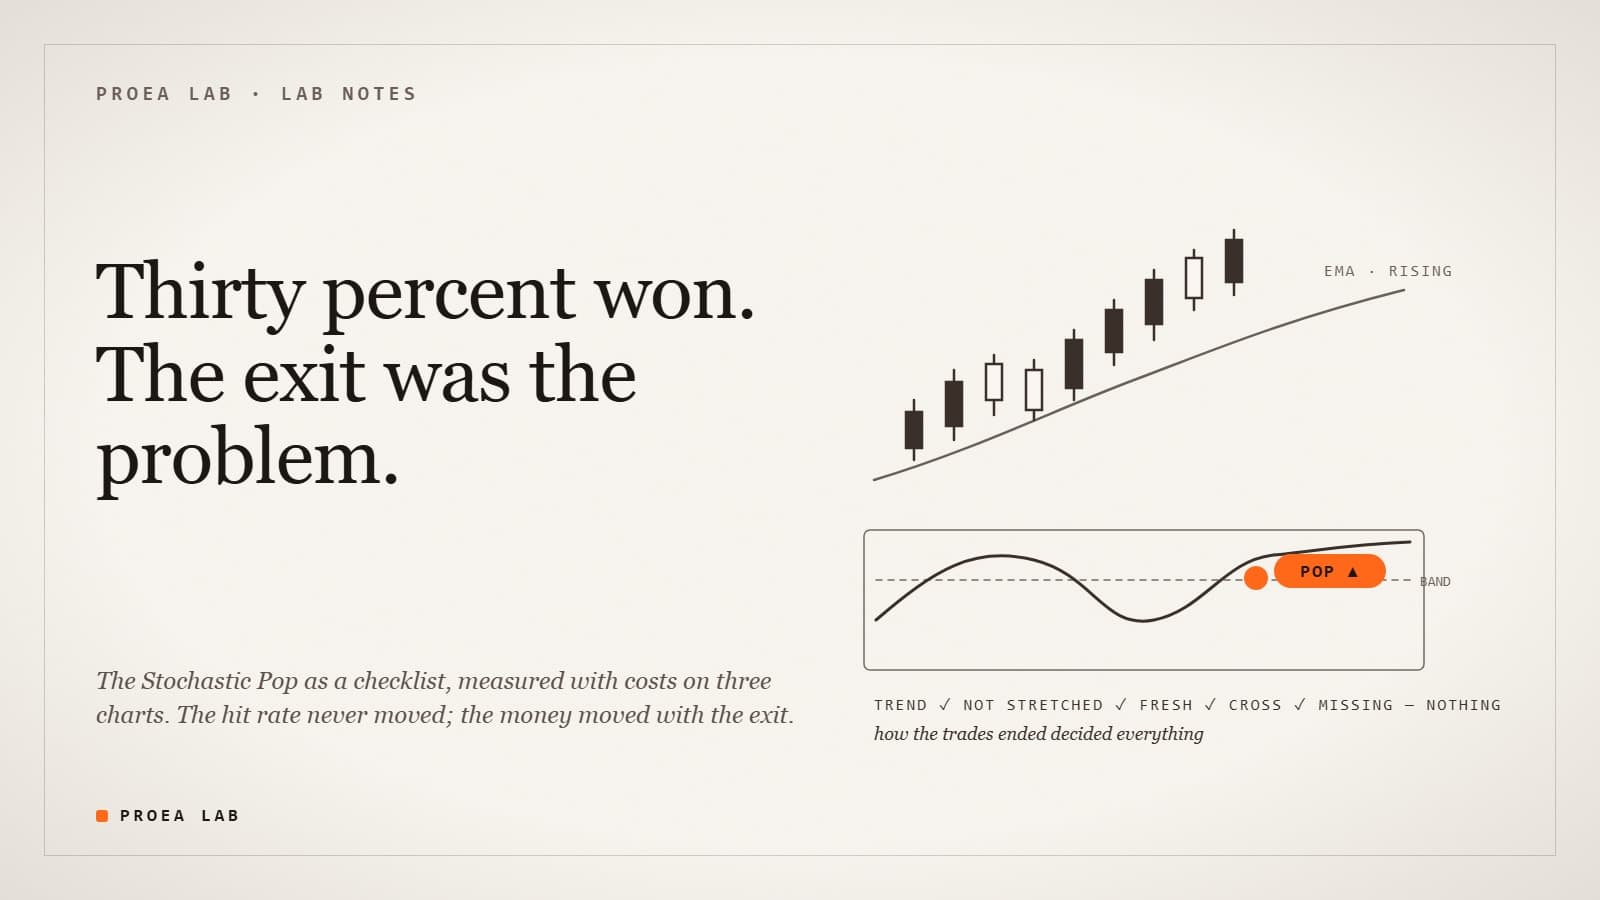
Then we looked at the dashboard and saw a hit rate of thirty percent.
The obvious question is whether that is a problem. It is the wrong question, and answering the right one changed the default exit of the tool.
The hit rate barely moved in any configuration we tried. The money moved a lot, and it moved with the exit.
That is the article. Three charts, every switch, the seven-word answer to "is thirty percent bad", and the chart where nothing paid.
Two requests before we start:
- Save this before you judge your next system by its win rate.
- Send it to the friend whose momentum indicator exits on the same signal that got them in.
Skip this if you already judge systems by expectancy
The 60-second version. We built the Stochastic Pop rule as a checklist and ran its strategy twin with a 0.02% commission per order and five ticks of slippage on bitcoin 1H, gold 1H and gold 15m, in-sample, one run per cell.
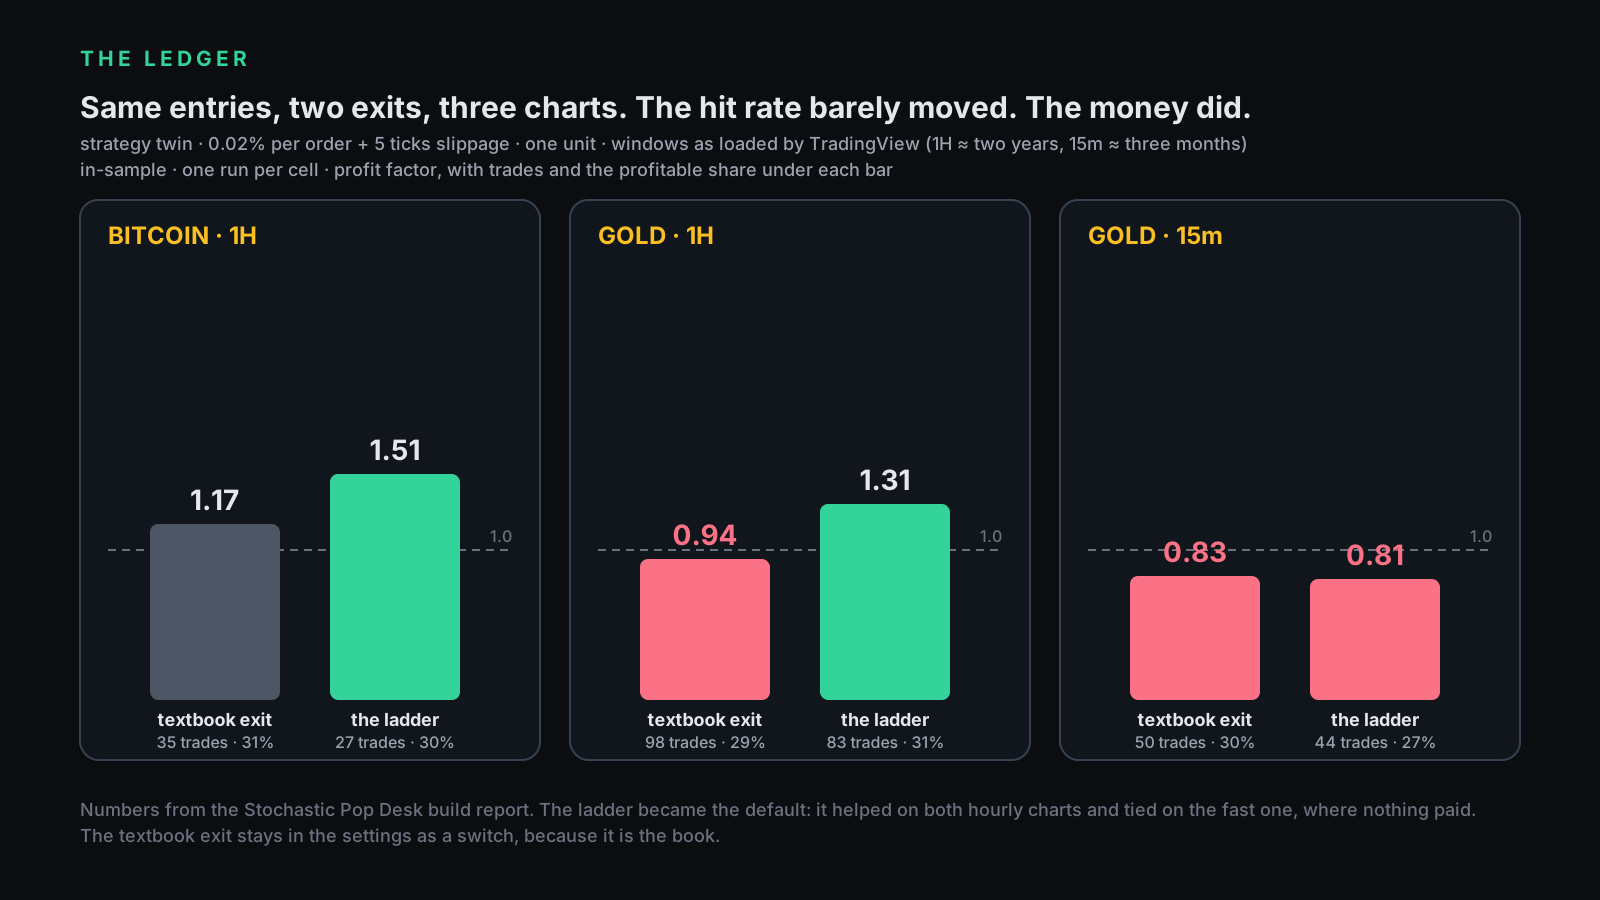
The profitable share sat between 27% and 35% in every cell. With the textbook exit, closing when the stochastic crosses back through its band, bitcoin 1H paid a profit factor of 1.17 and both gold charts lost. With a plain ladder instead, a stop, a first target that moves the stop to breakeven, and a final target, bitcoin went to 1.51, gold 1H to 1.31, and gold 15m stayed around break-even at 0.81.
The ladder became the default. The band exit ships as a switch. Every other switch was measured the same way and ships off, with its number in the tooltip.
| What the win rate implies | What we measured |
|---|---|
| Thirty percent means the entry is broken | The entry was the same in every cell; the exit decided the money |
| Exit when momentum fades, like the book says | The book's exit cut two thirds of the trades early and small |
| More confirmation fixes a low hit rate | A stricter gate looked spectacular on two charts and lost on the third, with 23 trades |
| A trailing stop protects profits | It helped on bitcoin and hurt on gold; the two markets trend differently after a pop |
| Faster charts, more signals, more money | The fast chart was around break-even under every setting we tried |
I. What the comment asked for
Our own post on r/pinescript offered to build what people were missing. One reply listed three indicators: the built-in EMA 200 with its five-period smoothing line, the ChrisMoody version of Jake Bernstein's Stochastic Pop with bands at 55 and 45 "plus an EMA 4" on the line, and an analysis script that had been auto-translated into a table.
The ask underneath the list was better than the list. Which settings were missing, and what would make the three work together?
We answered with one script. The stochastic lives in its own pane and the rest draws on the price chart, so the reader gets one settings dialog instead of three. And the analysis table became a checklist that says, in words, which step of the rule is still false.
Skip §II if you have read the free page. It is the design, not the finding.
II. The rule as a checklist
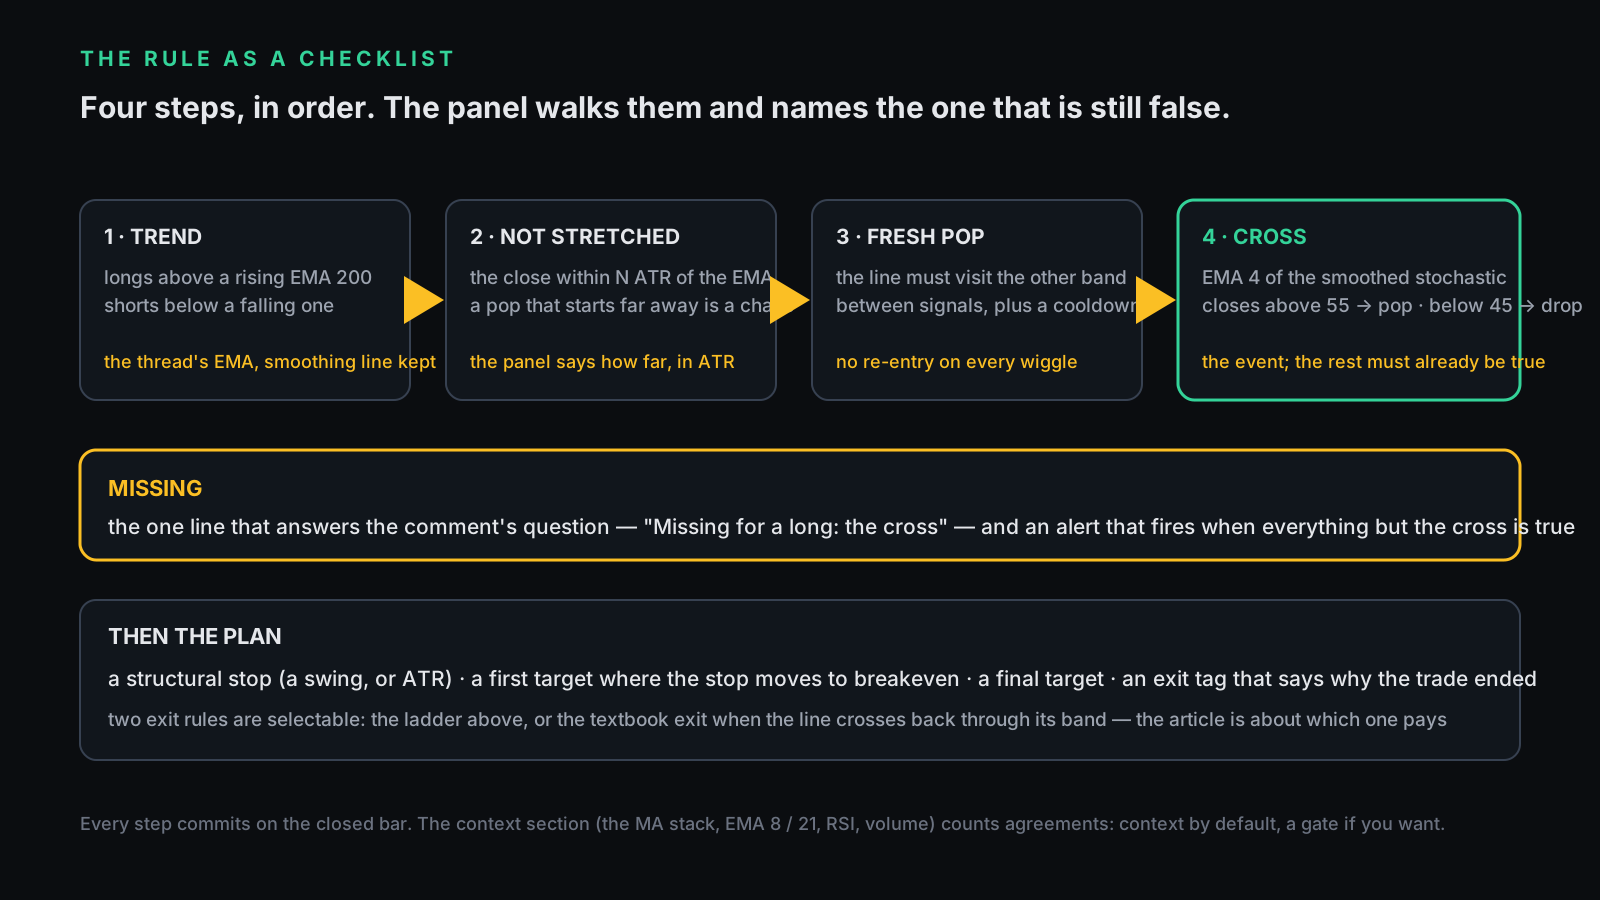
The Stochastic Pop is a momentum rule. Price sits on the right side of a long average, the stochastic pops through a band, you go with it. Made mechanical it has four steps, and every one commits on the closed bar.
Trend: longs only above a rising EMA 200, shorts only below a falling one. Not stretched: the close must sit within a set number of ATR from the EMA, because a pop that starts far away is a chase. Fresh pop: the line must have visited the other band since the last signal, with a cooldown. Cross: the EMA-smoothed stochastic closes through its upper band for a pop, its lower band for a drop.
Then the plan: a structural stop at a swing or in ATR, a first target where the stop moves to breakeven, a final target, and an exit tag that says why the trade ended.
Run it yourself. Stochastic Pop Desk is free and open-source, no signup, MIT, and the strategy twin we measured with is the second file in the same download. Get it on the free page →
III. Is thirty percent a problem?
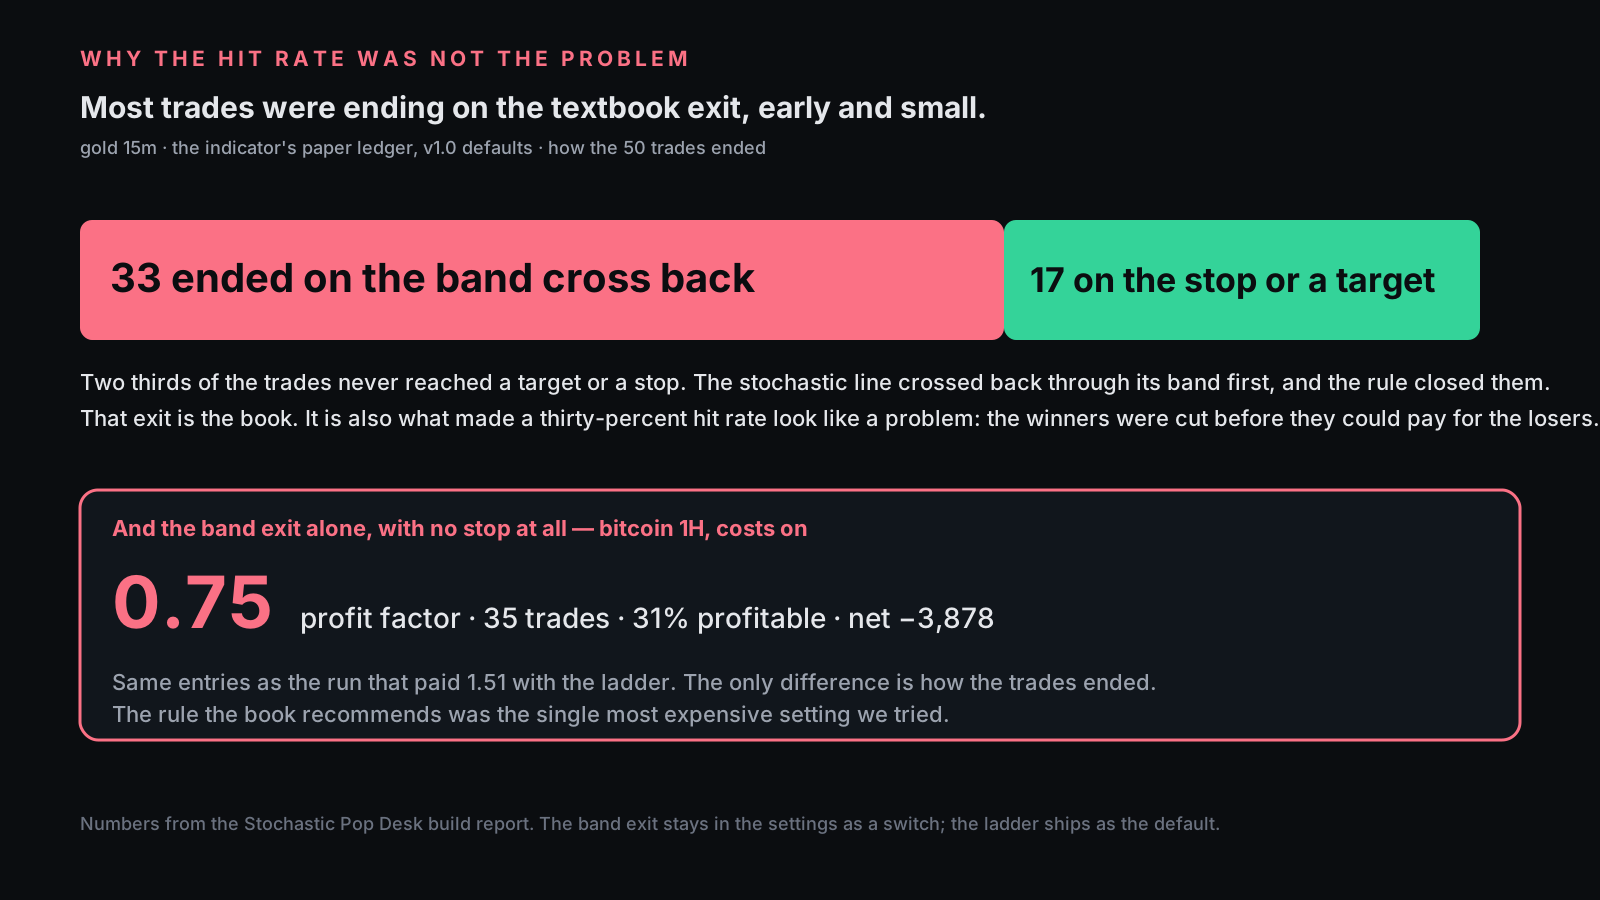
Answer first: no. A momentum-pop rule normally wins under 40% of the time and pays with the size of its winners. The number that mattered was not the hit rate but the exit breakdown, and on gold 15m it said that 33 of 50 paper trades had ended on the band cross back.
That exit is the textbook rule. The stochastic crosses back through its band, momentum is gone, the trade closes. It sounds disciplined. On a five-minute or fifteen-minute chart it also closes most trades before they reach a target, because the line crosses back on the first pause.
Two thirds of the trades were being cut early and small. The hit rate was never the problem; the exit was.We checked the extreme case too. With the band exit alone and no stop at all, bitcoin 1H produced a profit factor of 0.75 and a net of minus 3,878 on 35 trades, from the same entries that paid 1.51 with a ladder.
IV. Which exit pays
Answer first: dropping the band exit was the one change that helped on every chart where anything helped. Bitcoin 1H went from 1.17 to 1.51, gold 1H from 0.94 to 1.31, and gold 15m tied at 0.83 against 0.81, around break-even either way.
The trade counts moved less than you would expect: 35 to 27 on bitcoin, 98 to 83 on gold 1H, 50 to 44 on gold 15m. The profitable share stayed in the same band throughout, 27% to 35%. What changed was how far the winners were allowed to run before something closed them.
The ladder is not clever. A stop where the setup is wrong, the stop to breakeven at one R, out at two R. It ships as the default because it measured best on two of the three charts and tied on the third. The band exit stays as a switch, and a third option runs both, because some readers will want the book.
Skip §V if you never plan to touch the settings. It is the part where most of the good ideas lost.
V. Every switch, one at a time
Answer first: of seven switches, one improved the profit factor on every chart it was tried on. Three helped on bitcoin and hurt on gold. One hurt everywhere. All seven ship off, with these numbers in their tooltips.
The gates first. Requiring a majority of the context agreements, the MA stack, the EMA 8 and 21, RSI, volume, took bitcoin 1H to 1.69 on 23 trades and left gold 1H at 1.12. Requiring all of them looked spectacular, 3.28 on bitcoin and 2.08 on gold 15m, and lost on gold 1H at 0.88 with 23 trades. Fourteen, seventeen and twenty-three trades are sample-size stories, not rules, so the default gate stays the classic one: trend and pop only.
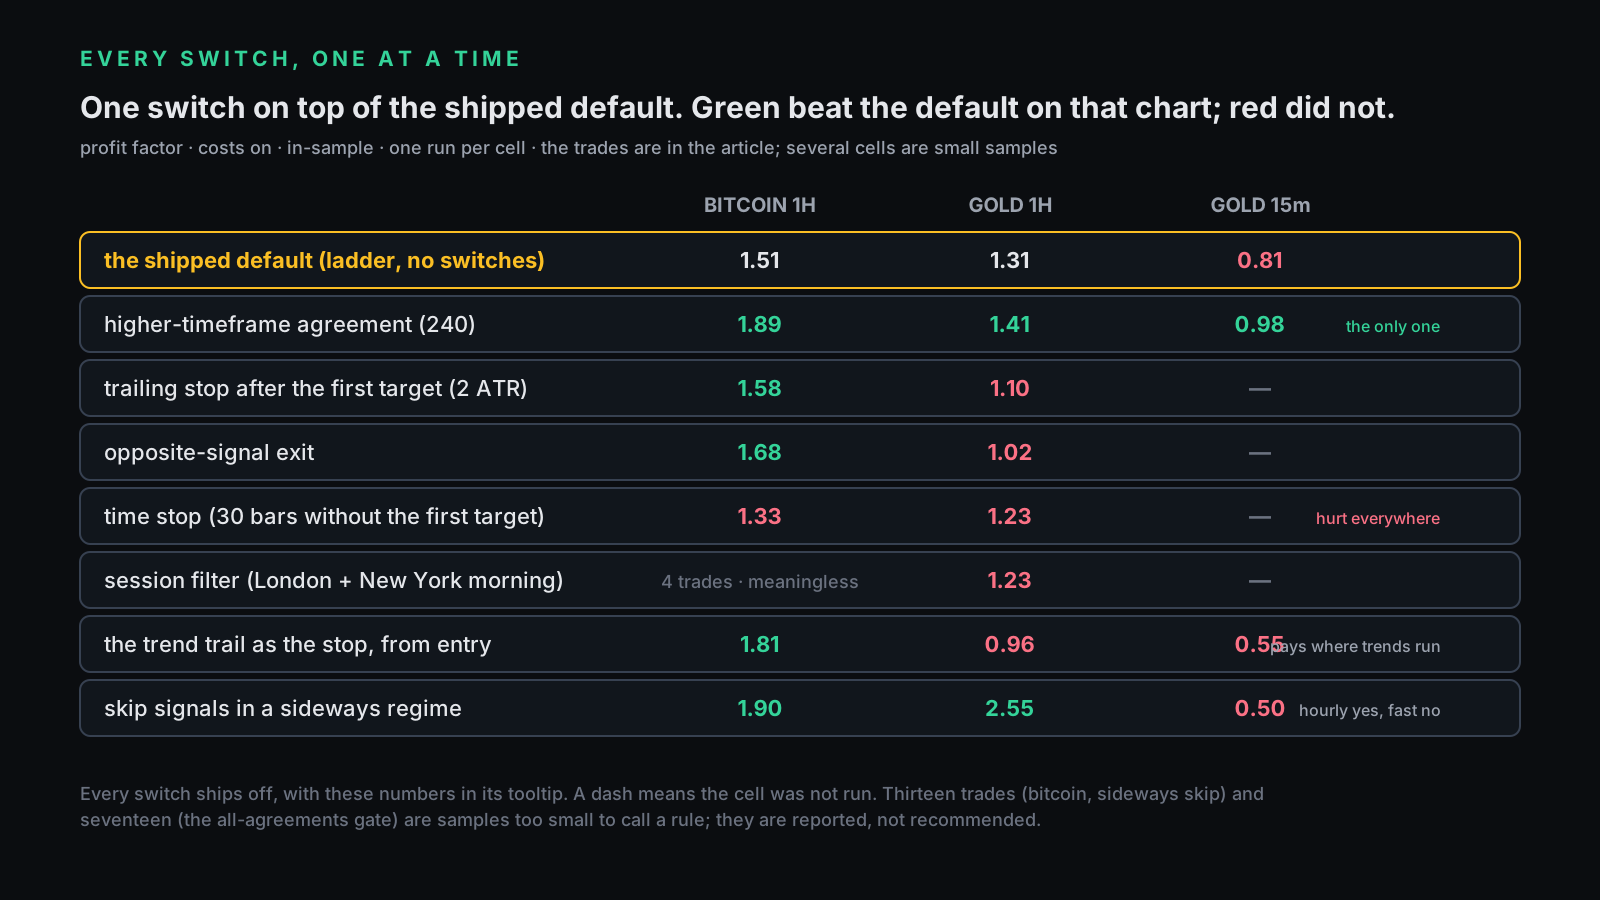
The higher-timeframe agreement, price on the same side of the EMA on the four-hour chart, was the only switch that improved the profit factor everywhere: 1.89 on bitcoin, 1.41 on gold 1H, and 0.98 from 0.81 on gold 15m, with fewer trades each time. A trailing stop after the first target and an opposite-signal exit both helped bitcoin and hurt gold; the two markets trend differently after a pop. The time stop hurt on both charts it ran on. The session filter produced four trades on a market that never closes, and is for session markets only.
The trend trail is the most visible object on the chart, and the reference chart we were sent uses exactly such a line as the stop. So it was wired as one and measured. From entry, it paid 1.81 on bitcoin and lost on both gold charts, 0.96 and 0.55. Our first version of the trail flipped on every close across the EMA and zig-zagged through ranges; the shipped one flips only when price closes through it and ratchets with the extreme since the flip, which is why gold 1H went from 0.62 to 0.96 between versions. It pays where trends run and costs where price chops around the average, which is the definition of a switch.
The last switch came from the second complaint we had while building: the system did not know it was sideways.
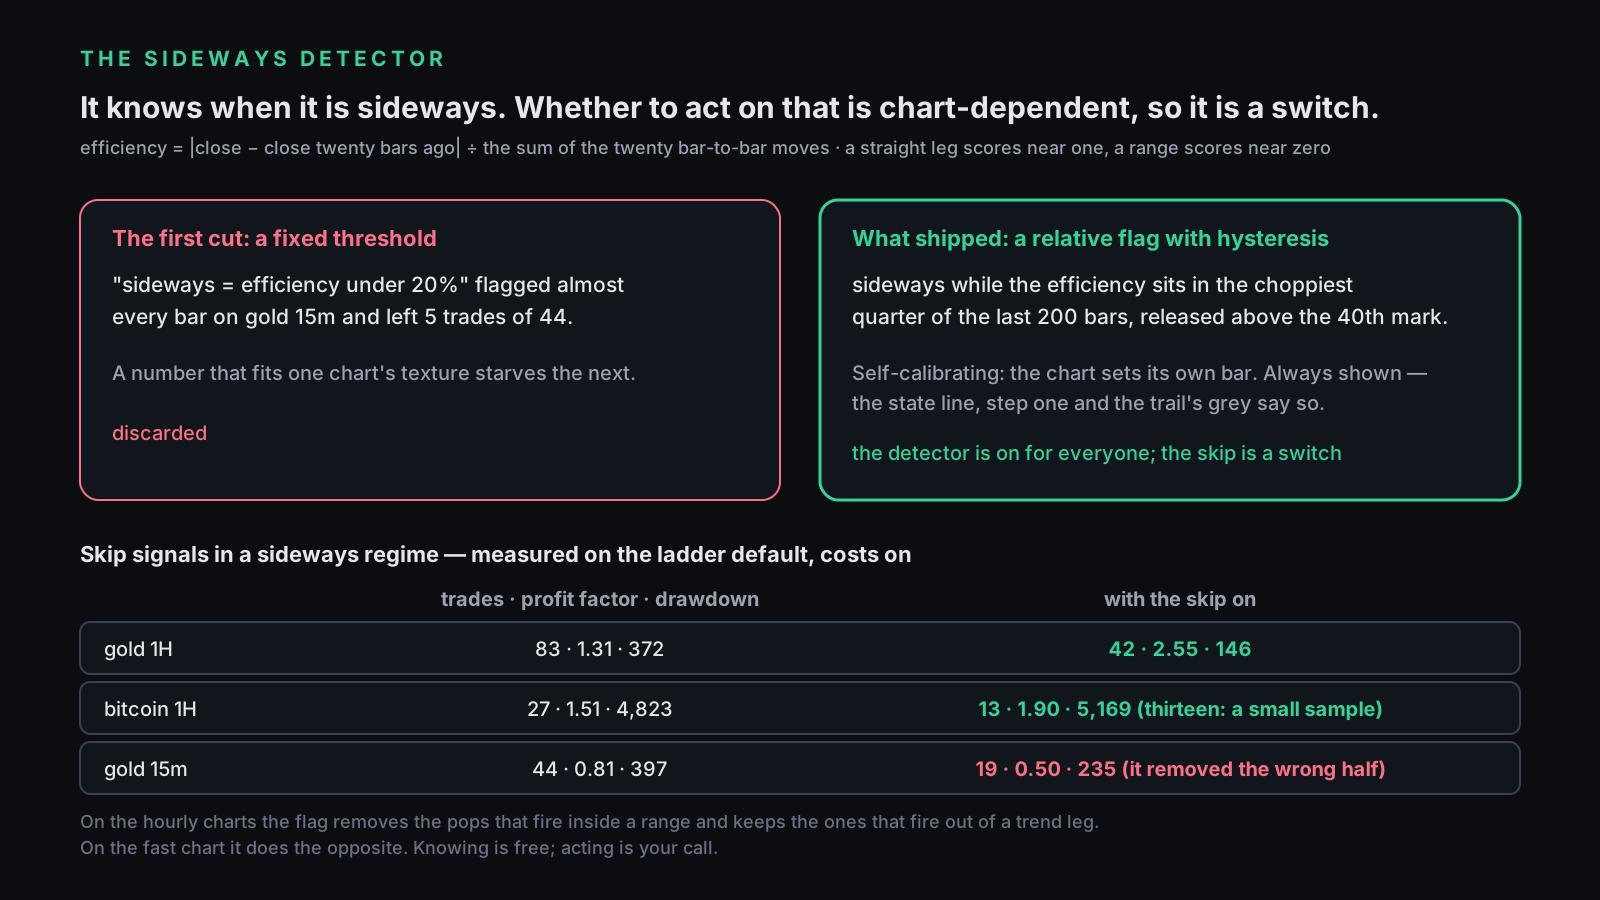
The detector reads efficiency: the net move over twenty bars divided by the distance travelled. Our first cut used a fixed threshold and flagged almost every bar on gold 15m, leaving five trades of 44. The shipped flag is relative, sideways while efficiency sits in the choppiest quarter of the last two hundred bars, released above the fortieth mark so it does not flicker. Skipping signals while the flag is up took gold 1H from 83 trades at 1.31 to 42 at 2.55 and cut the drawdown from 372 to 146. Bitcoin went to 1.90 on thirteen trades, a small sample. Gold 15m went to 0.50: it removed the wrong half.
VI. What we shipped, and why the default is the ladder
Answer first: the free Stochastic Pop Desk enters on the four-step checklist with the classic gate, and exits on the ladder, because that combination measured best on two charts and tied on the third. Everything else is a switch with its number in the tooltip.
The panel shows the checklist with a tick or a cross per step, the reason in words, and the Missing row. The Co-Pilot says the same in three lines. The record row shows closed paper trades and how they ended, band, stop or target, so the exit breakdown that started this article is on the chart for your instrument too.
The honest ledger:
- Good: the checklist does what the comment asked. The stop is structural. The twin runs with costs on from bar one, and it is generated from the indicator, so the two cannot drift.
- Unproven: the edge. Three charts, one window each, in-sample, with several cells under 25 trades. Gold 15m did not pay under any setting; the method was designed for swing timeframes and the hourly charts agree.
- Dangerous if misread: the all-agreements gate and the sideways skip. Both look brilliant on a chart or two and lose on another. Flip them with the tooltip open.
Want the trend and momentum read across timeframes and symbols at once? The MTF Confluence Matrix does that for a whole watchlist, with the same funnel-and-ledger honesty. Free first is the right path; the paid tool assumes you have run the free one.
The 20-minute audit for any momentum indicator you rent
Minutes 0–5. Find the exit rule in words. If the tool exits on the same oscillator that got you in, ask how often that happens before a target.
Minutes 5–10. Ask for the exit breakdown. How many of the last fifty trades ended on the signal, the stop, or a target? If the tool cannot say, it does not know either.
Minutes 10–15. Judge the expectancy, not the hit rate. Average winner times the winners, minus average loser times the losers. A thirty-percent system can be fine; a fifty-percent system can lose.
Minutes 15–20. Flip one switch at a time, with costs on, and write down what it did on a second chart before you believe it.
Disclosure
We build and sell indicators. This one is free because a tool that publishes the chart where it did not pay is the pitch for every tool we charge for. Nothing above is advice, and the numbers are three symbols, one window each, measured by us, not validated out of sample.
The one question to ask any momentum-signal seller: how do the trades end, and did you measure the exit you recommend?
A hit rate is a description. An exit is a decision. Only one of them was ever the problem.