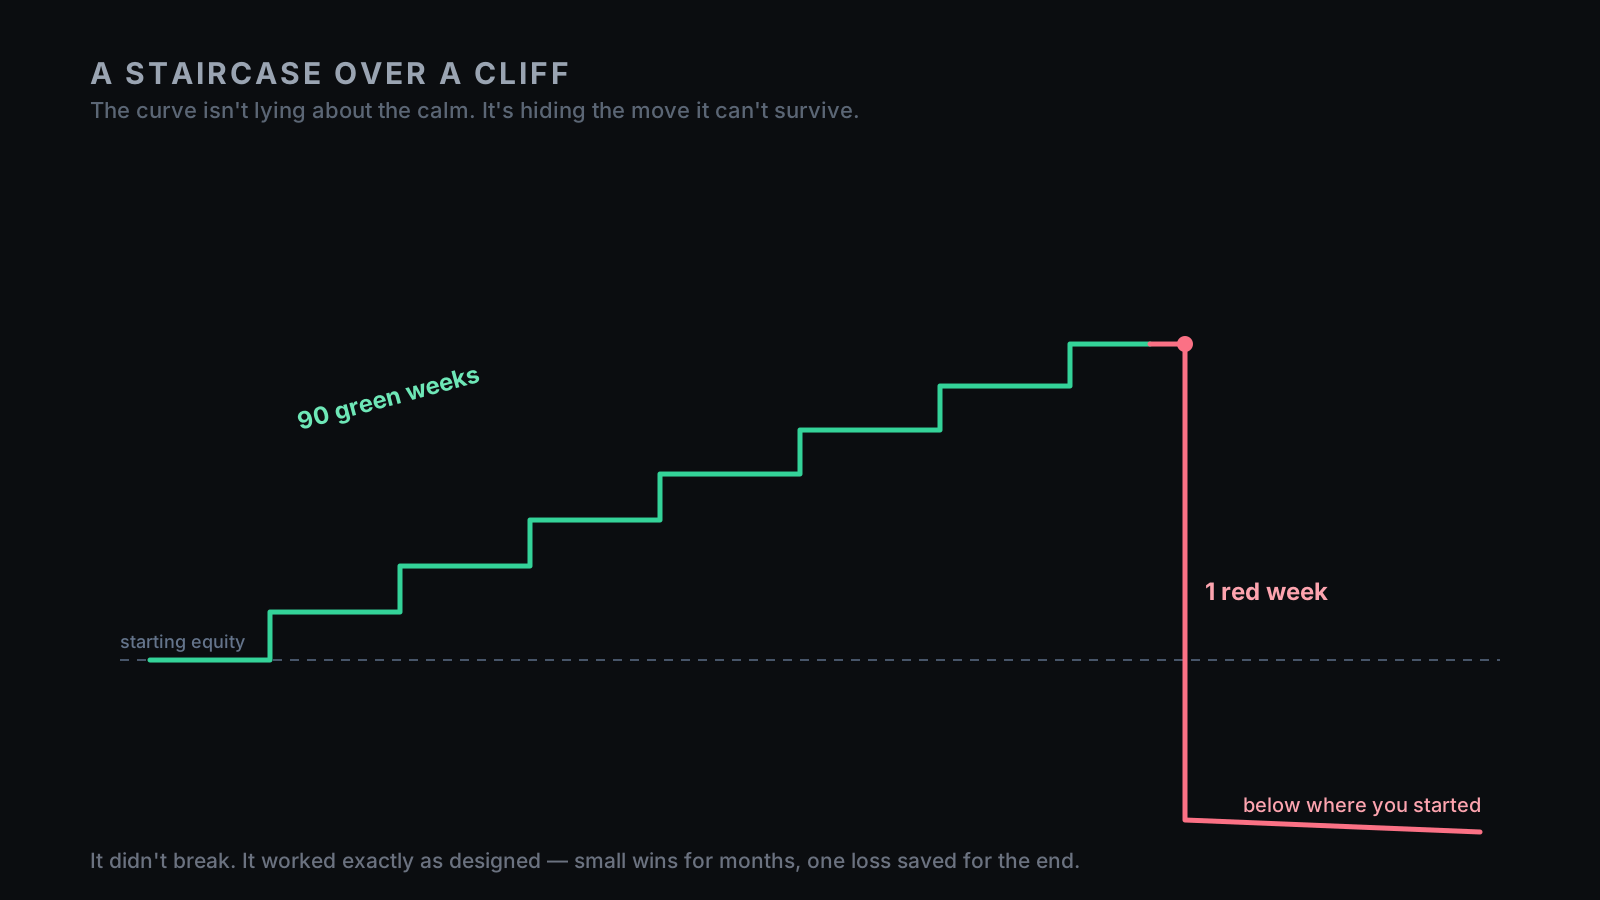
You bought the EA because the curve was perfect.
Not good — perfect.
A clean staircase, up a little every week, almost no drawdown, a win rate north of 90%, months of green with no drama and no thinking required.
You started small and it worked, so you added size and it still worked, and you told a friend.
For a while it felt like you'd finally found the thing every trader secretly wants: a machine that just works while you sleep.
Then the market trended. Not a crash, not a black swan, not a historical event anyone will make a documentary about — just a steady, one-way move that didn't pull back soon enough. The EA opened against it, then opened again, then again. Each new position improved the average price; each new position also increased the exposure. The floating loss that always used to recover in a few hours kept growing, the staircase stopped looking like a staircase, and below it was air.
Here's the uncomfortable part: the EA didn't break. It worked exactly as designed. A dangerous grid or martingale isn't a broken system — it's one that trades a long calm sequence of small wins for one rare, catastrophic loss. The calm sequence isn't proof the cliff is gone. It's the reason people keep walking up the stairs.
Before we start, two requests:
- Save this before you buy your next "set and forget" robot.
- Send it to the friend posting a flawless equity staircase.
Not because every EA is a scam, and not because every grid concept is useless — but because the one number that would have warned you usually isn't on the curve, the win rate, or the sales page. It's in the code. And most of these never let you see it.
Skip this if you already understand negative-skew grid risk
A grid adds positions at intervals as price moves; a martingale increases size after losses. The dangerous version of this family does both while refusing to take small losses honestly — it bets price will revert before the account runs out of margin. In calm markets price often reverts, the system collects many small wins, and the curve looks beautiful. In a sustained trend price doesn't revert soon enough: losers stack, exposure grows, margin shrinks, and the account meets the one move the system was never built to survive.
| What the curve shows | What the structure may hide |
|---|---|
| A smooth staircase up | Risk being stored, not closed |
| Months of small wins | A short-volatility, insurance-selling payoff |
| "No losing trades" | Losses deferred into an open basket |
| Tiny drawdown | Drawdown that hasn't been billed yet |
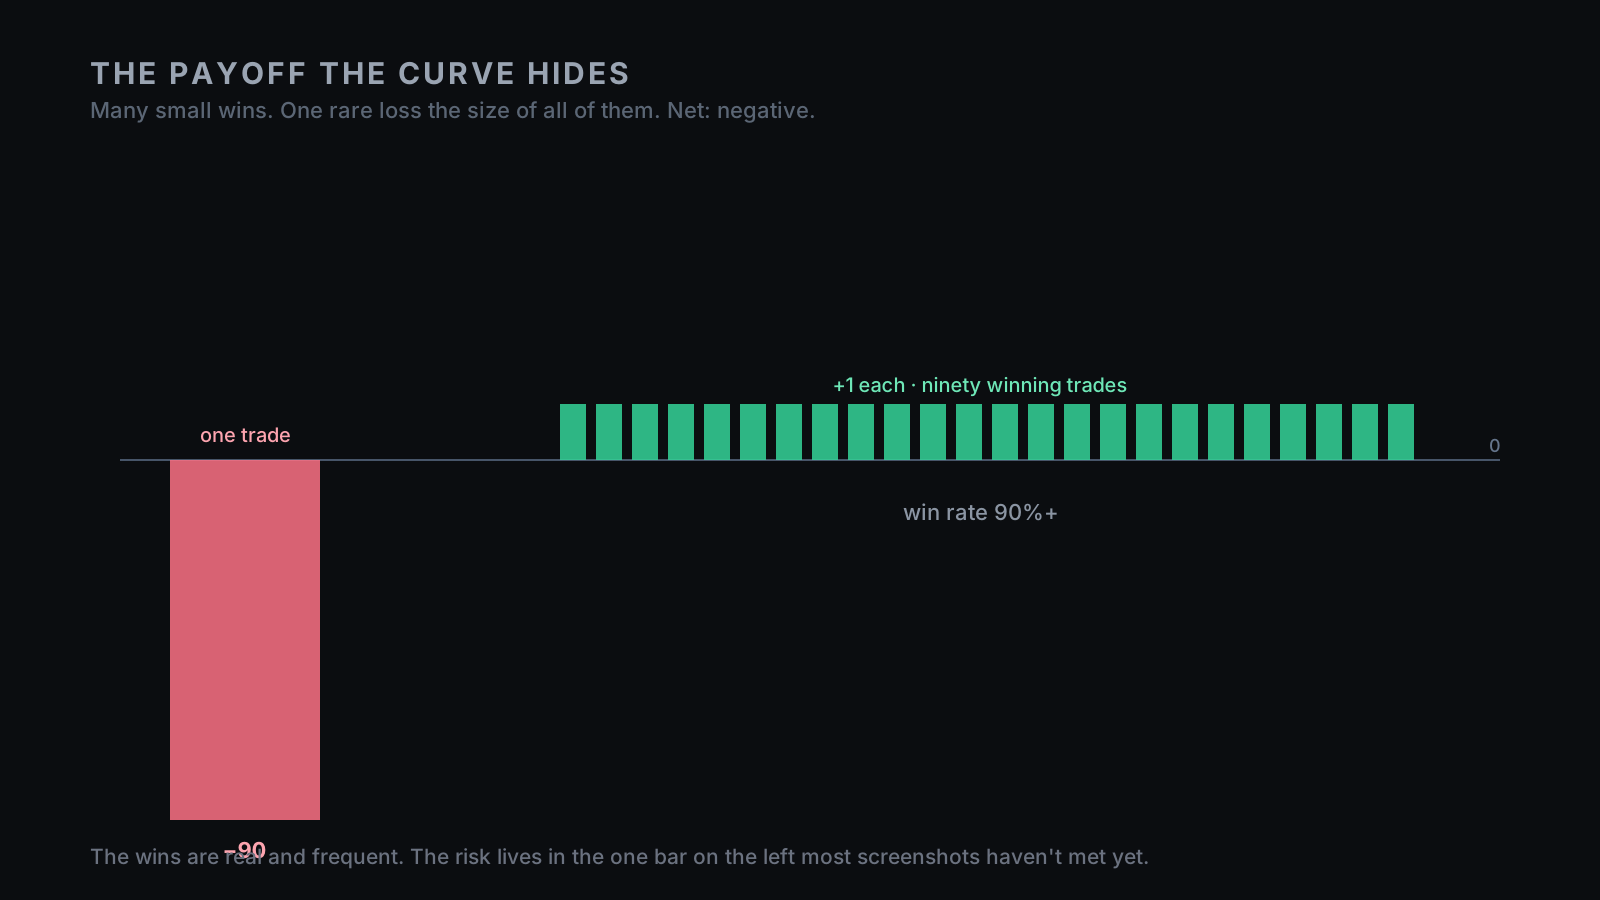
| 90%+ win rate | Negative skew — many small wins, one rare large loss |
| "Set and forget" | Exposure that can grow faster than the account can survive |
A dangerous grid doesn't always have a losing streak. Sometimes it has just one loss — and it saves it for the end.
I — What a grid or martingale actually does
Strip away the branding and the mechanic is simple. The EA opens a trade; if price moves against it, instead of taking a defined loss it opens another trade at a better price, then maybe another, then another. That creates a basket, the average entry improves, and now price only needs a smaller retracement for the whole basket to close green. A martingale adds a second layer: after a loss the next position is larger, so a small reversal on a bigger size recovers the sequence. The emotional experience is powerful — you were wrong, then the EA made you right, again and again. That's why traders fall in love with these systems: they convert discomfort into recovery. Until they don't.
A grid isn't automatically stupid. Averaging into mean reversion can be a legitimate idea — if exposure is bounded, risk is defined, and losses are accepted before the account is threatened. The dangerous version is a different animal: it adds to losing positions without a true per-trade stop, it increases size after pain, it lets total exposure grow beyond what a normal trend can survive, and it calls delayed loss "recovery." That isn't an edge by itself. It's a payoff shape — many small wins, one large test — and whether it's a strategy or a slow-motion accident depends entirely on the bounds, which is exactly what the curve never shows you.
II — The staircase is the bait
Grid EAs are seductive because they look better than honest systems during calm periods — and markets spend a lot of time calm. Price dips, the EA adds, price retraces, the basket closes green, repeat. The account rises in small steps, the trader sees consistency, the seller has screenshots, the buyer sees no losing streak, and everyone relaxes. That relaxation is the trap. The system isn't proving it has removed risk; it's proving the market hasn't yet delivered the specific path that exposes it.
This is negative skew — many small wins, rare large losses — the machine from Win Rate Is a Vanity Metric in a new uniform. The system feels safe because it wins often, but win frequency was never the risk; the tail is. A smooth, drawdown-free curve can be a genuinely good sign in some strategies — in a grid or martingale it can be the opposite, a sign that losses are being postponed instead of closed. The curve isn't telling you risk is low. It may be telling you risk is still unpaid. Humans trust smoothness. The market bills for it later.
III — The cliff is in the structure
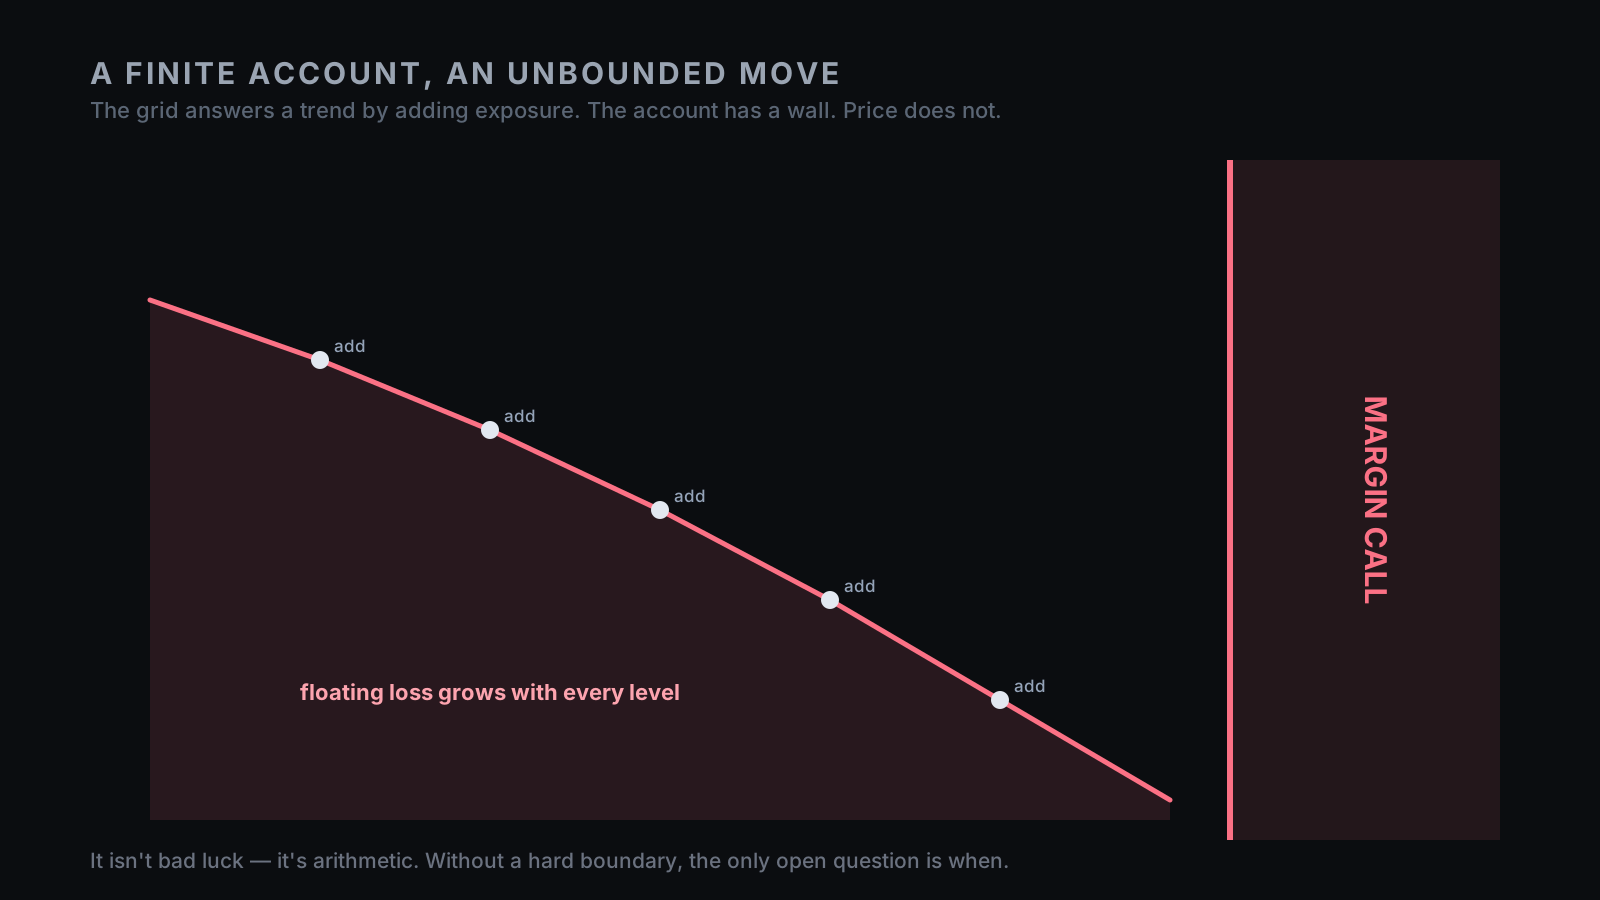
A dangerous grid doesn't blow up because the market did something impossible. It blows up because the account is finite and the adverse move doesn't have to be. Price can travel one direction longer than your margin can survive — that alone is enough. The system responds to adverse movement by adding risk: each new position improves the average entry and also increases the floating loss if price keeps going. Early on that looks clever; later it becomes a wall. Your account has a maximum amount of pain it can absorb, and the market neither knows nor cares where that maximum is.
In martingale form it's sharper still: size grows after each loss — 1, 2, 4, 8, 16 — and the early steps feel manageable until the next required step is larger than the account can carry. That isn't bad luck. It's arithmetic. Without a hard boundary, the question was never whether the system can meet a move it can't survive — only when. And to be precise, this does not mean every grid must end in a total wipeout: a grid with hard stops, capped exposure, small size, and a willingness to close losses can survive as a bounded strategy. But that bounded version isn't the fantasy most people buy. The fantasy is small wins forever, no real stop, recovery will save it — and that fantasy is the cliff.
IV — The curve is the marketing
A dangerous grid is most sellable before the dangerous move arrives — that's the commercial problem, framed structurally rather than as an accusation against any one seller. During calm periods it produces exactly what buyers want to see: a smooth curve, a high win rate, low visible drawdown, regular profit, no drama, no explanation needed. That track record can be entirely real, the trades can be verified, the account can genuinely have grown — and the most important event simply hasn't happened yet. Verification proves the staircase existed. It does not prove the cliff is absent.
That's the hard part for buyers: the evidence looks strongest during exactly the period when the hidden risk is still hidden. A seller doesn't need to fake anything — they only need to show the calm and omit the structure, and the calm sells itself. When the trend finally comes, the explanations are ready-made: unusual conditions, a black swan, the user changed settings, a broker issue, bad timing, needed more capital. Sometimes those contain truth. But the structural question they dodge is the only one that mattered: was the system built to take bounded losses, or built to delay losses until the delay failed? The curve can't answer that. The rules can.
V — The backtest makes it worse
A grid or martingale can backtest beautifully, and that's not a comfort — it's exactly why it's dangerous. Run it over a historical window that doesn't contain its killer trend and the result can look extraordinary, because in the sample you chose, price reverted soon enough. The backtest isn't necessarily lying; it just wasn't asked the only question that matters — what happens when price doesn't come back before the account runs out of room?
Then comes the optimizer trap. Widen the grid, add more levels, increase recovery depth, delay the cutoff, reduce the chance of ever realizing a loss — and the backtest improves, the curve smooths, the worst historical period gets survived. It feels like making the system safer. It's usually the opposite: you've pushed the failure point just past the worst thing in your sample, so the live failure now requires a larger move — and when it comes, the loss is larger too. This is curve-fitting with margin: the past looks solved, and the future inherits a bigger bomb. That's why "survived the backtest" is never enough for this class of system. You have to test the move that wasn't in the backtest — a one-way trend, a gap, a volatility expansion, a no-pullback session, a cost spike — a stress path worse than history. If it only survives because history was kind, it didn't pass. It negotiated with the sample.
VI — "But mine has a stop"
This is the standard defence: my grid has a stop, my EA has smart recovery, it has max-drawdown protection, it uses AI to know when to quit. Maybe — but the words don't matter, the implementation does. There are real risk controls and there are cosmetic ones. A real control defines the loss before the account is threatened; a cosmetic one closes after most of the damage is done. A max-drawdown stop that fires only at catastrophic loss doesn't remove the catastrophe — it converts a total wipeout into a large realized loss, which can be better than zero but is not the same as bounded per-trade risk.
"Recovery mode" often has the same problem: it's frequently martingale with better branding — trade bigger after pain, open more to repair, average harder, delay recognition. These aren't automatically evil, but they must be named correctly. They are risk increases, not risk removal. The boring fix is harder to sell and easier to survive: a hard stop per position, capped total exposure, a maximum basket size, no lot increase after a loss beyond a bounded amount, spread and news halts, and a rule that accepts small losses before they become account events. That version won't print the same flawless staircase — which is precisely the point. And you cannot tell real safety from cosmetic safety by reading the sales page. You have to read the code.
VII — You can't see the bomb on the curve
This is the practical heart of it: you cannot reliably detect a grid bomb from the outside. Not from the equity curve — a dangerous grid and a real edge can both look smooth before stress arrives. Not from the win rate — a high win rate is often the signature of negative skew, not evidence against it. Not from a verified track record — verification proves the trades happened, not that the strategy survives the path it hasn't seen. Not from months of profit — that may only mean the calm lasted months. There's one place the truth gets hard to hide: the logic. Ask four questions, and read them off the rules, not the curve.
One — does it add to losing positions? If yes, it's grid-like; not automatically fatal, but treat it as negative-skew exposure until proven bounded. Two — does position size grow after a loss? If yes, martingale or recovery-sizing logic exists, and the burden of proof rises sharply. Three — is there a hard, fixed stop on every position or basket — a real invalidation defined before the trade, not an account-level emergency after the damage? Four — is total exposure capped — max open positions, max lots, max basket risk, max correlated exposure? If the answer to any of these is vague, the risk is vague — and vague risk is usually larger than advertised. A black box that won't let you check those four things has already answered them — with the refusal. If you can't read the logic, you're not buying a system; you're buying a curve and hoping the cliff is far away.
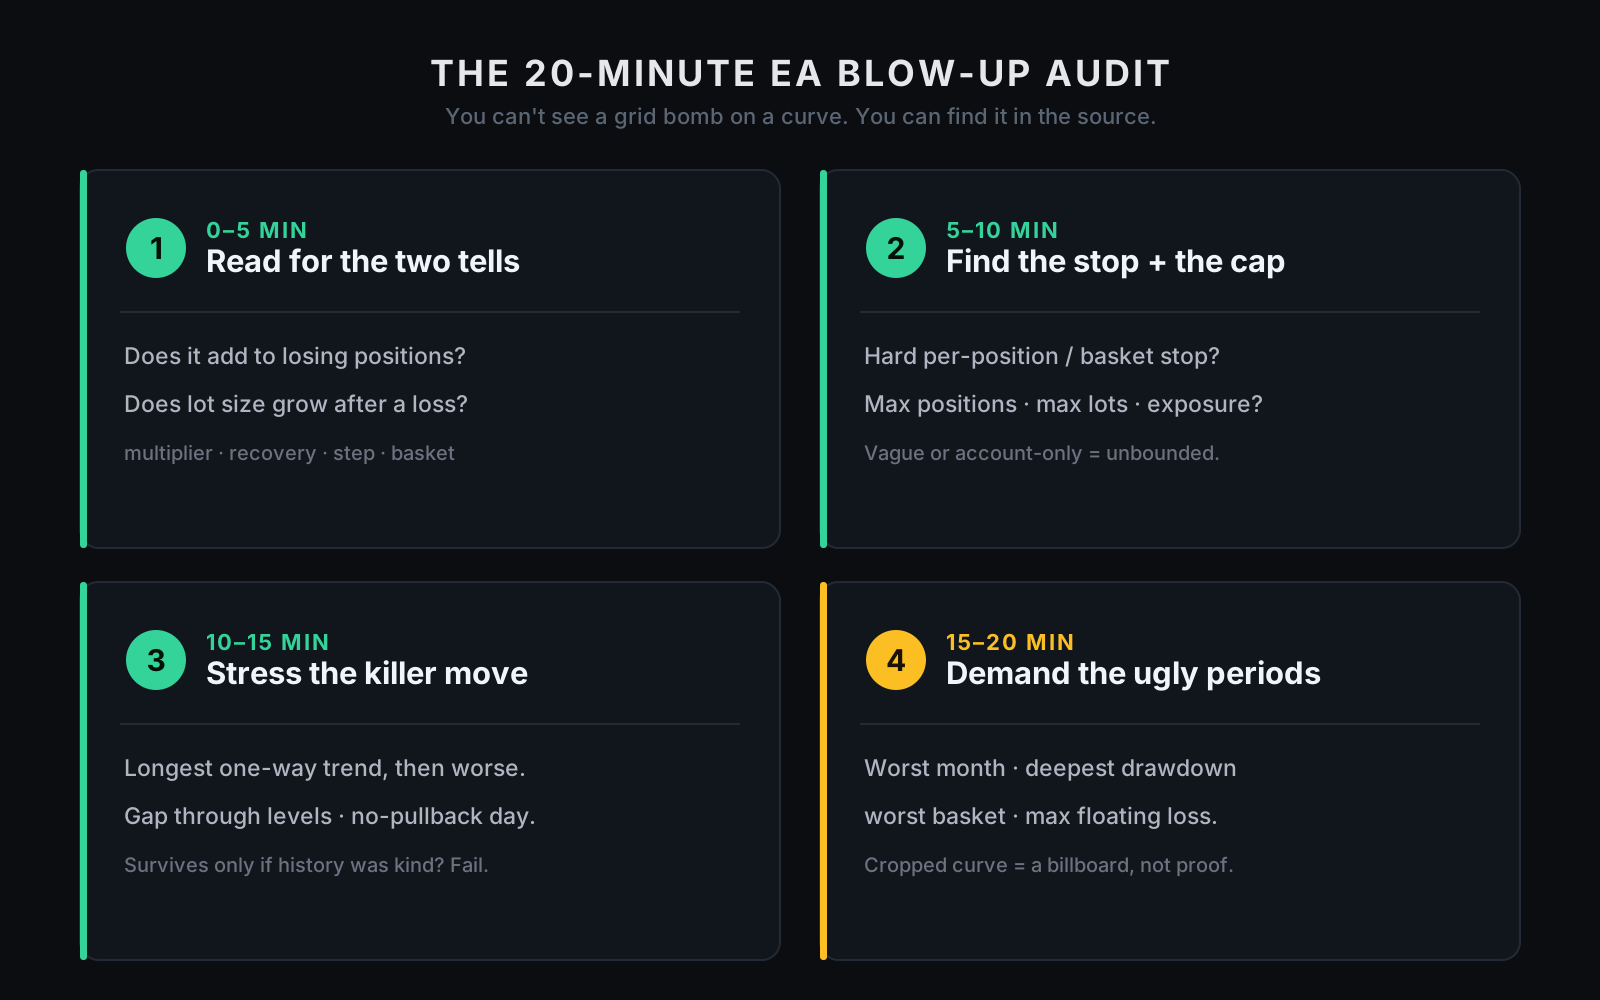
VIII — The 20-minute EA blow-up audit
Run this before any robot touches real money — yours, a seller's, a marketplace EA, the bot a friend swears by, and especially the one with the perfect staircase.
Minutes 0–5 · Read for the two tells. Search the source or docs for averaging down (does it open more trades as price moves against an open one?) and for recovery sizing (does lot size increase after a loss?). Look for the words multiplier, recovery factor, step, grid distance, basket, averaging, martingale, lot exponent. If either tell is present, assume negative skew until proven otherwise.
Minutes 5–10 · Find the hard stop and the exposure cap. Locate a per-position stop, a basket stop, max open positions, max total lots, max exposure by direction, and any spread/news halts. If these are missing, vague, or only account-level after catastrophic loss, the system isn't safely bounded.
Minutes 10–15 · Stress the killer move. Don't only run normal history — run hostile paths: the longest one-way trend in the instrument, then worse; a gap through multiple grid levels; a no-pullback session; a spread spike during high exposure. A real system takes defined damage and lives; a grid bomb stacks losers into the wall. If it "passes" only because your sample never contained the move, it didn't pass.
Minutes 15–20 · Demand the ugly periods. Ask for the worst month, the deepest drawdown, the longest time underwater, the worst basket, the maximum floating loss, a crisis window. A curve with the bad parts cropped out isn't evidence — it's a billboard. An EA that only shows you the staircase hasn't shown you the system; it's shown you the sales angle.
Where this meets ProEA
Now the honest part, and it cuts straight at us: MTR is an EA, and this entire article is an argument for distrusting EAs. Good. Distrust ours too — then do the thing that actually settles it: read it.
That's the whole reason we sell MTR as full MT5 source instead of a sealed black box with a beautiful curve. You can check the risk logic yourself: does it add to losing positions, does size grow after a loss, where is the hard stop, how is total exposure capped, what happens in hostile windows, how are the bad months shown, how does it behave when the trend doesn't stop. A curve can't answer those; source can. And the published 28-month backtest keeps the flat periods and drawdowns visible — not because a backtest proves the future (it doesn't), but because cropped staircases are the whole problem, and the ugly periods are part of the evidence.
To be precise about what that does and doesn't mean: source and a grid are inspectability, not a promise. They don't make MTR immune to loss, they don't guarantee the future, and they don't guarantee your broker matches our test. Every strategy can lose, ours included. What inspectability gives you is the ability to see how a system is built to lose — and a bounded loss you can read in the code is a different thing entirely from a hidden loss you discover on the one red week. That distinction is the entire point.
Disclosure: the one question that ends the demo
We sell source and evidence you can inspect — not outcomes, not a curve, not a set-and-forget promise. No EA or backtest can promise future results; past performance is not future performance; every backtest is broker- and sample-specific; every live account carries real risk, ours included.
So the next time someone sells you a flawless equity staircase — a guru, a marketplace, a robot, us — ask the question the demo never wants: "does it add to losing positions, and where exactly is the hard stop — can you show me, in the code?" If the answer is the curve, the answer is no.
Your first 20 minutes
Don't take our word for it. Take the source.
Minutes 0–5 · Open the risk layer first. Skip the entries and go straight to position sizing and stops: is lot size fixed or risk-derived, does it ever grow after a loss, where is the per-trade stop, where is the basket stop, what invalidates the trade? This is the part a grid bomb hides — and the part that decides whether you survive.
Minutes 5–10 · Find the exposure ceiling. How many positions can be open at once, what's the max total lot size, can exposure stack in one direction, can the system add while already in drawdown, is there a hard cap you can point to? A number you can point to is a system; "no clear limit" is a countdown.
Minutes 10–15 · Read the losing months. Pull the published 28-month evidence and go to the worst stretches first — the flat periods, the drawdowns, the ugly windows. A real system has them in plain sight; a sales curve hides them. Notice that they're there at all — that's the opposite of a cropped staircase.
Minutes 15–20 · Decide on what you read. Bounded per-trade risk, real stops, capped exposure, drawdowns you could sit through, failure modes you understand → then a small forward test. Not because the curve was smooth. Because you read how it loses and decided you could live with it.
One last thing
If this stopped you from funding one more flawless-looking staircase, it did its job. Send it to the trader about to buy a robot because "the curve looks amazing."
A staircase is a beautiful thing to watch. Just never stand on one when you can't see the bottom.
So — is a grid trading EA safe?
Not by default. Averaging into mean reversion can be legitimate if exposure is bounded, risk is defined, and losses are accepted before the account is threatened — but the version most people are sold is the other one: no true per-trade stop, size that grows after pain, exposure left free to outgrow the account, all of it hidden behind a staircase that only looks perfect because the killer trend hasn't arrived yet.
Safe is a question about the code, not the curve. Ask the four questions above — does it add to losers, does size grow after a loss, where's the hard stop, what caps total exposure — and a bounded grid can pass. Leave them vague, and the smooth equity line isn't proof of safety. It's a staircase over a cliff you just haven't reached.