Spread is a tax you can't see.
And like every tax, what ruins you isn't the rate — it's what it compounds into.
There are two prices in every market: the one on your chart, and the one you actually get. Most traders build systems on the first. Their account lives on the second.
That gap looks harmless — a few points, a thin line between bid and ask. Then you trade it 800 times. Add slippage. Add commission. Hold overnight and pay swap. Let the spread widen during the exact minute your system decides to enter. And the clean backtest becomes a slow bleed with better branding.
We call the visible part of that gap the spread. But spread is only the brochure. The real bill is the all-in execution tax: spread, slippage, commission, swap, and the hidden cost of demanding liquidity at the wrong moment. Most traders pour weeks into entries and never measure the one number deducted from every trade, win or lose.
This is how a desk thinks about that number — not as a footnote, but as a system-design problem.
Before we start, two requests:
- Save this before you tune another entry signal.
- Send it to the scalper who's proud of a 90%-win backtest run at a fixed one-pip spread.
Not because cost is the whole game — because cost is the part almost nobody measures, and if you don't measure it, the market measures it for you, usually at a worse price.
Skip this if you already price every trade net of cost
The number on your chart is a courtesy. The number you trade is a negotiation — and you lose it by a little every time. That little isn't random; it has structure:
| What you're quoted | What you actually pay |
|---|---|
| A tight, "average" spread | The spread at the moment your system trades |
| A clean stop price | A fill through the stop, in a fast move |
| "Zero commission" | Spread + slippage + financing, somewhere |
| One line on the chart | The ask when you buy, the bid when you sell |
| A profitable gross backtest | The result after the execution tax |
| A high win rate | A win rate that can still lose after cost |
None of it is fraud — it's market structure. The trouble is that most backtests show the part that's easy to see and shrink the part that decides whether the edge survives. Incomplete cost is easier to ignore than a bad signal — which is exactly why it kills more systems.
I — The chart shows one price. You trade two.
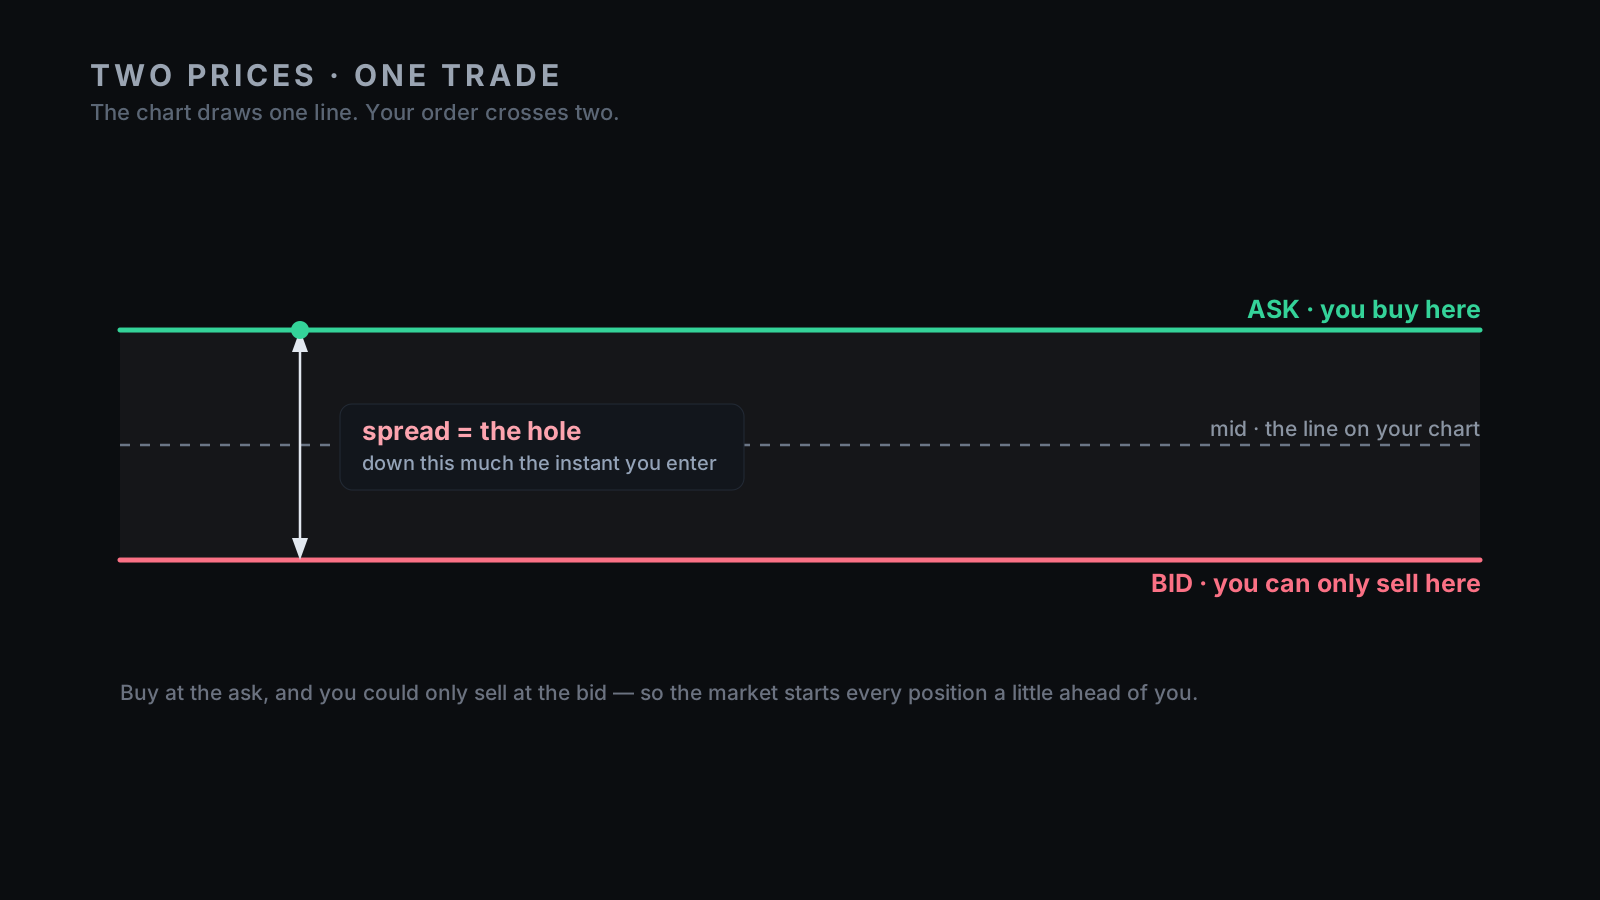
A chart draws one price per moment. Your broker quotes two: the bid, where you can sell, and the ask, where you can buy. The gap between them is the spread — and it isn't a fee you settle at the end, it's a position you start behind.
Say the mid is 100.00 and the spread is 0.20, so the quote is bid 99.90 / ask 100.10. Buy at market and you pay 100.10; if nothing moves and you exit immediately, you sell at 99.90. You've lost 0.20 — roughly one full spread on a flat round trip: half crossing in, half crossing out. The market never moved. You still lost. That's the hole, and the chart hides it because the chart line is a map, not the executable round trip. The chart is a map. The quote is the terrain.
This is why spread is brutal for short-target systems. A two-pip spread on a trade targeting eight pips isn't a rounding error — it's a quarter of your target, gone before your idea has had a chance to be right. So the first adult question isn't "where's the entry?" It's "how much does it cost to express this entry?" If the answer is vague, the strategy isn't finished. It's sketched.
II — The tax isn't flat — it spikes when you trade
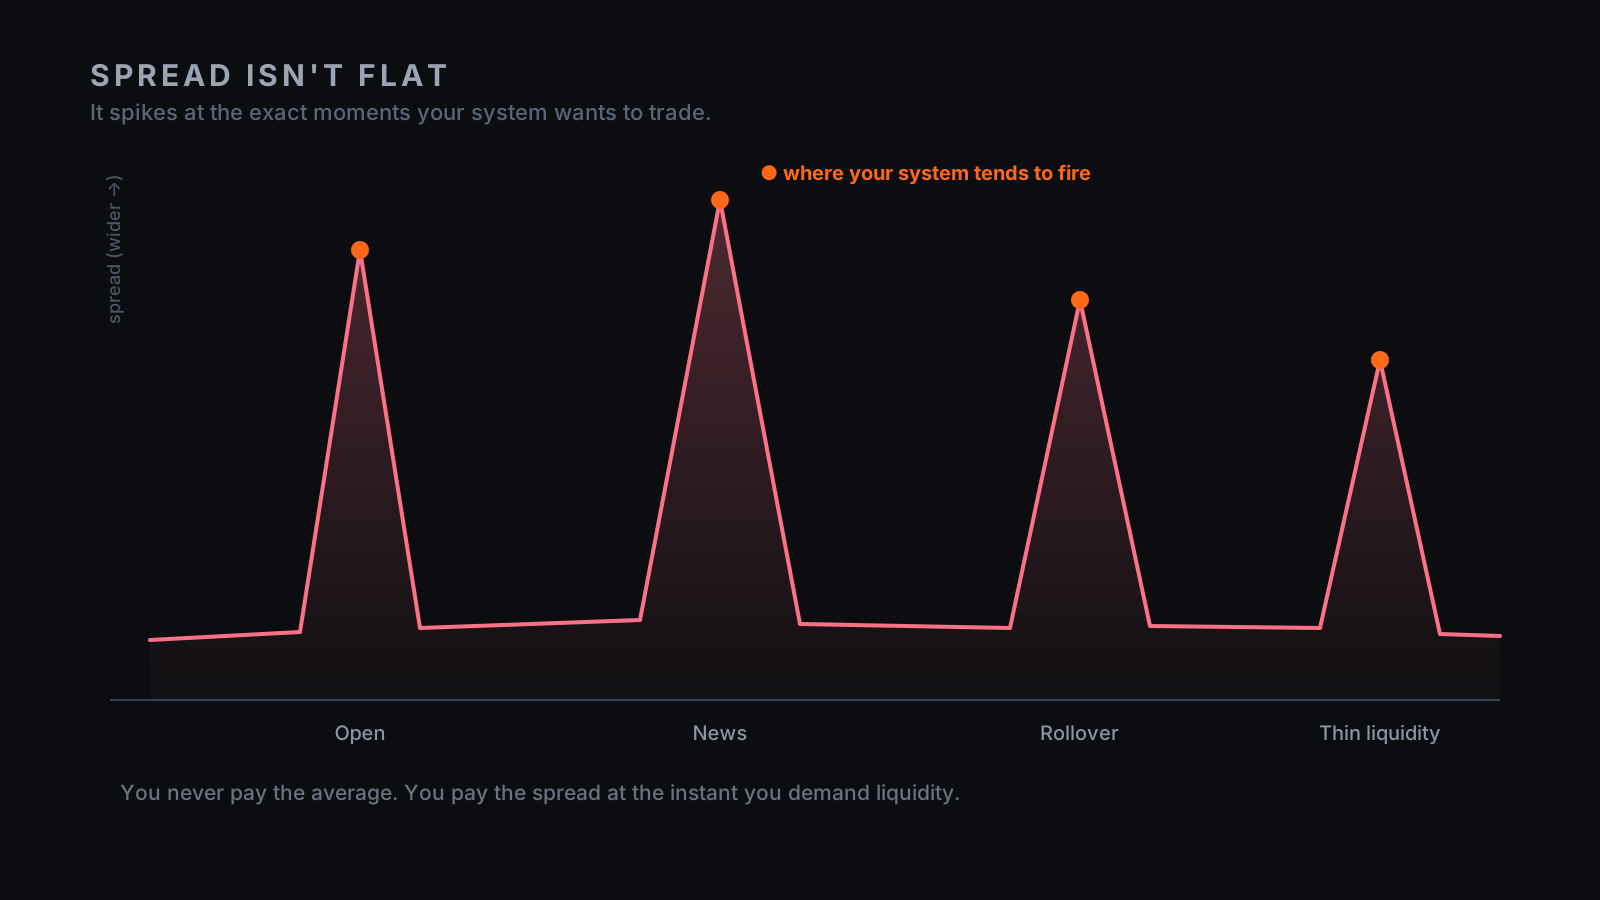
Backtests love a fixed spread because it's easy. Markets don't care what's easy. Spread is the market's price for immediacy, and like any price it moves with the supply of liquidity: narrow when the market is calm and deep, wide when it's thin, fast, or crowded.
So it widens at the exact moments many strategies want in — news releases, session opens and closes, the 5pm New York rollover, thin Asian and holiday liquidity, fast breakouts, panic exits. Now connect that to your system: it doesn't trade at random, it trades when its trigger fires, and many triggers fire during the volatility expansion that also widens the spread. You never pay the average spread. You pay the spread at the precise instants your system chooses to demand liquidity — and those are rarely the calm ones.
That's why a backtest on a flat one-pip spread can be worse than optimistic — it can be describing a different strategy. A scalper barely profitable at one pip and negative at three doesn't have one stable edge with slightly different costs. It has a cost-sensitive edge that changes sign. A robust system doesn't just ask "did the signal work?" It asks "did the signal still work when the market charged the real price for taking it?"
III — The full cost stack
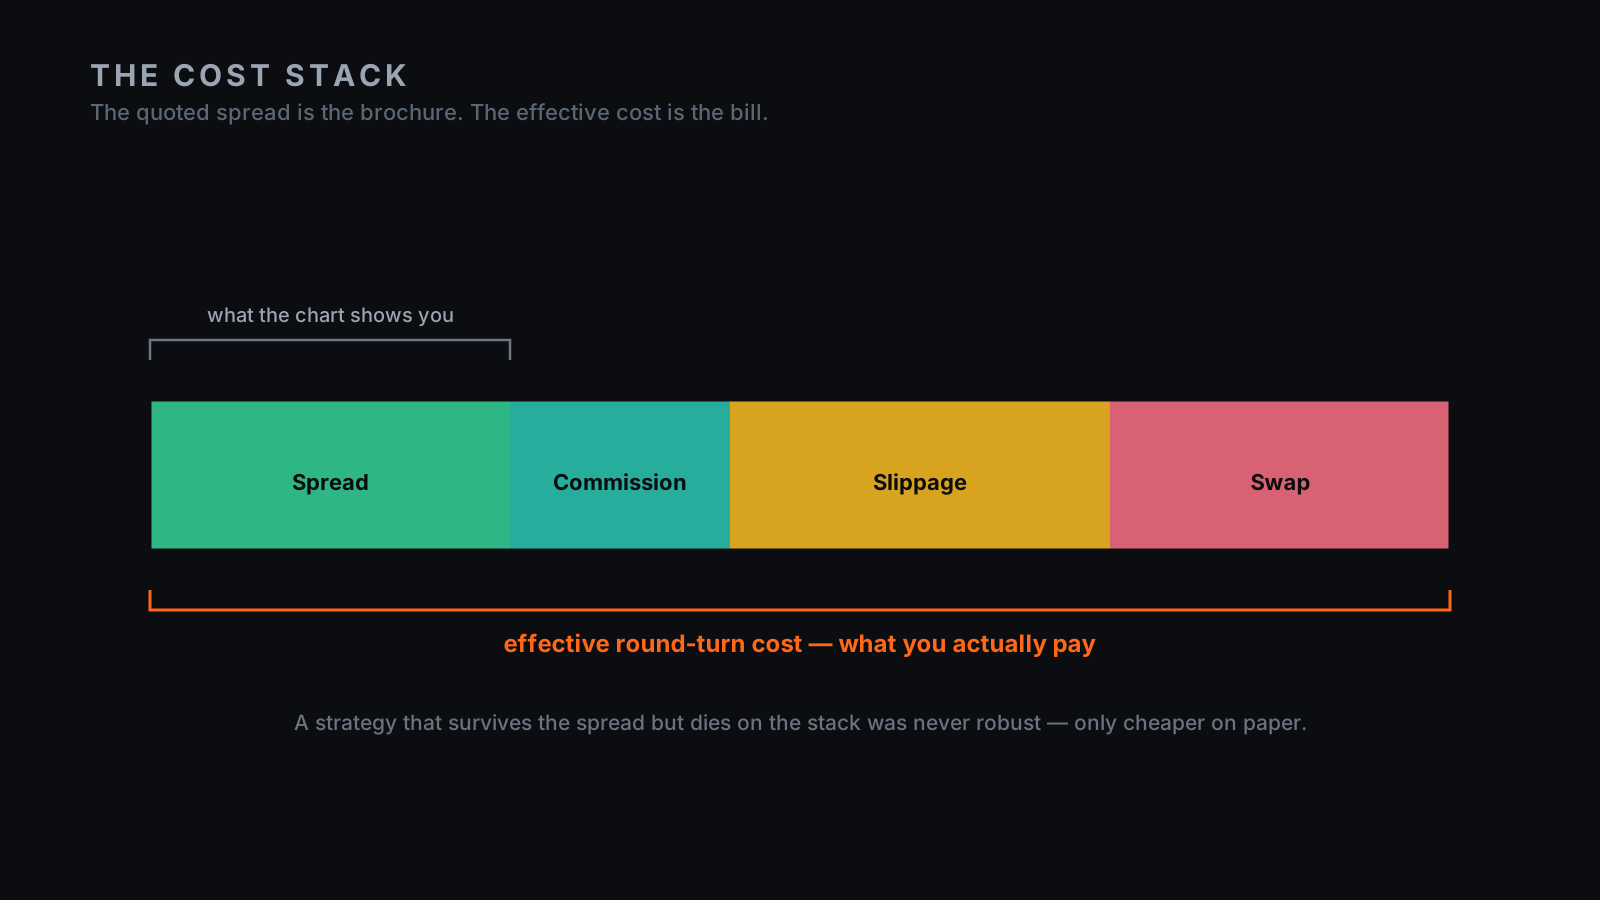
Spread gets the attention because it's visible. The bill has more lines:
- Spread — the bid/ask gap, the cost of crossing from one side of the quote to the other.
- Commission — a per-lot fee. Many accounts simply trade lower spread for explicit commission; in price terms it's just more round-turn cost.
- Slippage — the gap between the price you wanted and the price you got.
- Swap / financing — the cost of holding overnight. Small per night, large across a long hold or stuck inventory.
- Market impact — negligible at retail size; at scale, the cost of your own order eating through the book.
The number that matters is none of these alone. It's the effective, all-in, round-turn cost — quoted spread + commission + realised slippage + financing where it applies. The quoted spread is the brochure. The effective spread is the bill. And they're rarely the same document. A strategy that survives the quoted spread but dies on the stack was never robust — just cheaper on paper.
IV — Slippage is the asymmetric tax
Backtests fill you at clean prices. Markets don't, and the unfairness has a direction. Your best fills arrive when you don't need them — quiet market, patient order, no crowd. Your worst arrive when everyone wants the same thing at once: the stop-out in a fast move, the breakout into a thinning book. So slippage isn't a symmetric, zero-mean nuisance you can average away — its expectation is negative, and it bites hardest exactly when your position is already under pressure. The average day isn't the one that kills you. The stress day is.
A stop order makes this easy to misread. A stop isn't a line where the broker promises that exact price — once touched, it becomes a market order. In a fast move, you don't get filled at the stop; you get filled through it. The backtest shows a clean loss; the live account wears the gap. Aggressive entries have the mirror problem: a breakout bought at market pays the widening spread and slippage into a thinning book. The signal can be right and the fill can still make it wrong. That's execution.
V — Adverse selection
Here's where it gets less obvious — and where you can tell who's actually watched an order book fill. Many traders learn that market orders slip, so they switch to limit orders. Good instinct, incomplete conclusion: a limit order avoids one cost by accepting another.
Ask a simple question — when does your buy limit get filled? It fills when someone is willing to sell to you at that price. Sometimes that's ordinary liquidity. Often it's because the market is about to trade lower, and you're the passive bid being consumed on the way down. That's adverse selection. You won the fill — but maybe the fill you should have been happy to miss.
So there's no free order type, only trade-offs: aggressive orders pay immediacy; passive orders risk being selected exactly when the next tick is bad. A serious system chooses that trade-off on purpose; a weak one buries it in a backtest assumption. It's also why "filled at mid plus half-spread" is too kind — your fills aren't random samples from the day, they're conditional samples from the moments your logic acted, and those moments carry information. The market isn't a calm midpoint machine. It's a crowd trading because they each think the next tick favours them, and your fill is selected from that crowd.
VI — Turnover is the multiplier
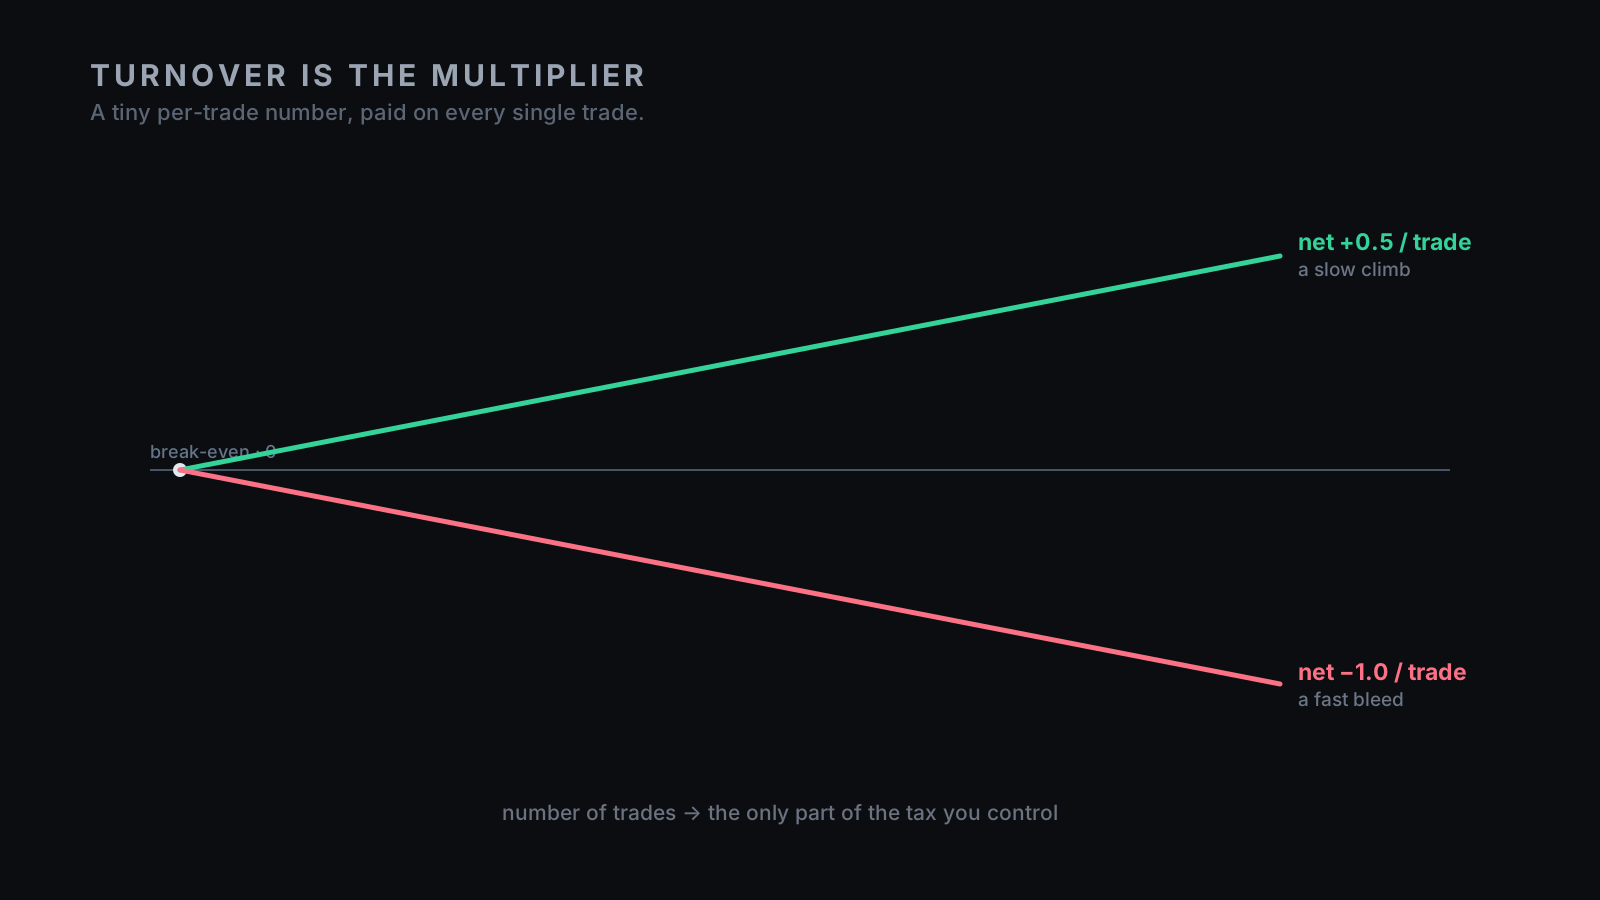
Here's what makes a tiny cost dangerous: it's small per trade, and the system pays it many times. A strategy's net result is simple — net edge = gross edge − cost — and the trap is that these scale differently. Gross edge per trade is roughly fixed by your signal; cost is paid in full on every round-turn, so it scales with turnover, the one number most traders never look at.
Make it concrete (illustrative, not a claim). A setup has a 2.0-pip gross edge. On calm execution: 0.8 spread + 0.3 slippage + 0.4 commission ≈ 1.5 cost → net +0.5. Thin, but positive. Now move the same signal into the windows where it actually fires (Section II): spread to 2.0, slippage to 0.6 → 3.0 cost → net −1.0. Same entry logic, opposite outcome, and nothing changed but the cost at the moment of execution.
Now multiply: five round-turns a day across 250 days is 1,250 payments of that tax. At +0.5 you climb slowly; at −1.0 you bleed fast — on a sign that flipped on execution alone. A strategy isn't profitable or unprofitable. It's profitable or unprofitable at a given cost and turnover. The spread isn't the variable you control. Turnover is. A system that trades less but keeps only its best trades looks duller in a screenshot — and can be far more alive after cost.
VII — The 20-minute cost audit
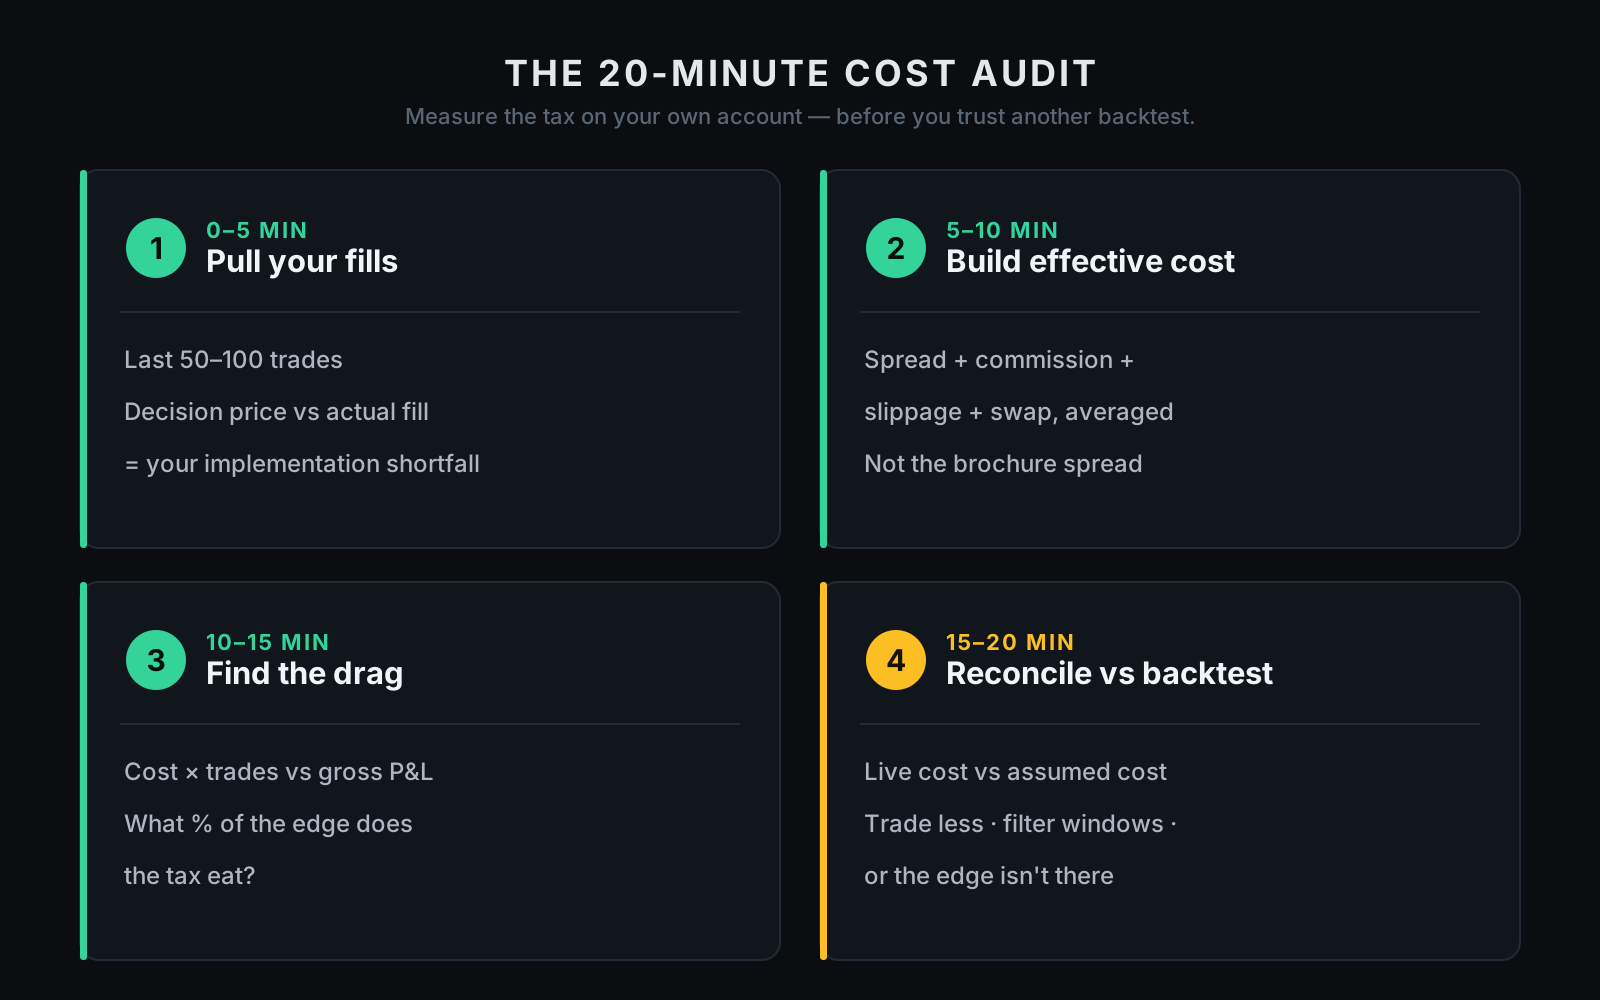
You can't manage a cost you've never measured, and most traders never have. They know their entry model, their indicator settings, their win rate — not their real cost per round-turn. So here's the desk version, shrunk to twenty minutes. Run it before buying an EA, before trusting your own scalper, before optimising another parameter.
Minutes 0–5 · Pull your fills. Take your last 50–100 trades. For each, get the price when your system decided to act and the price you were actually filled at. The difference is your implementation shortfall — not theory, your account speaking.
Minutes 5–10 · Build your effective cost. Per trade, add it up: the spread you crossed + commission in price terms + realised slippage + swap on holds. Average it. Use what your trades actually paid, not the broker's marketing spread. That's the number your backtest has to beat.
Minutes 10–15 · Find the drag. Multiply average cost by your monthly trade count and put it next to your gross P&L. What percentage of the edge did execution eat? Twenty to thirty percent is a design constraint; fifty is fragile; a hundred or more means the strategy may only exist on a frictionless chart. That's not an insult — it's a diagnosis.
Minutes 15–20 · Reconcile against the backtest. Compare your live, measured cost to the cost the test assumed. If it ran on a fixed one-pip spread and you're paying two-and-a-half effective, the report isn't describing your reality — so don't optimise the signal until you know the tax, or you're polishing a leak while the boat sinks. If you can't state your real cost per trade, you don't have an edge — you have a hope with a chart.
VIII — How a system fights the tax
You can't make the market stop charging spread. You can build so it takes less of you — and the best defences aren't glamorous, which is why they work.
- Trade less. Turnover is the multiplier, and it's the input you fully control. Most systems don't need more trades; they need fewer marginal ones. A filter that removes weak entries can lift net results even as it lowers gross opportunity.
- Guard the spread. A system should know the spread before it acts and stand aside when it's blown out. It sounds basic; plenty of systems optimise the entry and ignore the price of entry — like designing a delivery business and forgetting fuel.
- Respect the clock. News, rollover, opens and thin liquidity aren't normal market time; they're different execution environments. Trade them on purpose or avoid them on purpose — just don't wander in because the backtest averaged the cost away.
- Choose order type deliberately. Market orders pay immediacy; limits risk adverse selection; stops become market orders when triggered. There's no free option — only a trade-off you should make on purpose.
- Model cost pessimistically. Don't test against the brochure; test against the bill — variable spread, explicit commission, stress slippage, swap, bad windows left in. A system that only survives polite assumptions is already negotiating with the future — and the future is a terrible negotiator.
That last principle is exactly why MTR is tested the way it is — and here we'll be plain about both sides.
What can be inspected. MTR ships as MT5 source. Its published reference test is an approximately 29-month MT5 generated-tick backtest, not a result from the separate Rust simulator. The product page distinguishes the reference, execution-delay experiments and independent monthly tests. Read each run's settings, costs and drawdown limits; they are not interchangeable evidence of live execution. With the source and suitable data, you can test your own stated spread, commission, swap and execution assumptions.
What this does not establish. A generated-tick test does not guarantee that your venue's fills, spread or financing match its assumptions, and the reference is not established out-of-sample or live performance. Balance drawdown also does not measure the worst floating-equity loss. The editorial evidence note explains why provenance and modelling limits matter. You can't stress-test a promise. You can stress-test code. Treat a different cost assumption as another test to inspect, not proof that future execution will cooperate.
Disclosure: nobody's broker is paying us to write this
We don't care whether you trade MTR, another system, or nothing at all. We care about one thing: stop trading gross of cost.
A backtest's profit is gross until proven net. A win rate says nothing about whether the average win clears the average tax. A tight headline spread is a marketing number until you measure what your own trades actually paid. The most valuable hour you spend this month probably isn't tuning an entry — it's calculating the cost every entry has to overcome. Do that honestly, and half the "edges" you were chasing disqualify themselves for free. That's not bad news. That's saved money.
Your first 20 minutes with MTR
If you do get it, don't start with the profit curve. Start with the cost.
Minutes 0–5 · Read how it handles cost. Open the source and find the spread checks, the cost handling, the places it stands aside. A strategy's character is as much in what it refuses to trade as in what it takes.
Minutes 5–10 · Re-run it on your broker. Use your symbol, your spread behaviour, your commission and swap. Reproduce the baseline before you change anything — on numbers that are true for you. If you can't reproduce it, you're not optimising, you're debugging fog.
Minutes 10–15 · Stress the tax. Widen the spread, add stress slippage, turn on the rollover and news windows — one variable at a time. You're not trying to make it look good; you're finding the cost at which it stops being good.
Minutes 15–20 · Decide what it earned. If it only survives on a frictionless chart, good — you learned that for $49 instead of a blown account. If it survives pessimistic costs, it has earned a small forward test: strict abort rules, no hero size, no emotional overrides. That's how serious traders use tools — not as magic, as machines.
One last thing
If this saved you from one strategy that only ever worked gross of cost, it did its job. Send it to the trader about to scale a system they've never costed.
Spread is a tax you can't see — so measure it, or it will measure you. The price on the chart was never the price. Trade the one you'll actually get.