Someone in our thread about an open-source liquidity sweep tool put it in one line.
Finding the liquidity is easy. Getting the entries and exits right is where the gold is.
They were right, and it stung, because every liquidity tool we had seen stopped at the easy part.
Pools drawn. Sweeps tagged. Then a shrug where the trade should be.
So we built the other half: a stop that sits where the idea is actually wrong, two targets drawn every time, a confirmation you can check on the chart.
Then we did the part that decides whether any of it is worth your chart. We ran the whole sequence with costs on, on two markets, and let every switch fail in public.
One confirmation model held on both markets. The other one lost on bitcoin. Every "smarter" entry paid less.
That is the article. The numbers are below, the seven bugs we found on the way included.
Two requests before we start:
- Save this before you pay for the next liquidity indicator that only draws the pools.
- Send it to the friend who takes every sweep and never asks what confirms it.
Skip this if you already distrust drawn pools
The 60-second version. We built a liquidity-sweep engine that goes all the way to the exit, and a strategy twin of it with a 0.02% commission per order and five ticks of slippage. We ran the twin on gold and bitcoin 15-minute charts from June 1 to September 3, 2026, one run per variant, in-sample.
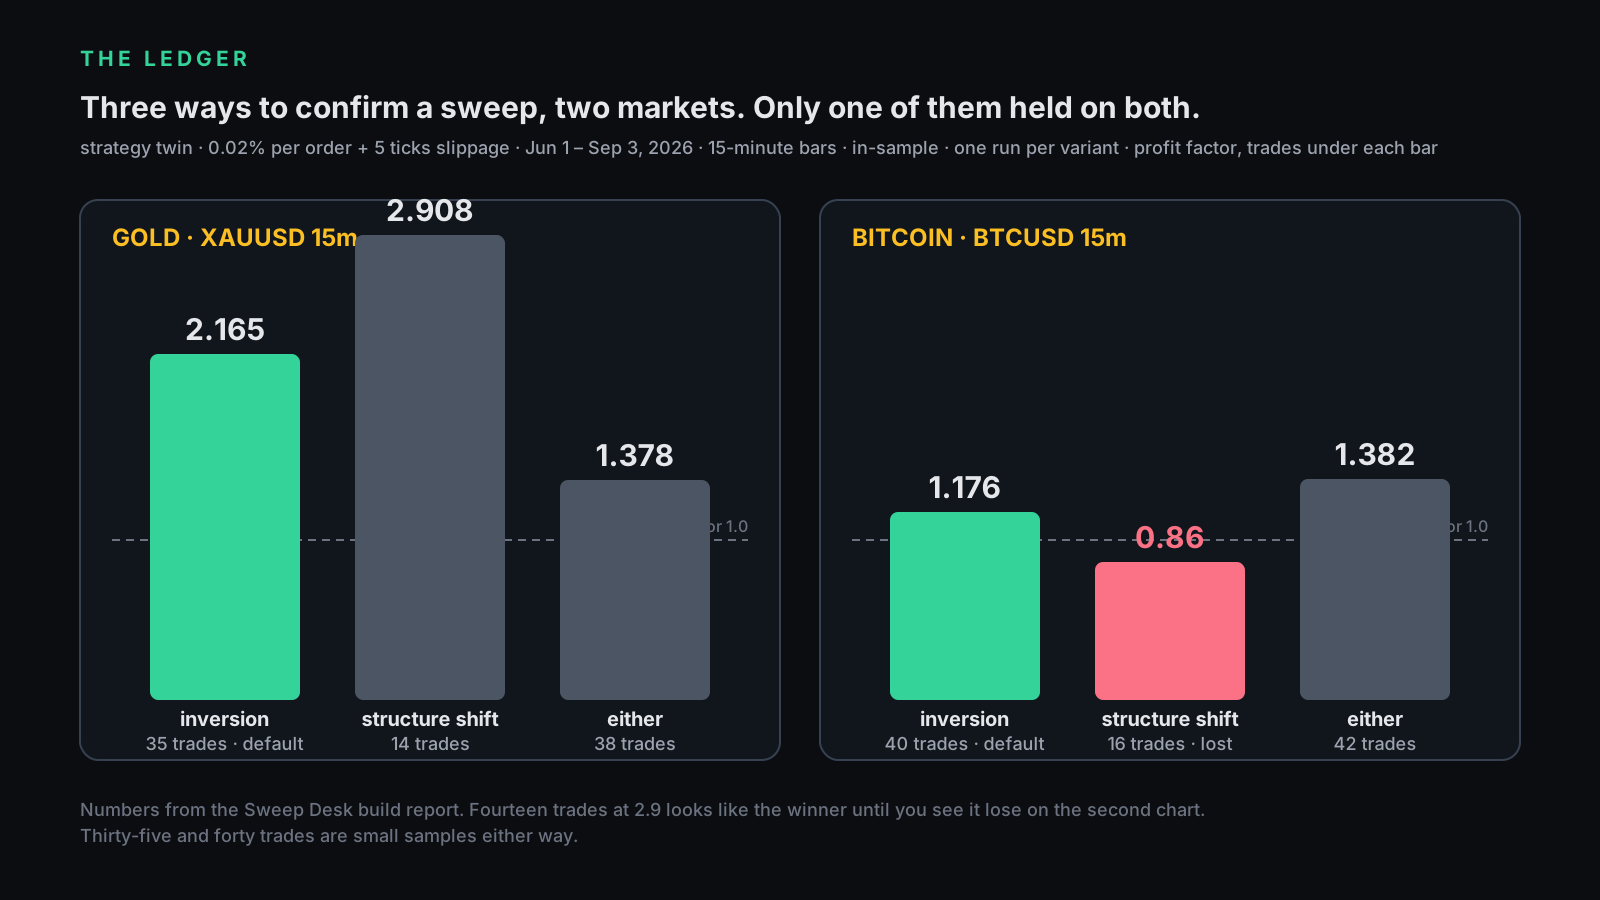
With the inversion confirmation and a close-inside entry, gold took 35 trades at a profit factor of 2.17, and bitcoin took 40 at 1.18. With the structure-shift confirmation alone, gold looked better (14 trades, 2.91) and bitcoin lost (16 trades, 0.86). Every limit entry filled more often and paid less. Using the liquidity pool as the final target cut the winners short on both charts.
We shipped the inversion, the close-inside entry and the three-rung R ladder as the default, and left every alternative in the settings with its number in the tooltip.
| What the liquidity tool implies | What we measured |
|---|---|
| The sweep is the signal | On gold, 286 raids became 35 trades. The sweep is where the work starts. |
| A structure shift confirms the reversal | It did on gold and lost on bitcoin. The inverted gap held on both. |
| A limit at the gap edge gets you in early | It got us in more often, and paid less every time. |
| Target the next pool, that's where price goes | On both charts it closed winners early. The 3R rung paid more. |
| The tester number is the number | Our tester silently ate its own exit once and booked a gap as a win once. Read §III. |
I. What the thread actually asked for
Our own post on r/pinescript promised an open-source rebuild of a paid liquidity indicator, and the replies told us what was missing from the paid one. The stop anchored to the structural invalidation, not an ATR guess. Both target logics, the fixed R ladder and the opposing pool. Clear alerts for the entry and each target. Nothing that repaints.
One reply named the specific model to beat: the inverted fair value gap. A gap printed before the raid, closed through after it, becomes the zone. That sentence is the whole v1.1 release, and it is why this article has two confirmation models instead of one.
Skip §II if you have read the desk page. It is the design, not the finding.
II. The sequence we built
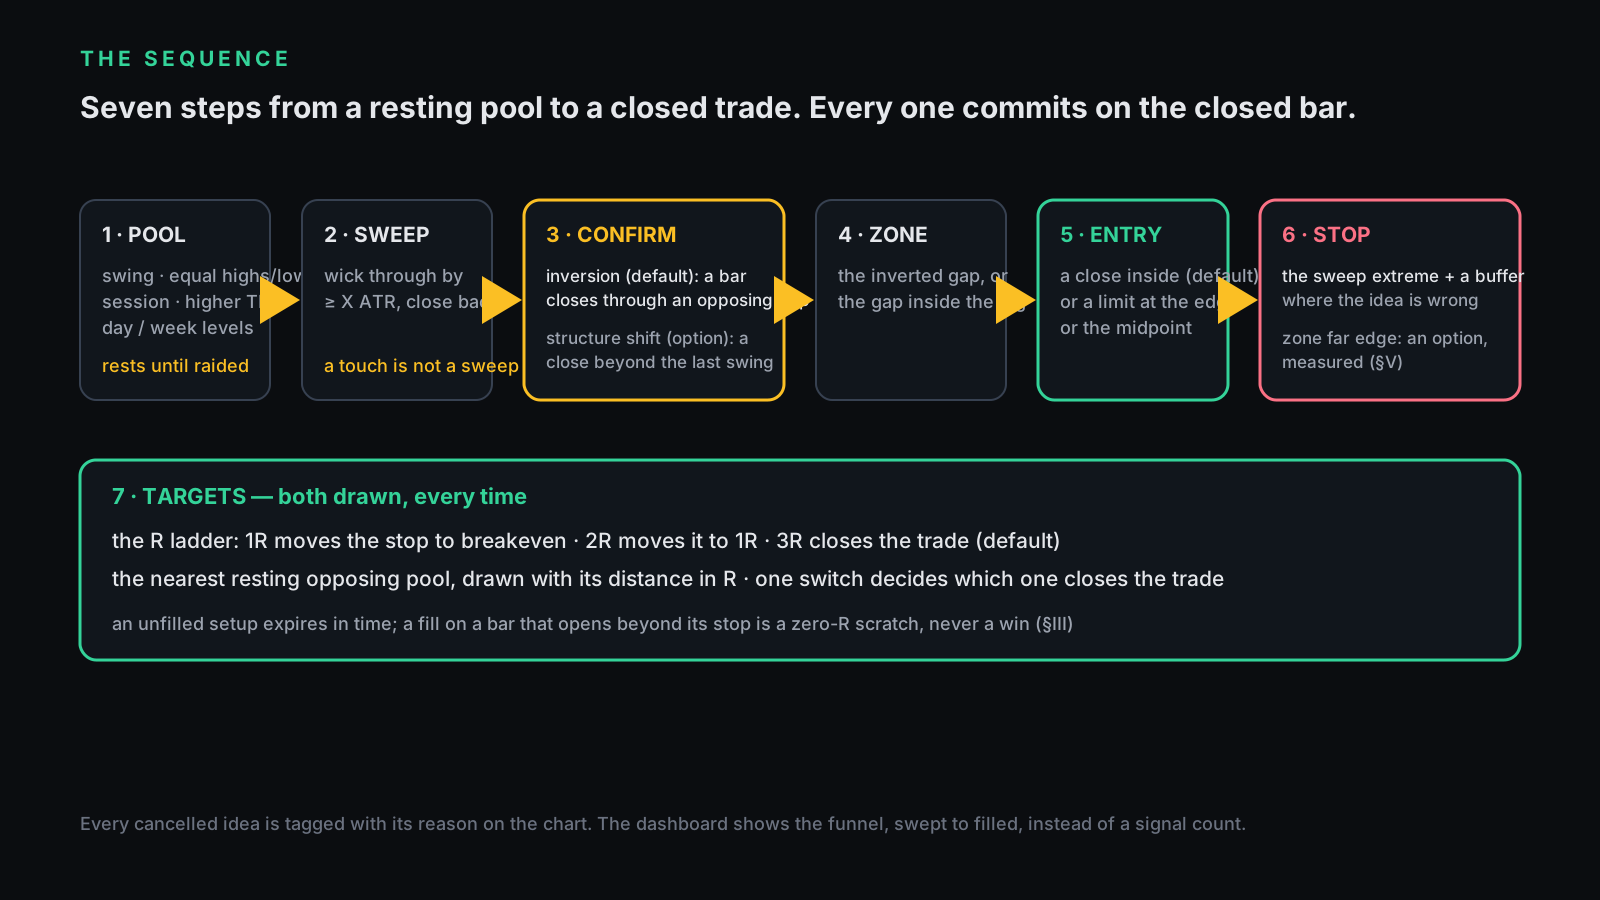
Every setup walks the same seven steps, and every step commits on the closed bar.
A pool is resting liquidity: a confirmed swing, equal highs or lows merged into one, the high or low of one of the ICT killzones, a higher-timeframe swing, the previous day or week level. A sweep is a bar that wicks through a pool by a minimum distance in ATR and closes back on the pool's side. A touch is not a sweep. The full definition, and five checks that tell a sweep from a breakout on any chart, are in What is a liquidity sweep?
In ICT's AMD (power of 3), the day's fake move is a sweep like these; Sweep Desk marks the sweep, not the day.
ICT's Judas swing is a sweep of the Asian range before 05:00 New York. Sweep Desk doesn't track the Asian range, so it can't mark one.
It can ask a second market to agree. Its "Require paired-market SMT" switch, off by default, wants an SMT divergence first: a new low (or high) of the last 10 candles on your chart that the other market didn't make. This page doesn't test it.
A daily candle that sweeps the previous day's high or low and closes back inside that day's range is candle range theory (CRT). Sweep Desk decides on the chart's candle, not the daily close, so it marks the sweep, not the CRT.
A daily raid of the lowest low of the last 20 sessions, one made at least four sessions before, bought back on a stop order the same day, is turtle soup. Sweep Desk has no 20-day level: on a daily chart it marks such a raid only when the old low is also one of its confirmed swings, and only at the close.
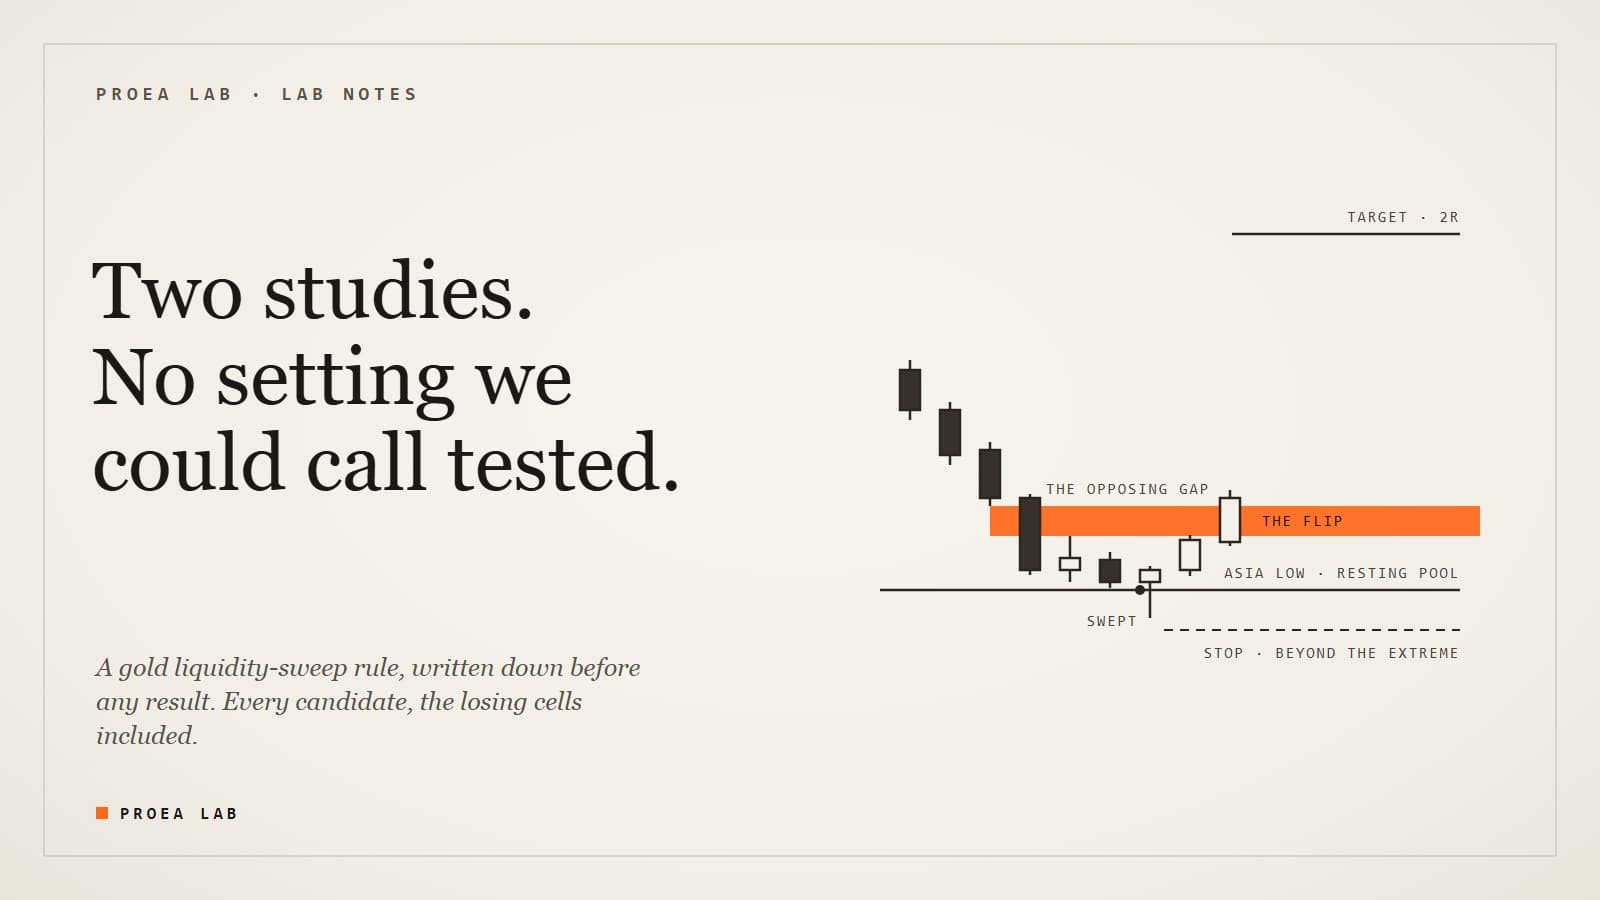
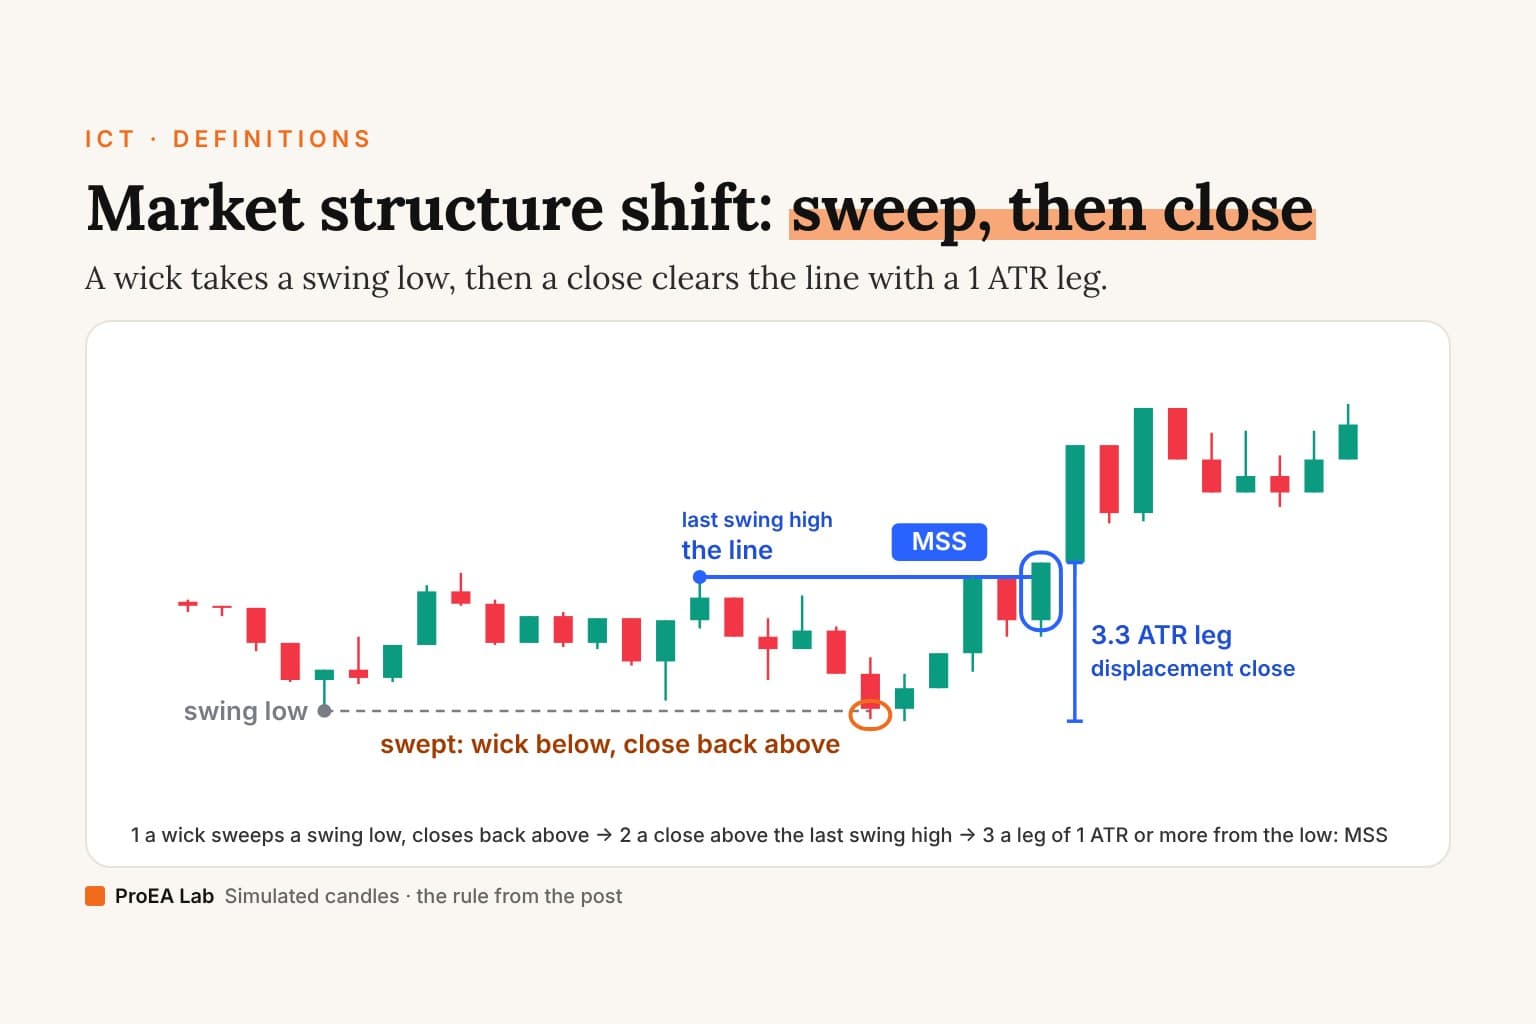
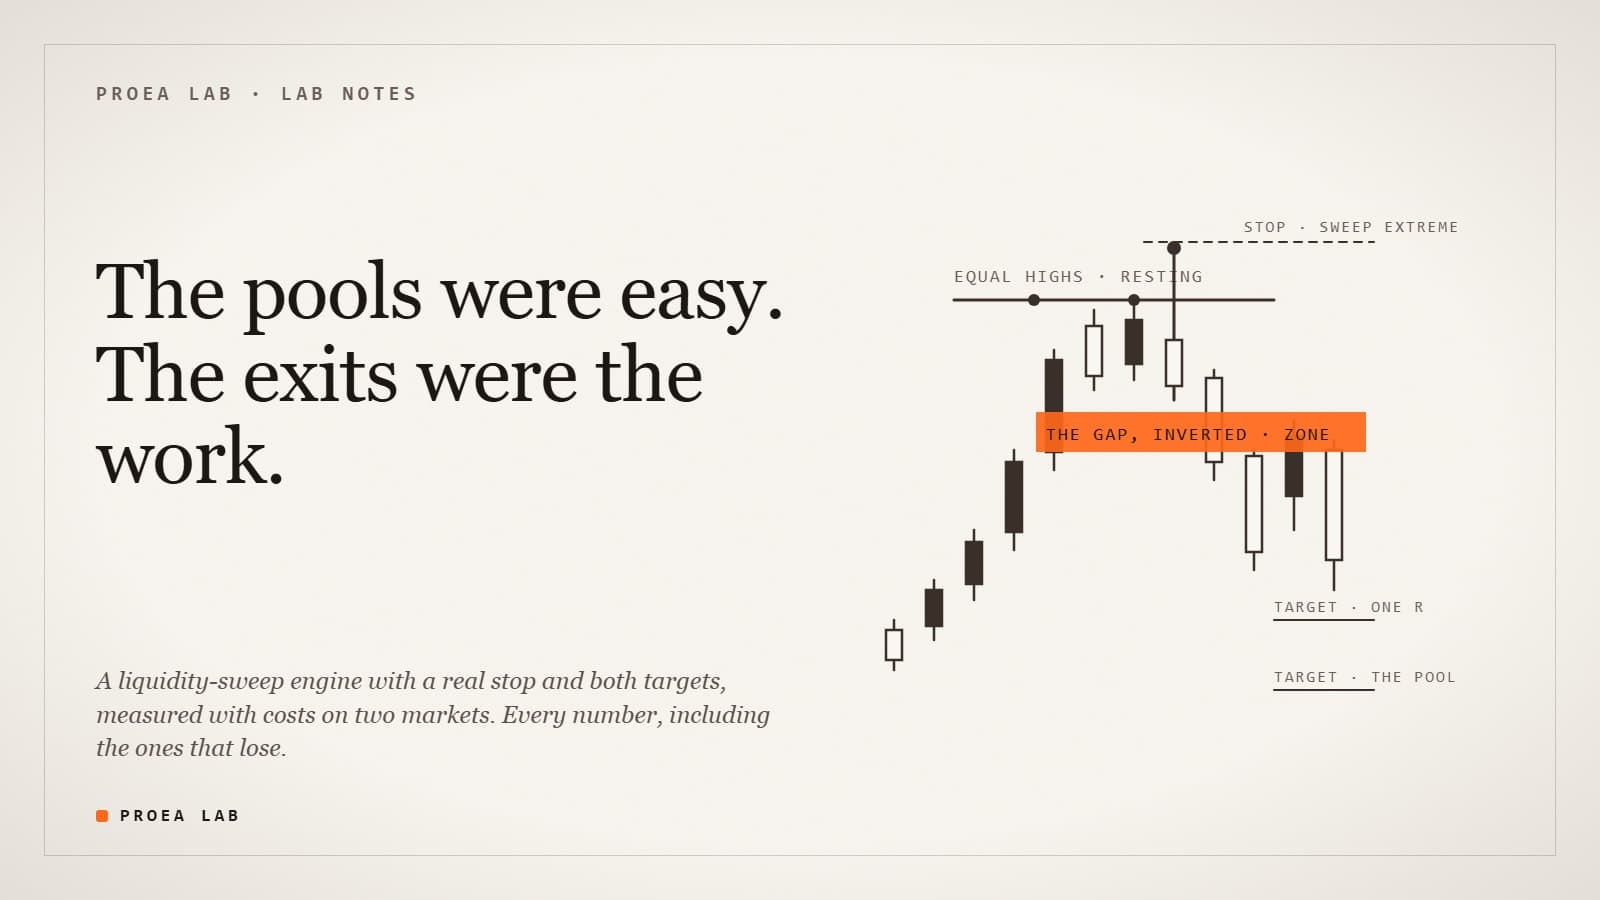
Then the confirmation, within a set number of bars. The inversion model: a bar closes through an opposing gap printed near the raid, so the gap flips and becomes the zone. The structure-shift model: a close beyond the last opposing swing, with a leg long enough to be a push rather than a drift, and the imbalance inside that leg is the zone.
The entry is a close inside the zone by default, or a resting limit at the zone's edge or midpoint. The stop is the sweep extreme plus a buffer. The targets are a fixed ladder at one, two and three R, and the nearest resting opposing pool, both drawn every time with their distance in R.
Run it yourself. Sweep Desk ships with its full Pine source in Pine Pro Library, and the strategy twin we measured with is the second file in the same download. See Sweep Desk in Pine Pro Library →
III. The measuring stick, and the seven bugs it found
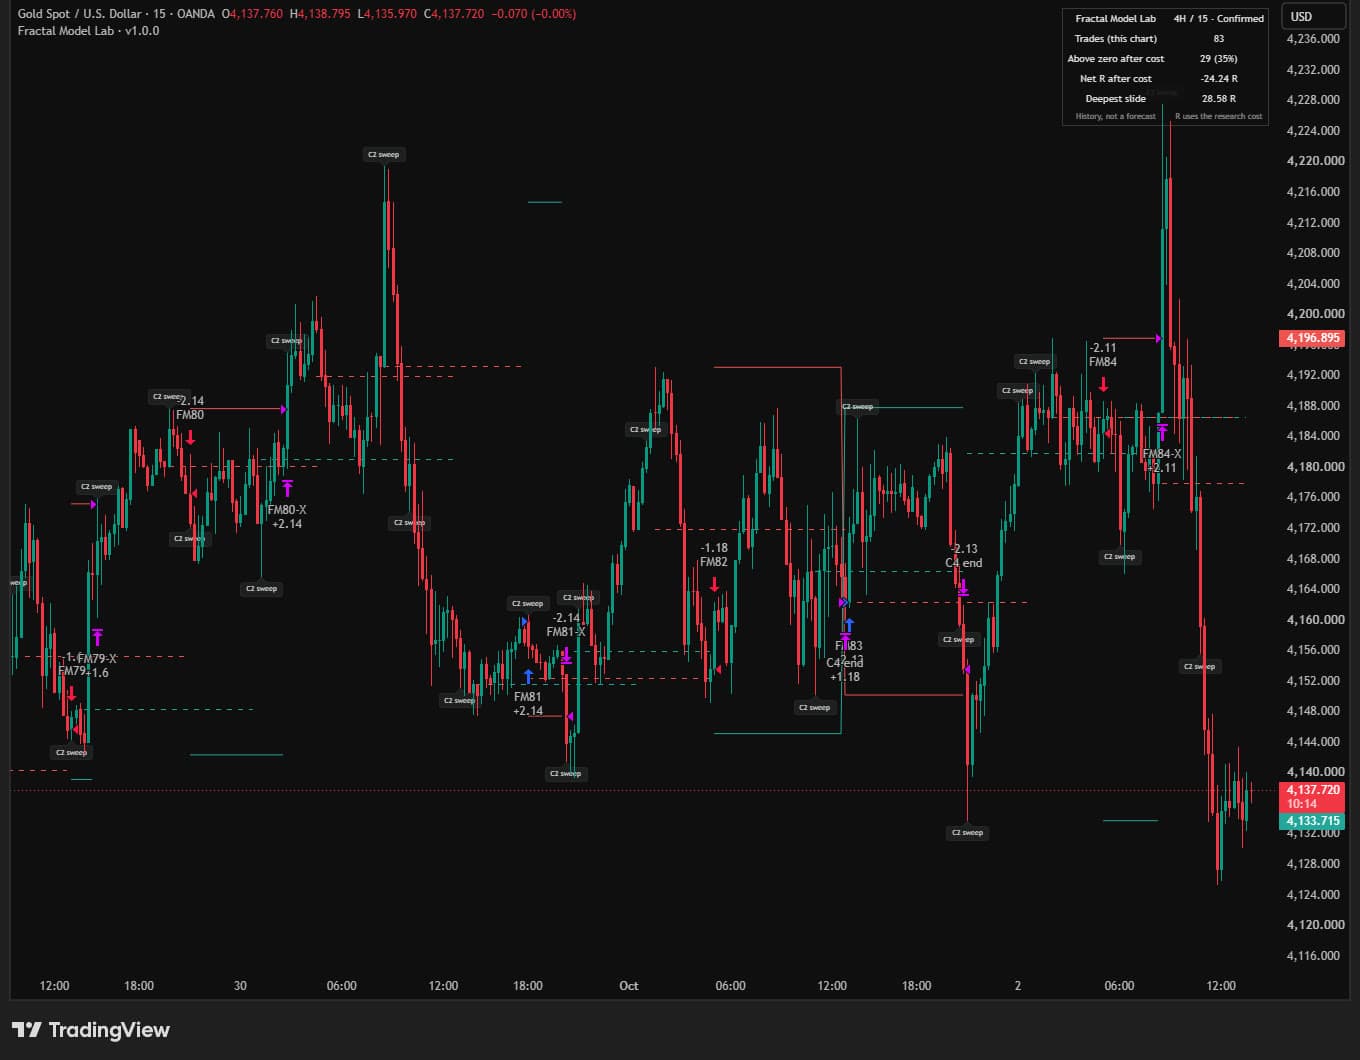
Answer first: the indicator keeps a paper ledger with no costs, so we generated a second file, the strategy twin, from the same source and ran it through the Strategy Tester with 0.02% per order and five ticks of slippage. Building it found seven bugs, two of which would have flattered the numbers.
The worst one flattered us by hiding a loss. The twin cancelled all pending orders after closing a position in the same bar, and Pine cancels the closing market order too. One short filled on a Monday gap, the ledger closed it the same bar, the tester's close was cancelled, and the position rode for twenty-five days at minus 528 dollars. The fix is to cancel first, then close, plus a guard that flattens any position the ledger does not know about.
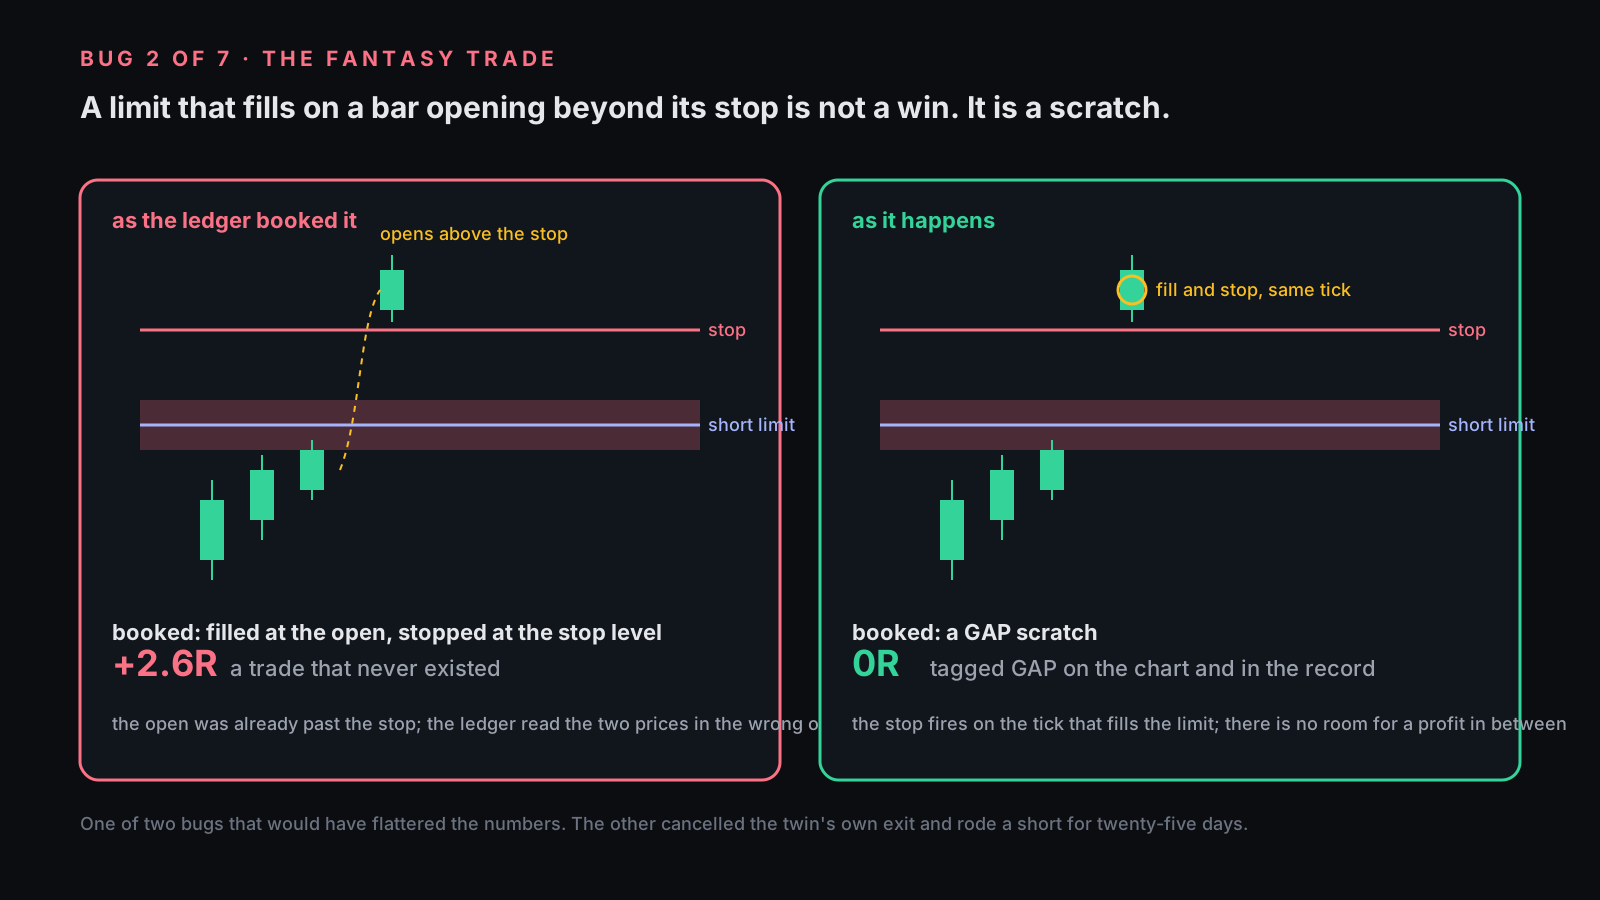
The second one flattered us by inventing a win. A resting short limit filled at a gap-up open above its own stop, and the ledger booked the fill at the open and the stop at the stop level, a plus 2.6R trade that never existed. A limit that fills on a bar opening beyond its stop is now a zero-R scratch, because the stop fires on the same tick.
The other five were plain engineering. Pine's reverse loop runs once on an empty array, which crashed the bitcoin run at bar thirteen. A pool line drawn thousands of bars back hit the drawing buffer. An old pool with an extended line stretched the chart's auto-scale by five hundred dollars. Refreshing every pool line on every bar pushed the twin past the Basic plan's runtime limit. And Ctrl+Enter in the editor quietly replaces whichever study the tab is linked to, so every number here came from a remove-and-re-add.
Skip the rest of this section if you have never trusted a tester blindly. The point is that the measuring stick had to survive its own audit before it measured anything.
IV. Two confirmations, two markets
Answer first: with the close-inside entry and the 3R final target, the inversion confirmation was the only one positive on both charts. Gold: 35 trades, 34.3% profitable, profit factor 2.165, net plus 293 per ounce, max drawdown 159. Bitcoin: 40 trades, 37.5%, profit factor 1.176, net plus 2,464 per coin, drawdown 3,034.
The structure shift on its own was the stronger model on gold and a losing one on bitcoin. Gold: 14 trades, 42.9%, profit factor 2.908, plus 204. Bitcoin: 16 trades, 18.8%, profit factor 0.86, minus 589.
Letting either model confirm, whichever prints first, traded more and paid less on gold: 38 trades at 1.378. On bitcoin it edged the inversion, 42 trades at 1.382, which is one window's worth of evidence and not a pattern.
Fourteen trades at 2.9 looks like the winner until you see it lose on the second chart. That is the whole reason we tested two.We also kept the v1.0 numbers for the record. The v1.1 engine set to structure shift only reproduces v1.0's shipped result exactly, 14 trades, 2.908, plus 204.45, so the refactor changed nothing in that path. Parity held the other way too: the indicator's paper ledger and the twin closed the same number of trades on both models.
V. Every switch, one at a time
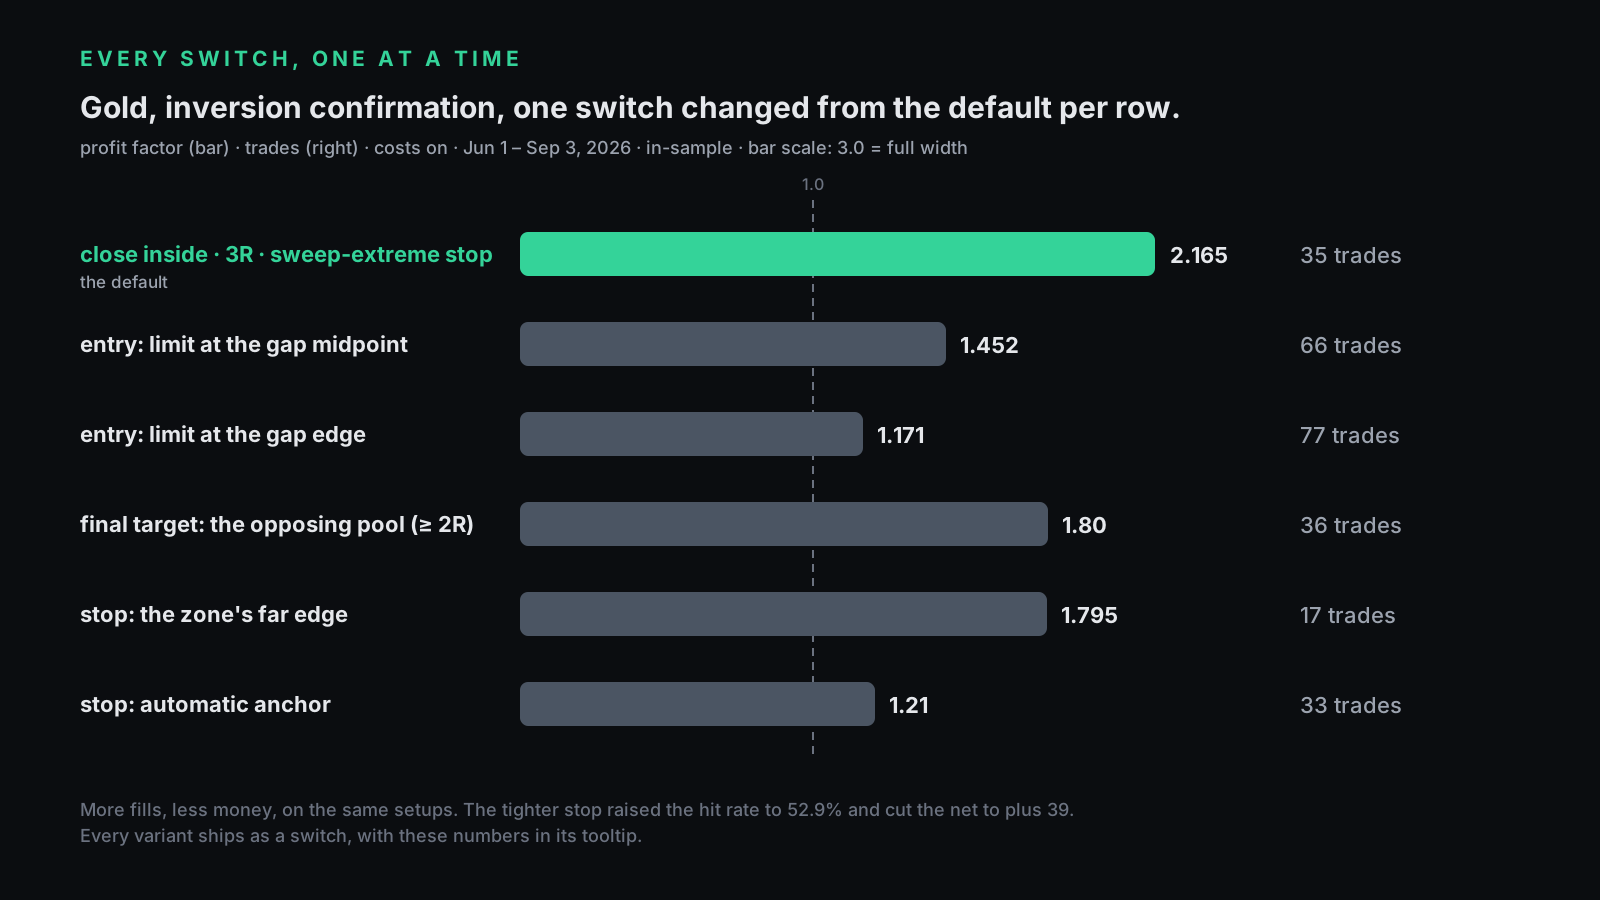
Answer first: the limit entries, the liquidity target, the tighter stop and the extra filters all measured worse than the defaults on gold. They all ship, switched off, with these numbers next to them.
Entries. A limit at the gap's midpoint filled 66 times at a profit factor of 1.452. A limit at the gap's edge filled 77 times at 1.171. The close-inside entry filled 35 times at 2.165. More fills, less money, on the same setups.
Targets. Making the opposing pool the final target instead of the 3R rung gave gold 36 trades at 1.80 and bitcoin 39 trades at 1.007. The pool stays drawn as the magnet, and the rung closes the trade.
Stops. Anchoring the stop at the zone's far edge instead of the sweep extreme raised the hit rate to 52.9% on 17 trades and cut the net to plus 39. An automatic anchor, sweep extreme unless it is more than two and a half ATR away, landed between the two at 1.21.
Filters, from the v1.0 grid with the structure-shift model. Requiring a volume spike on the sweep bar dropped the profit factor to 0.649. Allowing sweeps only inside a killzone gave seven trades at 0.93. Picking the deepest gap in the leg instead of the nearest gave 0.671. Every one of them is a reasonable idea. None of them paid here.
Skip §VI if you never plan to touch the settings. It is the product decision.
VI. What we shipped, and why the default is the boring one
Answer first: Sweep Desk confirms by inversion, enters on a close inside the zone, and closes at the 3R rung, because that is what measured best on one market and least bad on the other. Everything else is a switch with its number in the tooltip.
The dashboard shows the funnel instead of a signal count. On gold with the defaults it read 286 raids, 95 confirmed, 95 armed, 35 filled. The filters do most of the work before any trade exists, which is why a tool that counts "signals" is counting the wrong thing.
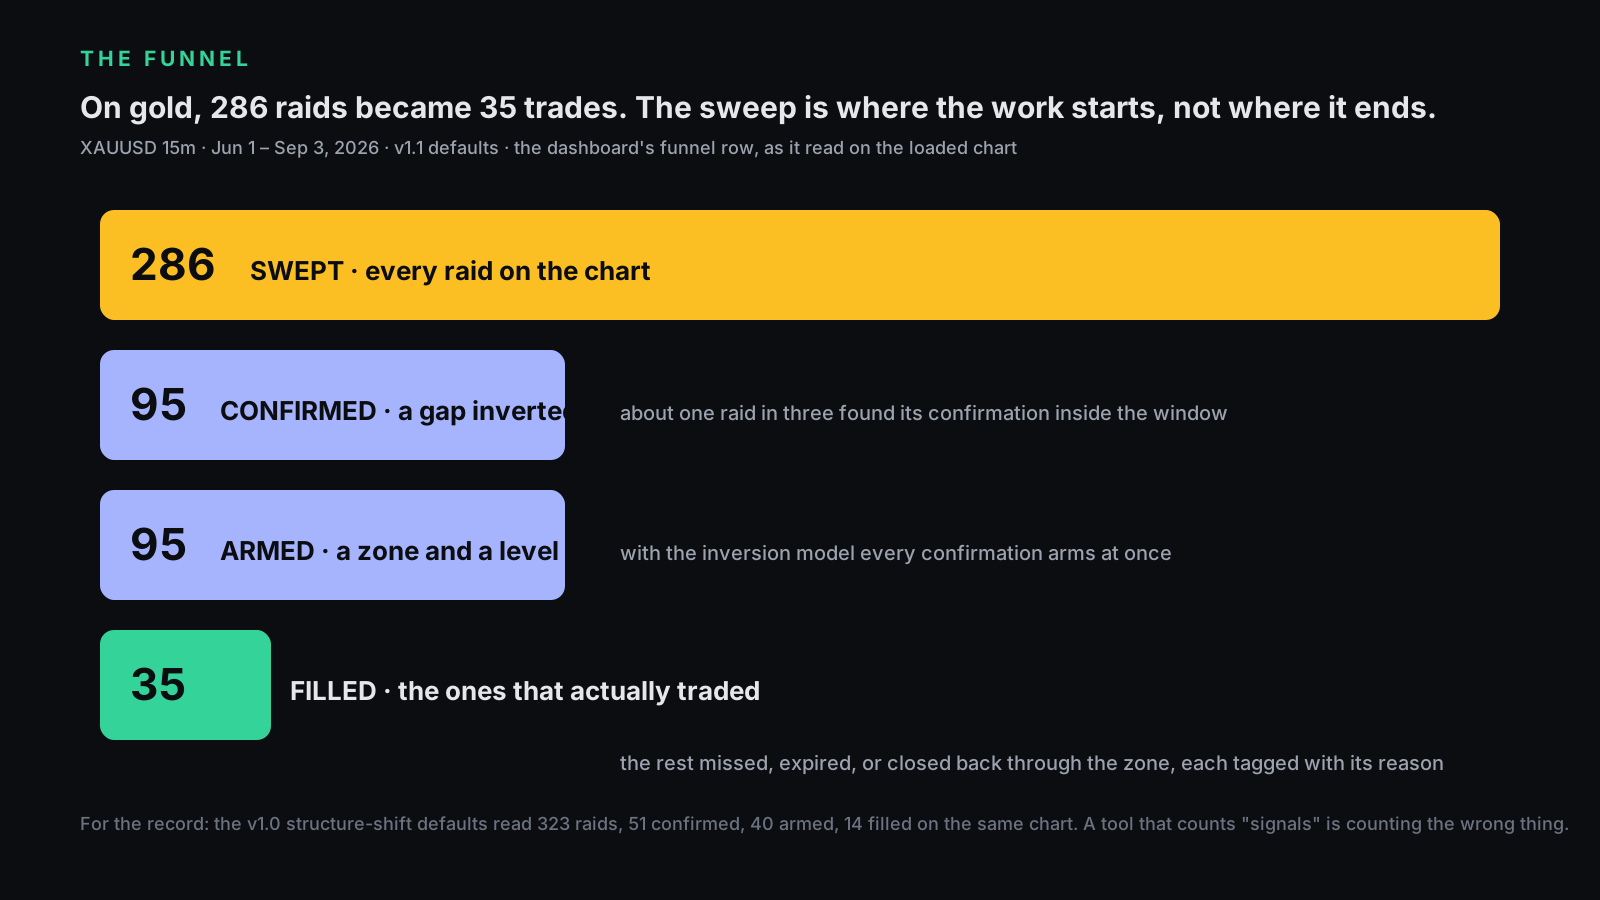
Under the funnel sit the records: closed trades, which kind of pool they came from, and which confirmation model. Every cancelled idea is tagged with its reason on the chart in the Pro view, no shift in time, missed and ran to the first target unfilled, inversion failed, gapped through the stop. A cancelled idea is a count on the funnel, never a silent reset.
The honest ledger:
- Good: the stop is a structural fact. Both targets are drawn every time. The twin runs with costs on from bar one, and it is generated from the indicator, so the two cannot drift apart.
- Unproven: the edge. Thirty-five and forty trades on one window, in-sample, with settings chosen while looking at the chart. Read the numbers as a description of the past on two charts.
- Dangerous if misread: the paper ledger in the indicator. It has no costs and fills at bar extremes. The twin is the measuring stick, and on gap bars even the twin's fills differ from the ledger's; those trades are tagged.
Want the zone scored before the sweep? The SMC AI-Scored Toolkit grades order blocks, imbalances and liquidity by five transparent factors, with the same funnel-and-ledger honesty. Sweep Desk first is the right path; the Toolkit assumes you have run it.
The 20-minute audit for any liquidity tool you rent
Minutes 0–5. Find the stop rule in words. If the stop is an ATR multiple, the tool has an opinion about volatility, not about where the idea is wrong.
Minutes 5–10. Ask what confirms the sweep. If the answer is "the sweep", the tool sells the easy half.
Minutes 10–15. Count the funnel. Take a month of the tool's sweeps and count how many became a trade with a stop and a target. If it cannot tell you, it does not know either.
Minutes 15–20. Check the tester it ships with, if it ships one. Set commission and slippage to your broker's, then find one gap bar and read how the fill was booked.
Disclosure
We build and sell indicators, this one included: Sweep Desk is part of Pine Pro Library. We publish its losing market because an engine that shows its own failures is the pitch for every tool we charge for. Nothing above is advice, and the numbers are two symbols, one window, measured by us, not validated out of sample. A later rule for gold, Gold Sweep Desk, was tested with its plan written before any result, and found no validated edge.
The one question to ask any liquidity seller: what confirms the sweep, and what did that confirmation do on the chart you did not show me?
A pool without an exit plan is a drawing. An exit plan without a measuring stick is a story.