Every trading ad knows the trick.
"95% win rate." "9 winners out of 10." "Only one loss this week." It feels like proof — like skill you can count, like safety.
That's why it sells.
And that's exactly why it's dangerous.
A win rate answers one small question: how often did the system close green? It says nothing about the questions that decide whether the account survives — how much you made when you won, how much you lost when you lost, how big the worst loss was, how much it cost to trade, and how many small wins one large loss erased. Leave those out and a win rate becomes a magic trick: the number is real, but the conclusion isn't.
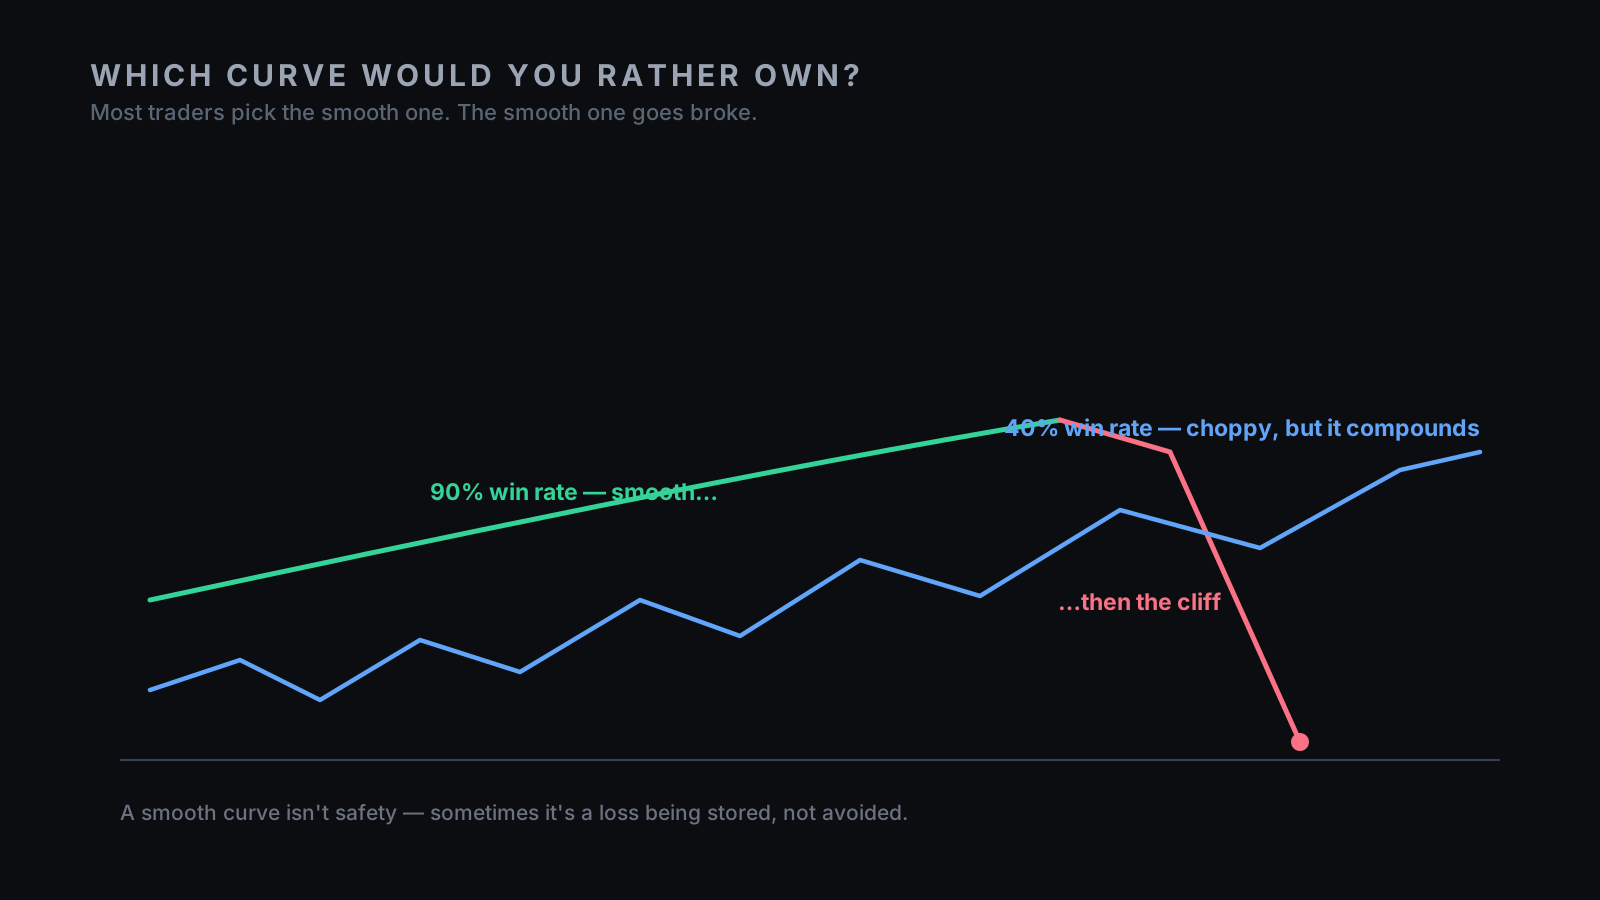
A strategy can win 90% of the time and lose money. Another can lose 60% of the time and compound for years. The account doesn't care how often you were right. It cares how much you made when right, how much you lost when wrong, and whether the bad stretch arrived before you had the cushion to survive it. That's the difference between comfort and edge — and this whole piece is about telling them apart.
Before we start, two requests:
- Save this before you buy your next "high win rate" EA.
- Send it to the trader bragging about a 9-for-10 week.
Not because winning often is bad. Because winning often is not the same as winning — and the gap between them is where accounts die.
Skip this if you already trade by expectancy, not win rate
Win rate tells you how often a system wins. It does not tell you whether the system has an edge — that needs the size of the wins, the size of the losses, the costs, and the shape of the tail.
| The number they sell | The number that matters |
|---|---|
| Win rate | Expectancy, after costs |
| "95% winners" | Average win versus average loss |
| "Only one red trade" | Whether one red trade erases the green ones |
| A smooth balance curve | The equity drawdown and the hidden risk |
| Many small wins | The tail loss, the skew, and survival |
| Gross performance | Net, after spread, slippage, and commission |
A high win rate isn't a lie. It's an incomplete sentence — and the missing half is the part that decides the account.
I — Win rate is a comfort metric
Win rate is seductive because it feels like being right, and being right feels like skill. Nine green trades in a row builds a powerful story: I understand the market. Maybe you do. Maybe you don't — because a high win rate can come from a genuine edge, or it can come from pure trade design.
Set a tiny take-profit and a very large stop, and most trades close green. Delay losses long enough and the balance curve looks calm. Average down and many entries eventually recover. Sell risk repeatedly and you collect small wins for a long time. None of that proves an edge — it proves the system was shaped to realise small gains often and recognise larger pain rarely. That shape can be profitable, or it can be a trap, and the win rate doesn't tell you which. A win rate is a measure of frequency — not of quality, payout, survivability, or edge. So the question was never "how often does it win?" It's "what is the price of the losses that make that win rate possible?"
II — The 90% win rate that goes broke
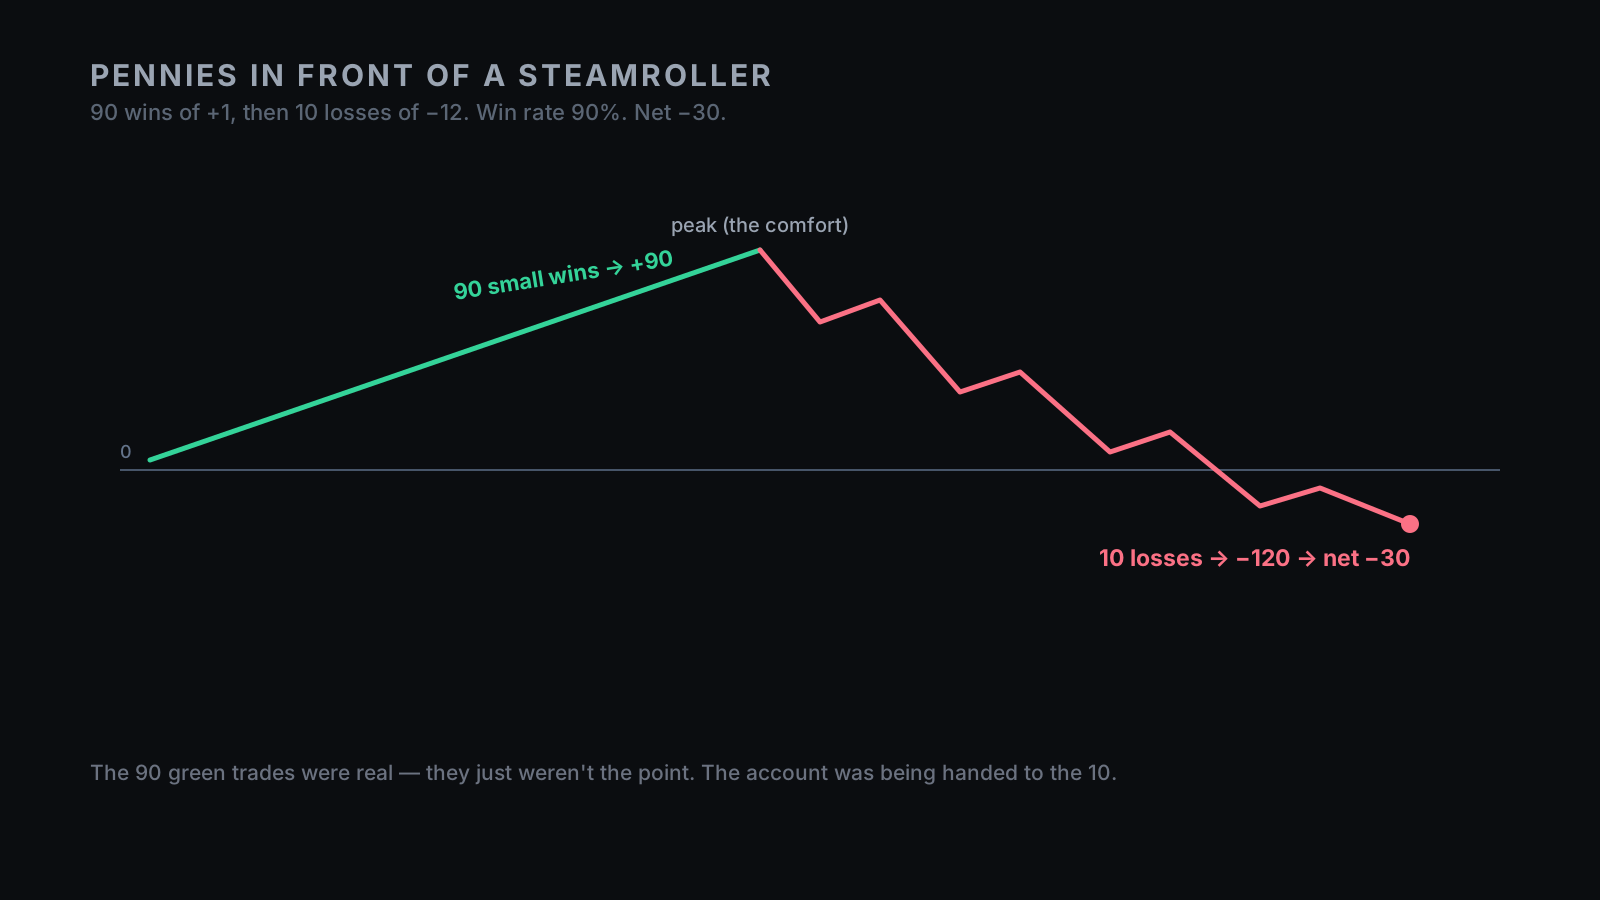
Here's the machine: it wins small, wins often, makes you feel safe — then one loss arrives large enough to erase the comfort. You see the profile everywhere: grids that average down, martingales that add size after pain, mean-reversion with no real stop, short-volatility strategies, scalpers with tiny targets and wide emergency exits — systems that snatch winners quickly and let losers negotiate with gravity. They pick up pennies in front of a steamroller.
Picture it with round numbers (illustrative, not a claim). A system takes 100 trades. Ninety win +1 → +90. Ten lose, but they don't lose 1 — with no real stop they lose −12 each → −120. Win rate: 90%. Net: −30. Most traders stop reading at "90%." They shouldn't: the ninety green trades were real, they just weren't the point. The account was never being built by the wins; it was being slowly handed to the losses you were trained not to look at.
This is why the smoothest curve can be the most dangerous one. Sometimes smooth means stable; sometimes it means risk is being stored instead of closed (the hidden-drawdown problem from Backtest Isn't Reality). Delayed loss is still loss — it just has better manners. In a negative-skew system, the 10% isn't 10% of the story. It's the whole account, on a timer.
III — Expectancy is the number that pays
One equation settles it. Expectancy is the average a strategy makes or loses per trade, given its win rate and payoff profile:
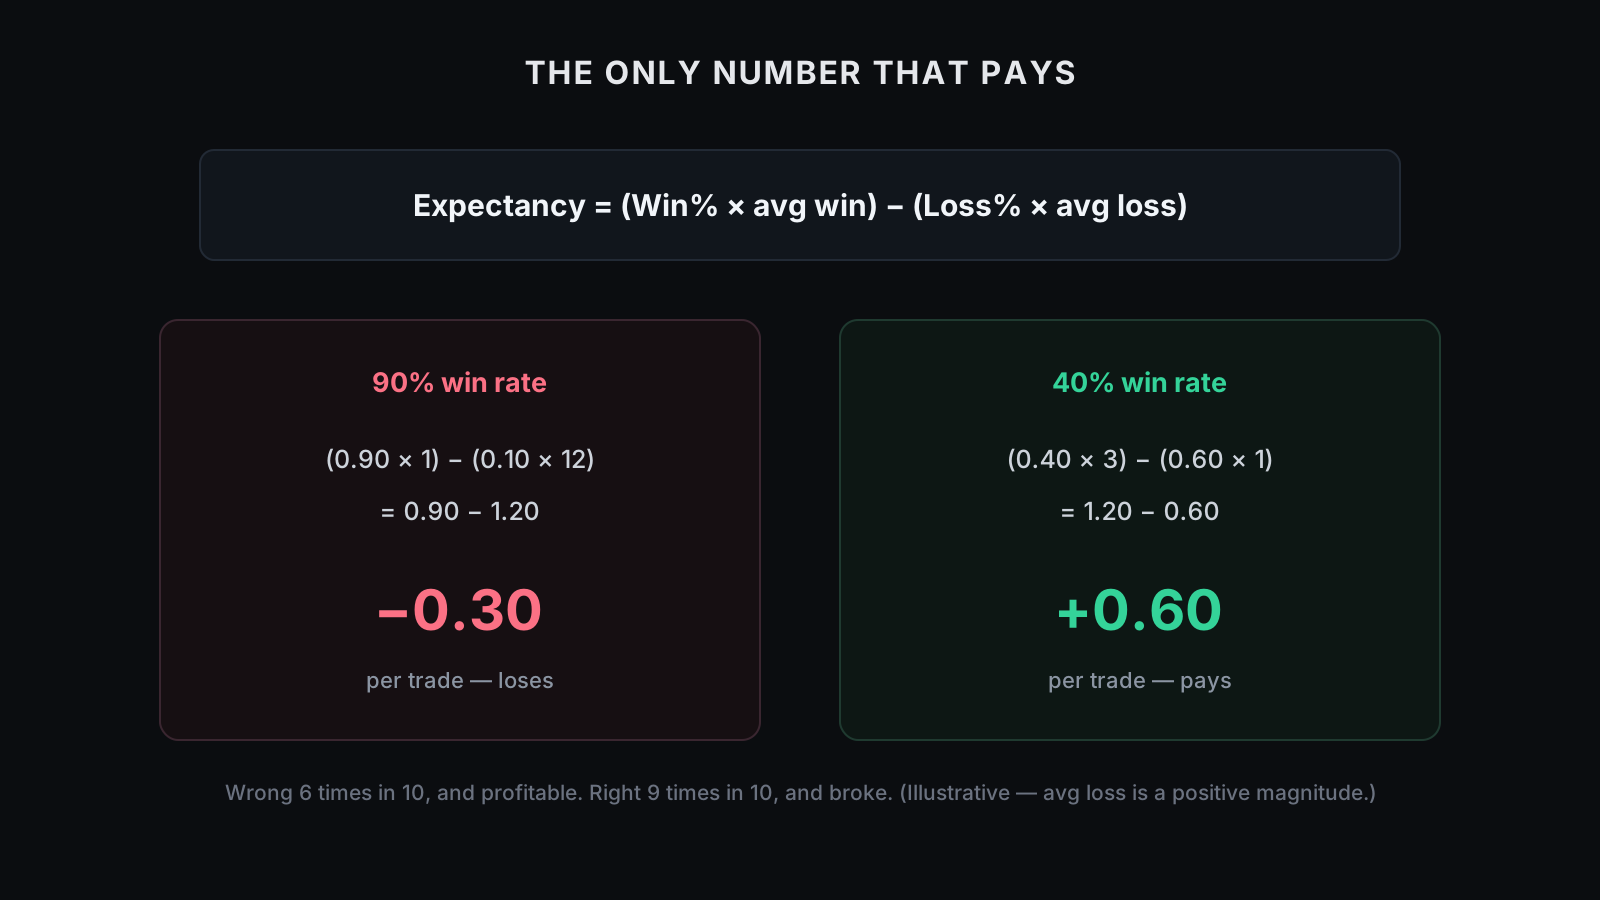
Expectancy = (Win% × average win) − (Loss% × average loss) — with average loss as a positive magnitude (if the average loser loses 12, you put in 12).
Run the steamroller: (0.90 × 1) − (0.10 × 12) = 0.90 − 1.20 = −0.30 per trade. Under that payoff profile the strategy loses on average even though it wins nine times in ten. Now flip it — a system that wins only 40%, but makes +3 when right and loses −1 when wrong: (0.40 × 3) − (0.60 × 1) = 1.20 − 0.60 = +0.60 per trade. Wrong more often than right, and profitable. Most traders can't stand to hold that profile because it feels bad. The account doesn't pay feelings. It pays expectancy.
Frequency then scales the sign. Positive expectancy × more valid trades compounds the edge; negative expectancy × more trades just accelerates the leak. That's why "more trades" is never automatically better — it depends entirely on what you're multiplying.
IV — Win rate and reward-to-risk are inseparable
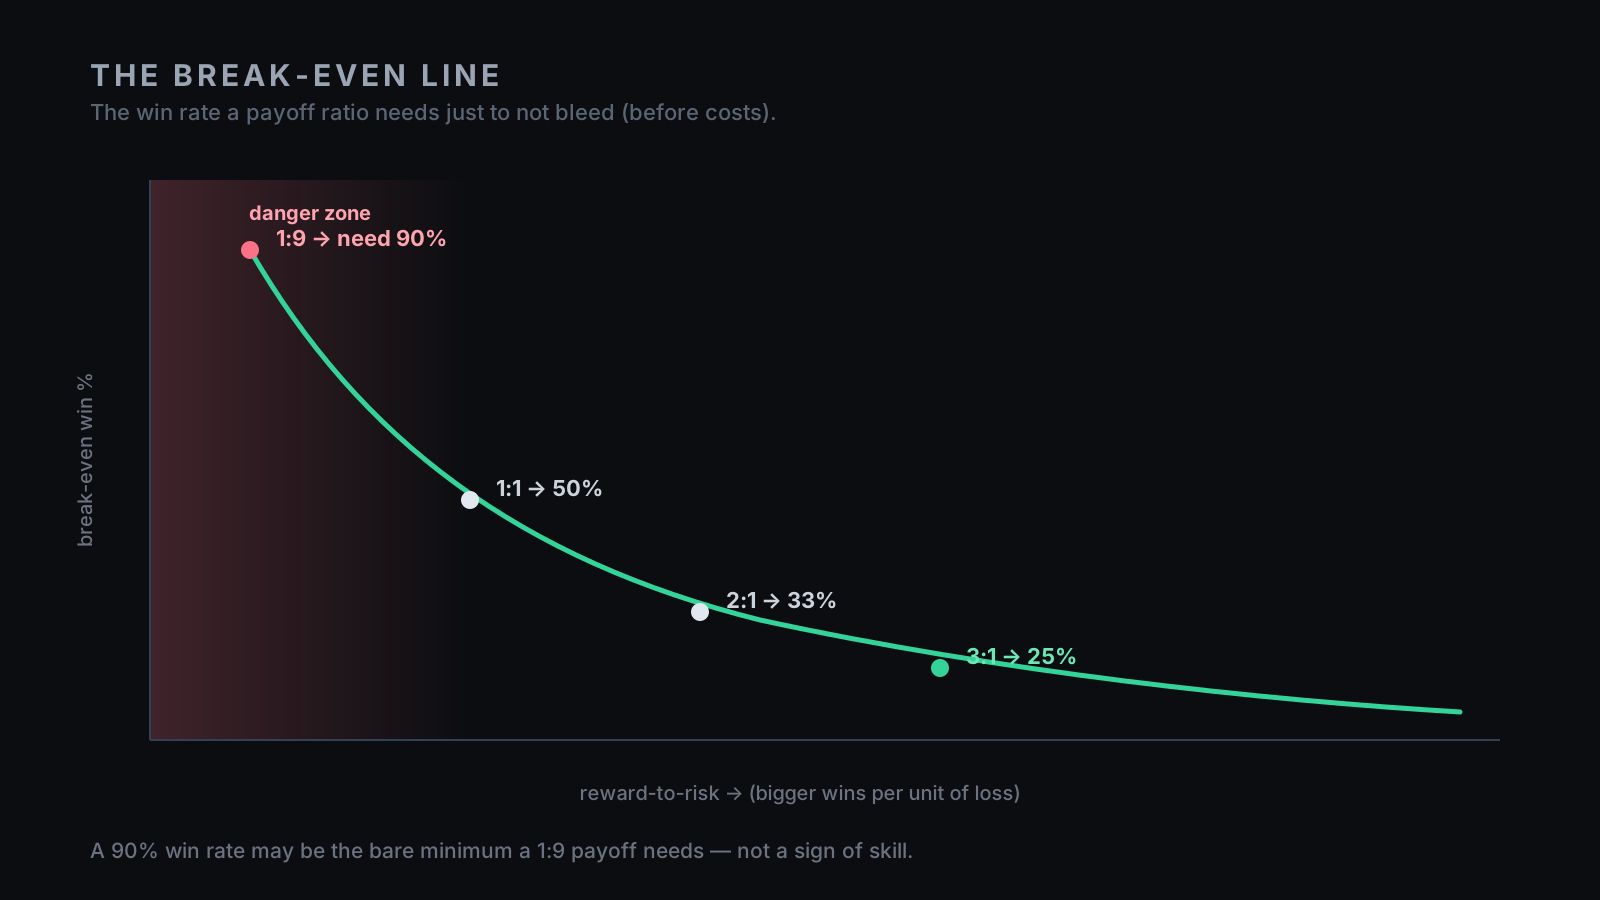
A win rate is only meaningful next to its partner: reward-to-risk — how large the average win is versus the average loss. Together they set a hard break-even line. At 1:1 you must win more than 50% to break even (before costs); at 2:1, more than ~33%; at 3:1, more than 25%. Reverse it and the trap is obvious: if your average loss is nine times your average win, you need to win more than 90% just to tread water — and any slip past that is a loss.
So a 90% win rate isn't impressive on its own — it might be the bare minimum a lopsided payoff needs just to avoid bleeding. You can't know which without the average win and average loss. A seller who quotes a win rate without the reward-to-risk has shown you half an equation, and half an equation isn't evidence — it's marketing. The real question is never "is the win rate high?" (high compared to what?) but "does the win rate clear the break-even line for its payoff profile?" A 40% win rate at 3:1 can be excellent; a 90% win rate at 1:12 can be a machine for turning comfort into drawdown.
V — Skew is the hidden shape of risk
Expectancy tells you the average; skew tells you the shape — and shape matters because traders don't live inside averages, they live through paths.
A negative-skew strategy has many small wins and rare large losses; it feels good most of the time, and that comfort is the danger. A positive-skew strategy has many small losses and rare large wins; it feels bad much of the time, and that discomfort is the opportunity. Humans are pulled toward negative skew — we like frequent confirmation and green days, and we hate small repeated losses even when those losses are the price of waiting for a large winner. The market knows this. Comfort has a price, and that price is usually tail risk. A negative-skew system looks stable until the tail arrives; a positive-skew one looks broken right before it pays.
That's also why no single number can describe a strategy. A positive average expectancy with violent negative skew can still ruin you, because the catastrophic loss can land before the law of averages does (the path matters, not just the mean — the risk-of-ruin point we pick up next). A system isn't its average return; it's how often it wins, how much, how much it loses, how losses cluster, how deep the tail runs, and how much capital it takes to survive the path. A win-rate number was never built to carry any of that.
VI — Costs can flip the sign
Expectancy is gross until you subtract the tax — and the strategies advertising the highest win rates usually have the smallest average wins, which makes them the most sensitive to cost of all (everything in Spread Is a Tax You Can't See, multiplied by frequency).
A scalper can show a high win rate and a thin gross edge — say +0.3 per trade. Then realistic spread, slippage and commission come out of each round-turn at, say, 0.5, and the net expectancy is negative. The win rate doesn't move; the account outcome does. A backtest's win rate usually survives contact with your broker. Its expectancy often doesn't. That's the part the win rate hides: a system that wins often but pays too much to express each trade isn't an edge — it's a fee engine, working for the market, not for you. Which is why high-frequency, high-win-rate systems have to be judged net of cost, before trust, not after.
VII — Risk of ruin still matters
Positive expectancy is necessary. It is not sufficient — and this is the part traders miss right after they learn the equation. They compute expectancy, see a positive number, and assume safety. Not yet. A strategy can have positive expectancy and still be impossible to hold at the size you chose — because the path can ruin you before the average arrives.
If losses are large, clustered, or correlated, position size matters as much as the edge. A positive-expectancy system sized too big can hit a drawdown limit, a margin call, a prop-firm breach, or your own breaking point before the math has time to work. That's risk of ruin in plain words: can the strategy survive long enough for its edge to show up? Win rate doesn't answer it; expectancy alone doesn't fully answer it either. You need the drawdown, the loss clustering, the worst trade, the worst sequence, the position size, and the capital buffer. The market doesn't pay theoretical expectancy to a trader who's already been forced out. Survival is part of the edge.
VIII — The 20-minute edge audit
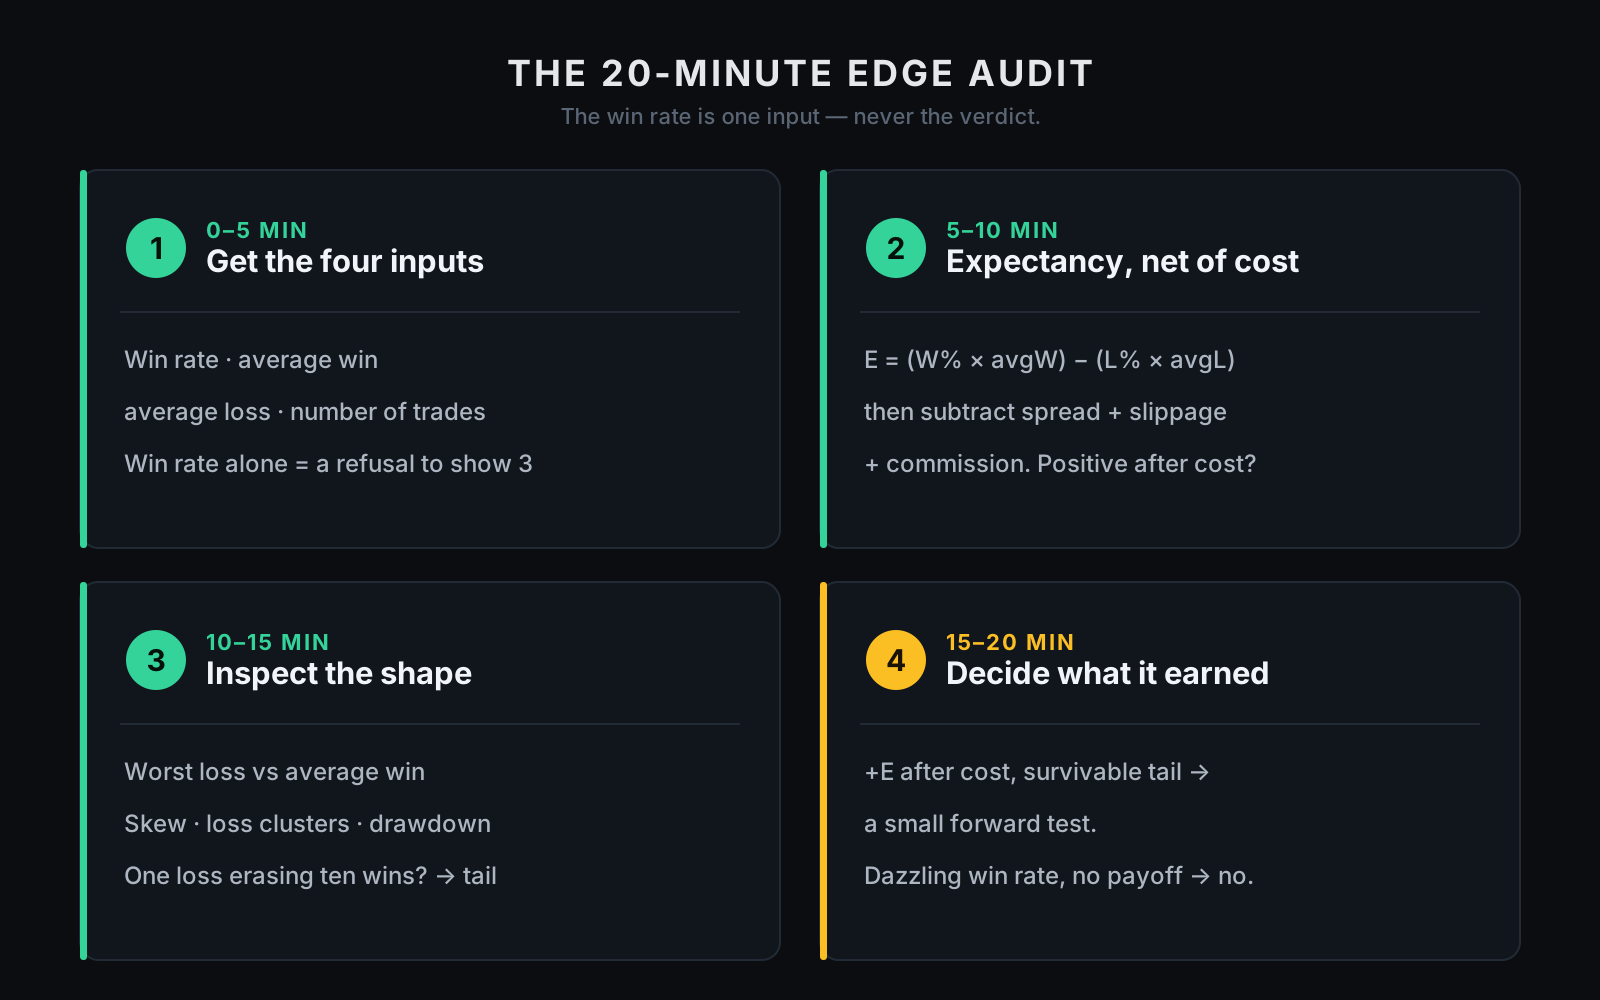
You don't need a PhD to dodge the win-rate trap — four inputs and a little honesty. Run it on your own system, on any EA before you buy, and before you ever believe a 95% headline.
Minutes 0–5 · Get the four inputs. From the trade history: win rate, average win, average loss, number of trades. If someone gives you a win rate but won't show the other three, treat that as the answer — they showed you the flattering part, not the edge.
Minutes 5–10 · Compute expectancy, net of cost. E = (Win% × avg win) − (Loss% × avg loss), then subtract a realistic all-in cost per trade (spread + slippage + commission + swap). If it isn't clearly positive after costs, there's no edge to discuss yet — only a gross idea hoping execution will be kind.
Minutes 10–15 · Inspect the shape, not the average. Find the largest loss, the largest win, the worst losing streak, the worst drawdown, and how many wins one bad loss erases. Do losses cluster in specific sessions, regimes, or news windows? A single large loss isn't automatically fatal — but it has to be sized and known. Hidden tail risk is what kills; known tail risk can be managed.
Minutes 15–20 · Decide what it earned. Positive expectancy after costs, manageable skew, a tail you can survive at your size → it earns a small forward test, not full trust. A dazzling win rate with missing payoff data and one loss that erases weeks of gains hasn't shown an edge — it's shown comfort. And comfort is not a trading plan. It's a countdown with good manners.
Why we publish a grid, not a win-rate headline
Now MTR, plainly. We don't lead with a win-rate headline, and that's deliberate: if we wanted to flatter a system, a win rate is the easiest number to quote — and this entire article is the reason we don't want you judging any system that way. Not ours, not anyone's.
A serious trader should ask for the full shape: expectancy, average win, average loss, drawdown, flat periods, worst trades, cost sensitivity, broker assumptions, and the logic that produced the trades. That's why MTR ships as full MT5 source and a published 28-month KPI grid — the grid shows more than a headline can, and the source lets you recompute the expectancy, test your broker's costs, plot the tail, and decide whether the payoff profile fits your risk. A "95% win rate" is a headline. An expectancy you computed yourself, net of your costs, is an answer — one you can verify instead of believe.
And to be precise about what that does and doesn't mean: a grid is evidence, not prophecy; source is inspectability, not magic. It doesn't prove the future will match the past, that your broker will match our test, or that expectancy will stay stable — it gives you a real thing to interrogate instead of a sales page to trust. That distinction is the whole philosophy.
Disclosure: we don't quote a win rate as the thesis
You won't find us leading with a win-rate promise — now you know why. Win rate is the most flattering number we could show if the goal were to sell comfort; our goal is the opposite. We sell capability, not outcomes: source, grid, and evidence you can inspect. No tool, system, or backtest can promise future results. Past performance is not future performance; every backtest is broker-specific; every expectancy is sample-specific; every live account pays real costs and carries real operational risk.
If a seller leads with a win rate and goes quiet on reward-to-risk, the worst loss, drawdown, costs, and sample size, they haven't shown you an edge. They've shown you the half of the equation that sells.
Your first 20 minutes with the source
If you own a system you can read, the edge audit stops being something you take on faith and becomes something you run.
Minutes 0–5 · Pull the trade list from the published backtest, and read how the code defines a win and a loss — the actual exit logic, not a marketing summary. How does a trade close? A basket? What risk stays open in a bad sequence?
Minutes 5–10 · Compute expectancy on your costs. Drop in your broker's real spread, commission, and slippage, and recompute E per trade. A thin edge that disappears on your broker was never your edge.
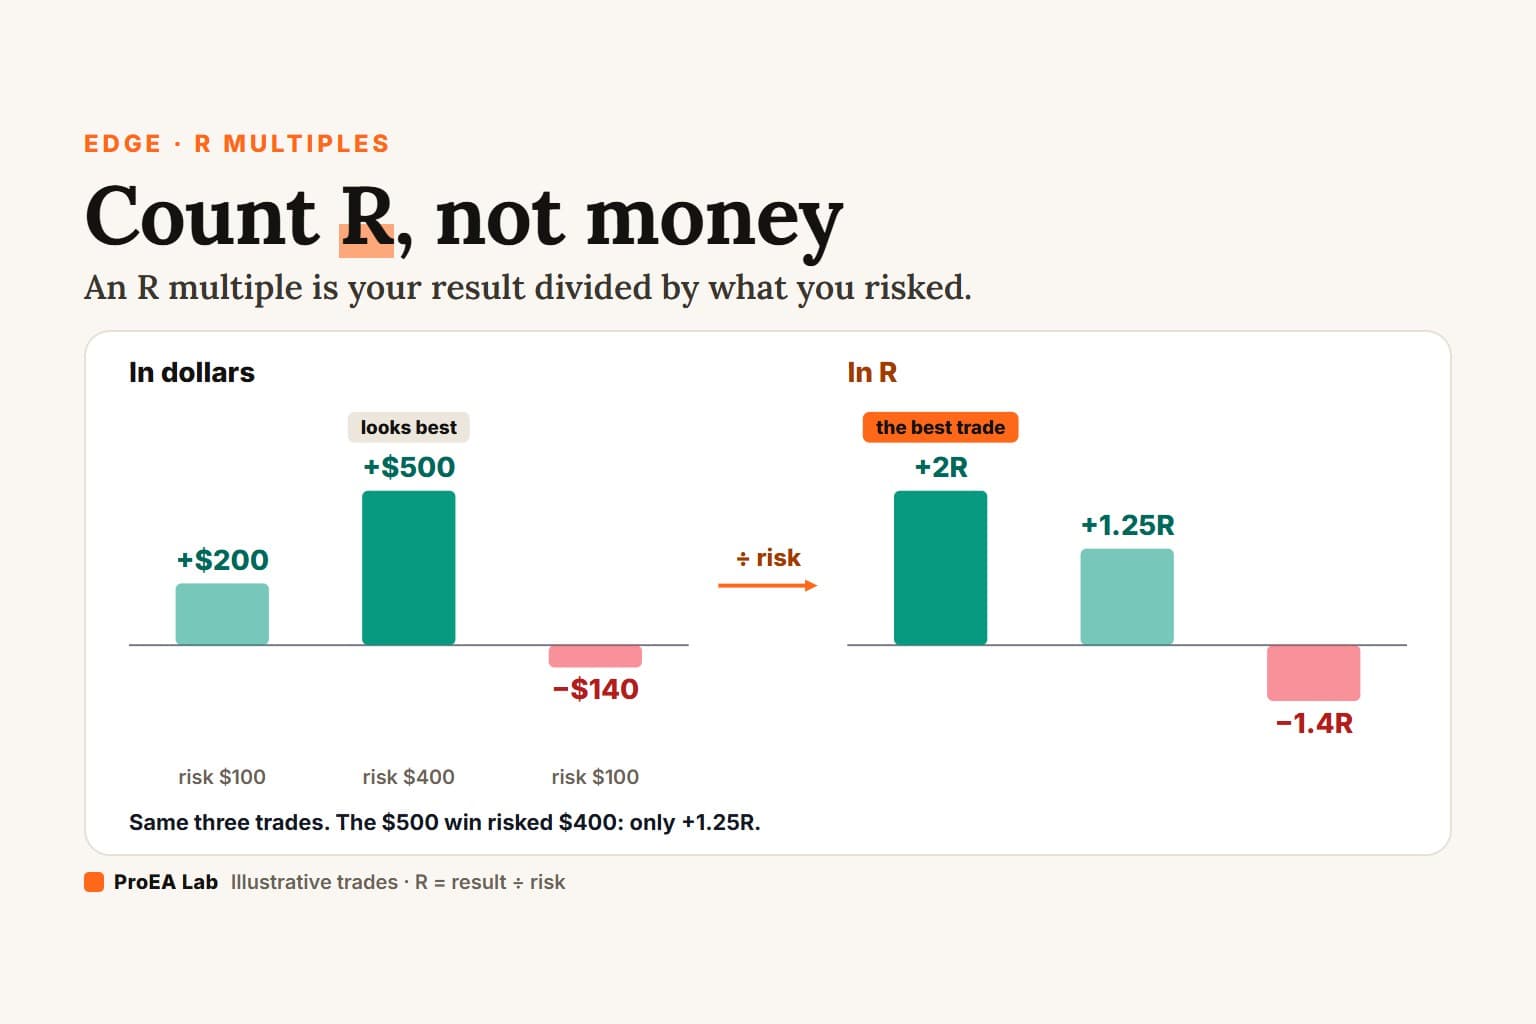
Minutes 10–15 · Plot the shape. Sort the trades by R-multiple. Look at the worst tail, the best tail, the average win and loss, the loss clusters, the drawdown stretches. A number can flatter; a distribution is much harder to fool.
Minutes 15–20 · Decide on evidence you made. Positive expectancy after your costs, a tail you can survive at your size, a drawdown you could actually sit through → then a small forward test. Not because we showed you a win rate. Because you measured the edge yourself.
One last thing
If this stopped you from buying one more "95% win rate" EA without seeing the payoff profile, it did its job. Send it to the trader who needs it before the next green screenshot finds their wallet.
Stop counting how often you're right. Start measuring what it costs you when you're wrong. The account was never paying your win rate. It was always paying your expectancy — you just weren't looking at it.