Open the folder.
You know the one — the strategies folder.
There's the multi-timeframe one, the smart-money one, the breakout one, the mean-reversion grid, the AI-generated one, the one from the expensive course, the one from the YouTube guy with the rented-Lamborghini energy, the one your profitable friend swears by.
Forty-something systems, each downloaded with the same electric certainty — this is the one — and each abandoned a couple of weeks later, after a losing streak, a flat week, or a new thread that made the next system look cleaner.
You concluded, reasonably, that none of them worked, so you kept searching: a better indicator, a cleaner setup, a tighter rule, a more institutional concept, the real holy grail this time. It's an exhausting, expensive hunt, and it has lasted years.
Here's the uncomfortable turn: you probably never tested any of them — you sampled them. A dozen trades here, fifteen there, a bad week, a gut feeling, then you fired the system and hired the next one. That isn't research; it's strategy speed-dating with a P&L column. And the problem usually wasn't that every strategy was bad — it's that fifteen trades and a bad feeling can't tell a winning system from a losing one, so you weren't seeing whether the strategy worked. You were seeing whether the dice were warm.
Before we start, two requests:
- Save this before you download your next strategy.
- Send it to the trader with forty tabs of "the one" open right now.
Not because every strategy works — most don't — but because you currently have no way of knowing which, and the thing you're missing isn't always a better setup. Sometimes it's a sample size, and the patience to reach it.
Skip this if you already commit to a sample, not a fortnight
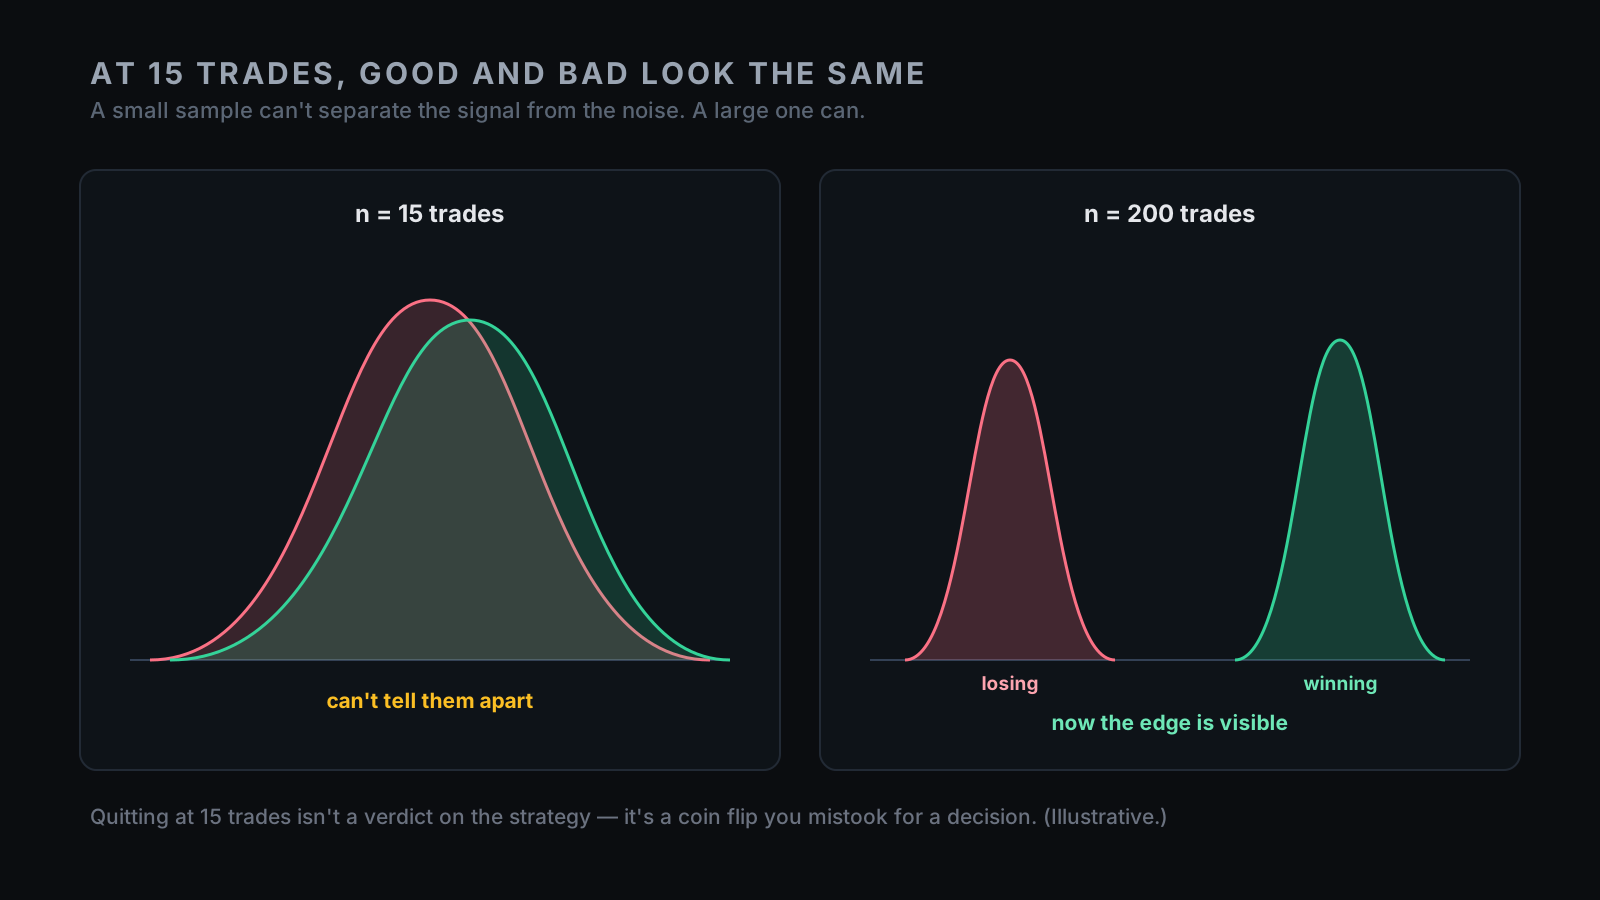
Most strategies you tried were never tested — they were sampled, ten or fifteen or twenty trades, then judged. That's too small to separate edge from random sequencing: a positive-edge system can lose several of its first trades to normal variance, and a negative-edge one can open with a hot streak, and at small samples the two look almost identical. So quitting after a short losing streak isn't a verdict on the strategy — it's a verdict on your tolerance for uncertainty.
| What hopping feels like | What it actually is |
|---|---|
| "This one doesn't work." | "I ran 15 trades — that's noise, not a verdict." |
| "I need a better strategy." | "I need a bigger sample on one strategy." |
| "I'm searching for an edge." | "I'm escaping a drawdown." |
| "The streak proved it's broken." | "A three-trade streak proves almost nothing." |
| "I'm being adaptive." | "I'm buying high and selling low — on systems." |
| "The holy grail is out there." | "The holy grail may be a sample size." |
You may not have forty-seven broken strategies. You may have one untested habit: quitting before the test begins.
I — You never tested a strategy — you sampled dozens
Testing a strategy means running it enough times, across enough conditions, that the result starts reflecting the system instead of the luck of one short window. Sampling is the other thing: a week, a dozen trades, a feeling, out. Most strategies in your folder got the second treatment — you traded them briefly, watched the P&L, and formed a conclusion that felt like evaluation but rested on a sample too small to deserve the confidence. Forty-seven strategies times fifteen trades each is not forty-seven tests. It's zero real tests, repeated forty-seven times.
That line should sting, and it should, because it explains why you can work hard for years and still have no evidence to show for it. You were active — clicking, trading, feeling the pain, making decisions — but activity isn't knowledge. A real test leaves you something durable: over a meaningful sample, across different conditions, this system had this expectancy, this drawdown, this losing streak, this cost sensitivity, this failure mode. A sample leaves you something fragile: this short period happened to go well, or badly. The two feel identical while you're doing them — same clicks, same P&L, same conviction — but one is evidence and the other is variance wearing a lab coat, and you've spent years treating them as the same thing.
II — The math of noise
Here's the part that should genuinely change how you trade, so slow down for it. An edge is a small signal buried in a large amount of randomness, and to see a small signal through loud noise you need observations — more than you want to give. Common guidance in trading education uses numbers like 100 trades as a minimum starting point and 200–500 across varied conditions as a stronger evaluation zone. Don't treat those as law — they're not magic and they're not a guarantee; the point is the order of magnitude. Fifteen trades isn't close.
At fifteen trades, the range of plausible outcomes is enormous: a winning system can look broken, a losing system can look brilliant, and a couple of trades can swing the whole conclusion — one big winner flatters it, one ugly loser condemns it, and neither necessarily says much about the true edge. The trader who judges at fifteen trades isn't evaluating — they're reading noise and calling it truth. The useful question was never "did it win this week?" It's "has it produced enough evidence for this result to mean anything yet?" — and most of the time the answer is no. And if the answer is no, switching isn't intelligence. It's impatience with statistical uncertainty.
III — You quit at the bottom and buy at the top — on strategies
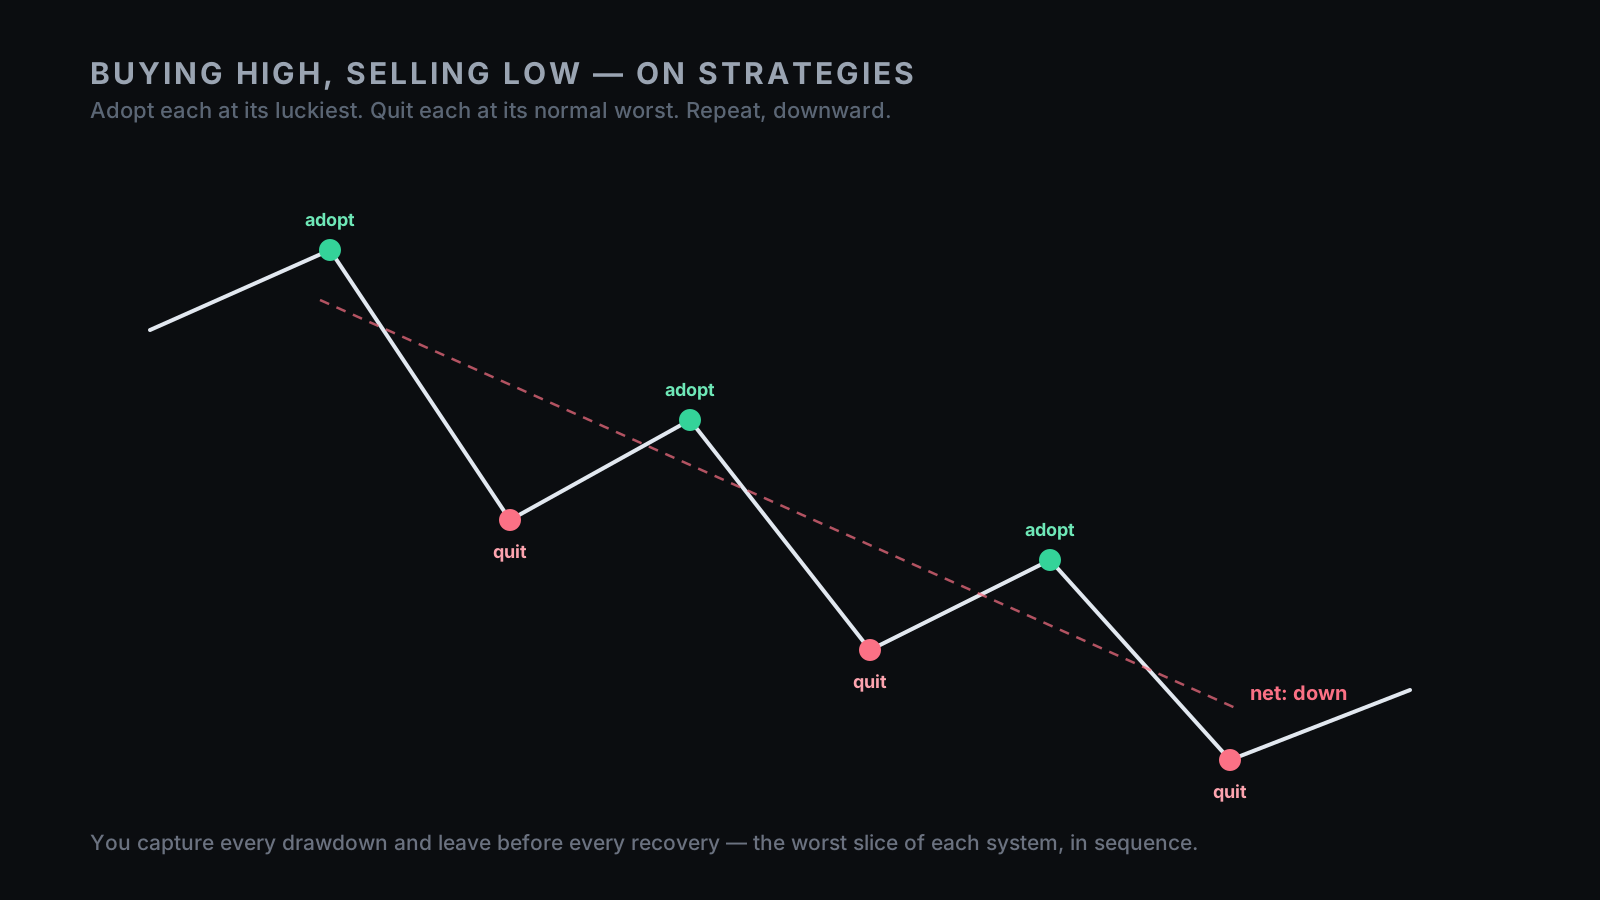
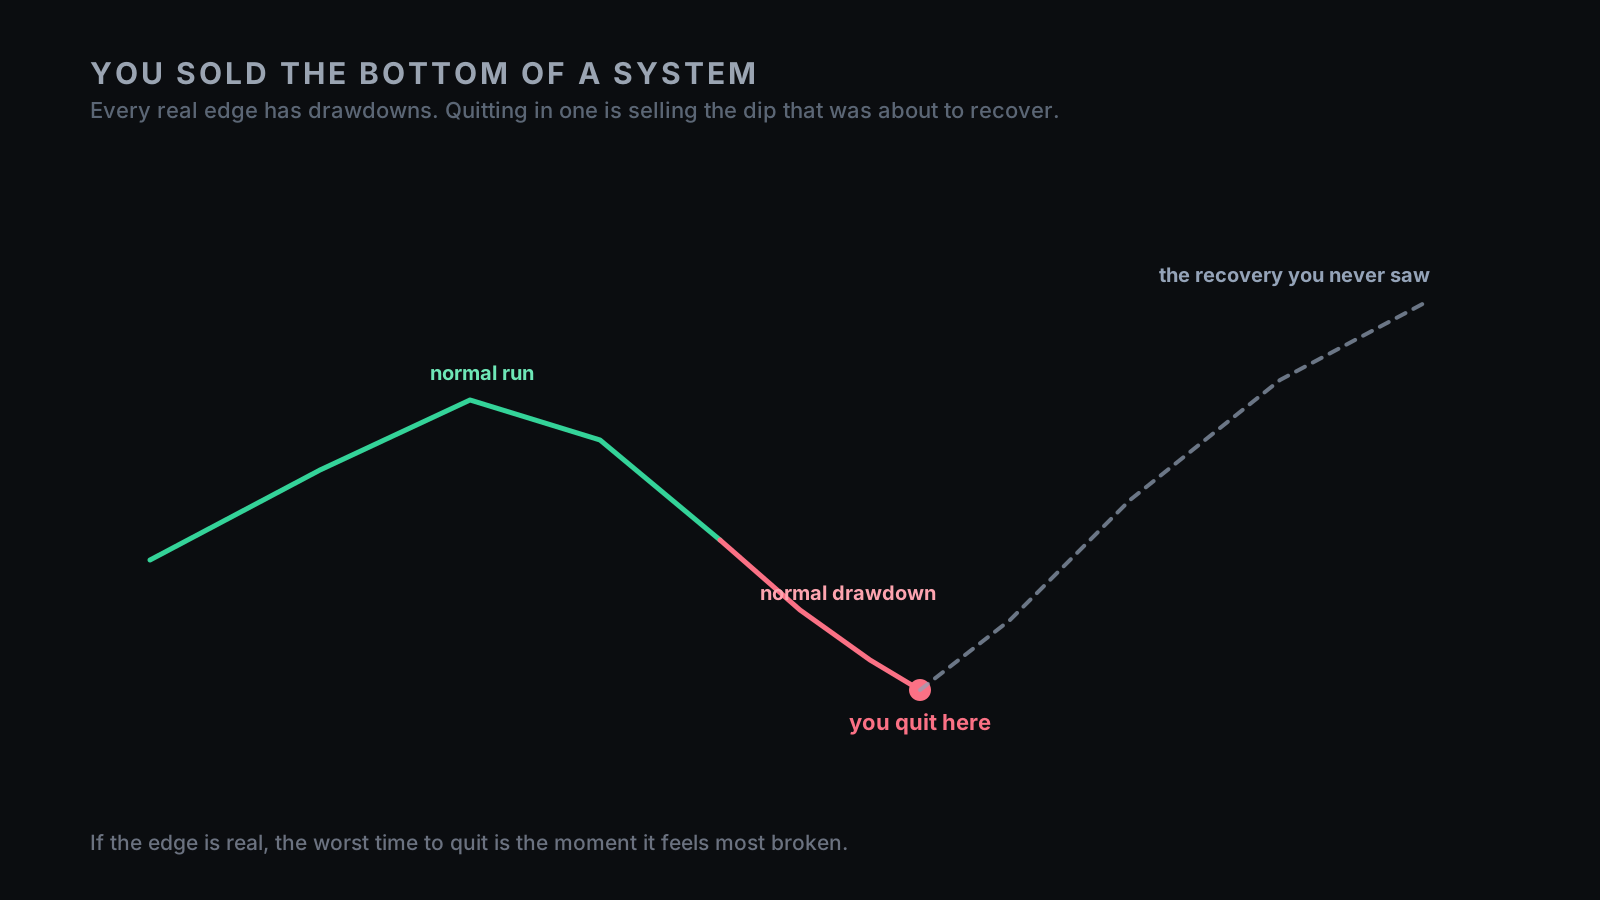
Strategy-hopping isn't only under-sampling; it's badly-timed under-sampling, and the timing is the expensive part. Look at when you abandon a system: almost always during pain — a losing streak, a flat patch, a drawdown, a week where the strategy feels stupid and the chart feels personal. But every real system has drawdowns; they aren't a malfunction, they're the weather. And if the edge is real, a normal drawdown is statistically one of the worst moments to quit, because it's often right before the system reverts to its mean and recovers. Then look at what you adopt next: usually whatever looks good right now — the system trending on the timeline, the one whose last month is clean, the one your friend just posted after a hot streak — i.e., a strategy near a local peak that's about to regress.
Put those together and a brutal pattern appears. You abandon systems near their local lows and adopt new ones near their local highs — which is buying high and selling low, applied to strategies instead of trades. It's the single most destructive behaviour in trading, promoted one level up: even when you're not doing it to individual positions, you're doing it to whole systems. The hopper doesn't merely fail to find an edge — they construct a machine that reliably captures the worst slice of every system they touch: the drawdowns they sit through, never the recoveries they leave before; the excitement of the new, never the evidence of the finished.
IV — A three-trade streak is a feeling, not data
So why do you quit at the bottom every single time? Because a losing streak doesn't feel like variance — it feels like danger. Three or four losses, a missed entry, a winner you skipped that would've saved the week, and the body reacts before the spreadsheet does: this isn't working, stop, find something better. That instinct kept your ancestors alive; in markets it's quietly lethal, because the thing that feels like a sinking ship is usually just the normal motion of the sea. A three-trade losing streak is not data. It's a feeling with a P&L attached.
The tell is in the timing. Real evaluation happens on a schedule you set in advance — "I'll review at 100 trades," "I'll review if drawdown breaks the historical envelope by a set margin." Hopping happens on a trigger you feel in the moment — "this feels bad, it must be broken, I need out." One is a review; the other is a flinch. And if your decision to switch arrived mid-streak on a spike of frustration, it wasn't a decision — and a trading career built out of flinching will keep exiting systems at the precise moment they require commitment.
V — Hopping doesn't find edge — it prevents you from finding it
Now make the trap worse. Suppose — generously — that one of the systems in your folder genuinely has a modest positive edge after costs. Would your current behaviour ever find it? Almost certainly not, because the behaviour that defines hopping is the exact behaviour that prevents evidence from accumulating: you quit the good systems during their normal drawdowns (so you never reach the sample where the edge becomes visible), and you keep the weak ones only during their lucky starts (so you bail the moment they cool — also before a real sample). Even if one of the forty-seven was good, hopping makes it nearly impossible to identify.
That's the cruel part. Hopping feels like searching, and it produces the same outcome as never testing at all. You keep working — trying, learning, downloading, tweaking — but the work points away from the goal, because the goal is evidence and hopping resets evidence to zero, again and again. The hunt for the perfect strategy becomes the most reliable way to never trade a good one — not because good systems are easy to find (they aren't), but because even a good one needs time to reveal itself, and you keep leaving before it can speak. Most traders don't quit because they ran out of strategies; they quit because they ran out of money or morale first, having proven nothing about any system except that they couldn't sit still long enough to test it.
VI — "But what if it really is broken?"
This objection matters, and it's a good one. Sometimes a strategy is broken: edges decay, market structure changes, a rule was overfit, costs rise enough to kill a thin edge. Sometimes continuing isn't discipline — it's denial, and "just hold on" is exactly the advice that rides a grid EA into a margin call (see Staircase Over a Cliff). So this is emphatically not "never quit a strategy." That would be reckless. The point is how you decide — and the entire difference between an operator and a hopper lives in that how. Quit with a rule, not with a mood.
Before you trade a system, define what normal pain looks like — from the backtest and research, write down the worst historical drawdown, the longest losing streak, the longest flat period, the regimes where it struggles. Then define the kill-criteria before the pain arrives: stop or reassess if drawdown exceeds the historical max by a set margin, if net expectancy after costs turns negative over a defined number of trades, if slippage runs worse than the model, if a regime shift invalidates the thesis, if it fails an out-of-sample retest. Now stopping isn't panic — it's operation. A drawdown inside the envelope is weather, so you hold; a drawdown outside it is information, so you reassess. Same action — stopping a strategy — but one is fear and the other is evidence, and your account can tell the difference even when you can't.
VII — The holy grail is a sample size
So the thing you've been hunting for years may not exist in the form you imagined. There may be no indicator that removes uncertainty, no entry that avoids drawdown, no mentor who hands you conviction without evidence, no setup that makes the sample-size problem disappear — and the search for one is itself the reason you never reach a sample. The holy grail was never a setup. It was a sample size — and the patience to reach it.
That sounds boring. It is — which is precisely why almost nobody does it. The trader who runs one decent system for 300 trades learns things the hopper never gets to: how the system loses, when it struggles, how long flat periods last, what its drawdown actually feels like, whether the edge survives costs, whether they can follow it, which regimes help and which hurt. That's knowledge. Sampling thirty strategies for ten trades each produces activity, not knowledge — and the difference compounds. The best trader isn't always the one with the best strategy; very often it's simply the one who could finish the test.
VIII — The 20-minute "are you hopping?" audit
Run this before you download anything else. It's uncomfortable on purpose.
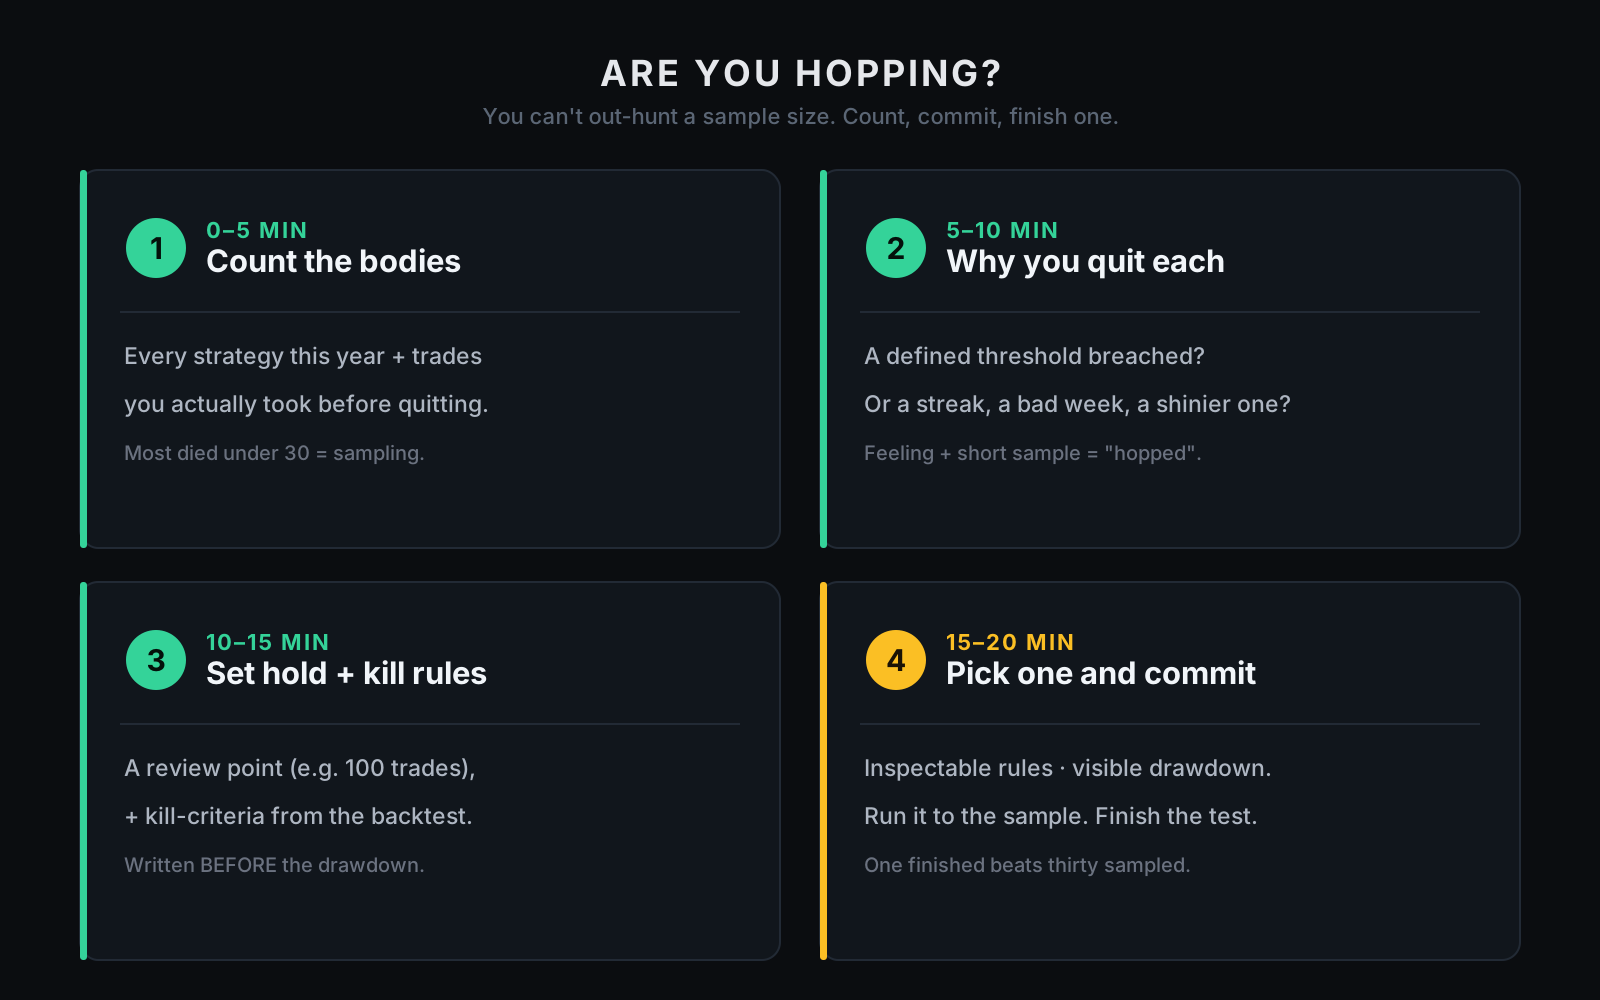
Minutes 0–5 · Count the bodies. List every strategy you traded in the last year, and next to each, honestly, how many trades you actually took before quitting — not how many you planned, how many you took. If most died under 30 trades, you haven't been testing. You've been sampling.
Minutes 5–10 · Find why you quit each one. Write the real reason beside each. A defined threshold breached, the drawdown envelope broken, the cost model failed, an out-of-sample retest failed — or a losing streak, a bad week, boredom, fear, a shinier option? If the reason was a feeling and a short sample, mark it "hopped," not "tested."
Minutes 10–15 · Set a minimum-hold rule and kill-criteria. Before trading anything again, commit in writing to a review point — common starting examples are 100 trades or 90 days, though the right number depends on your trade frequency, strategy type, and risk; these aren't universal laws, they're commitments — and to the data-driven kill-criteria from Section VI. The decision to continue or stop is now a number, set before the pain.
Minutes 15–20 · Pick one and commit. Choose a single system with a plausible thesis, rules you can inspect, evidence you can review, costs included, and a drawdown profile you can see in advance — then run it to the sample. Don't marry it; don't worship it; just finish the test. You'll learn more from finishing one mediocre system than from sampling thirty brilliant ones — because only one of those produces evidence.
Where this meets ProEA
Now the honest part, and it's the whole reason MTR is one system instead of a marketplace of forty. The edge you're missing was probably never going to arrive as strategy number forty-eight — it comes from running one inspectable system long enough to actually know it. So we did the part hopping never lets you do: a large sample, across years, published. MTR ships with a 28-month backtest and full source precisely so the "is this normal pain, or is it broken?" question has something to reference besides your mood.
That's the practical gift of a published sample and readable rules: you can see the worst historical drawdown and the longest flat stretch before you trade, so when the bad streak comes — and it will — you can tell whether it's inside the envelope (hold) or outside it (reassess), instead of discovering your kill-criteria mid-panic. A bad week is less terrifying when it resembles one you already saw in the evidence; a losing streak is less personal when it's inside the known envelope. To be precise about what that does and doesn't mean: a 28-month sample is evidence, not a guarantee — the future can differ from the past, the edge can decay, your broker may not match the test, and a large sample only reduces the chance you're fooled by luck; it doesn't abolish luck. What it gives you is the ability to decide from a published sample instead of a fortnight and a feeling. And it does not mean "never stop" — it means stop on the threshold you wrote down before the pain, not the emotion you're having during it.
Disclosure: the one question before you switch
We sell source and evidence you can inspect — not outcomes, not a holy grail, not a promise that any system keeps working. No strategy can promise future results; past performance is not future performance; every edge can decay; every account carries real risk of loss, ours included. A larger sample reduces the chance you're fooled by luck — it does not abolish luck.
So before you abandon your current system for a shinier one, ask the question that separates testing from hopping: "Have I run this to a real sample — and is my reason to quit a number I set in advance, or a feeling I'm having right now?" If it's a feeling and a fortnight, you're not upgrading your strategy. You're resetting your sample to zero, again.
Your first 20 minutes
Don't take our word for it. Take one system and actually finish it.
Minutes 0–5 · Read the drawdown profile first. Open MTR's published 28-month evidence and go straight to the worst stretches — the deepest drawdown, the longest flat period, the ugly months. This is the single most useful thing to know in advance, because it tells you what normal pain looks like, so you don't mistake it for failure.
Minutes 5–10 · Read the rules, not just the curve. Open the source and see what the system does, when it refuses to trade, how it sizes, how it exits, how it handles risk. A strategy you can read is one whose drawdowns you can understand — and understanding is what lets you hold through a normal one instead of hopping out of it.
Minutes 10–15 · Write your thresholds down. While you're calm, set two numbers from the evidence and your own risk tolerance: the sample you'll run before judging, and the drawdown that would break the envelope and trigger a reassessment. Put them in writing now — a threshold that isn't written before the drawdown isn't a plan, it's a future argument with yourself.
Minutes 15–20 · Commit to the sample, not the fortnight. Run it on your own broker's demo or a small live account, at a size you can survive, through the drawdowns you've already seen on paper — and review at the sample you committed to. Not on a bad Tuesday, not after three losses, not because the timeline found a new toy. Decide on the evidence you set out to gather, not the feeling you had while gathering it.
One last thing
If this stopped you from downloading strategy number forty-eight, it did its job. Send it to the trader with forty tabs of "the one" open — the one about to quit a perfectly normal system at the perfectly worst time, again.
You don't have a strategy problem. You have a sample-size problem wearing a strategy-shaped disguise. The holy grail was never the next system. It was finishing this one.