You screenshot your chart, paste it into ChatGPT or Claude, and ask the question everyone asks — what do you see, where's support, is this a good trade? Back comes a clean answer: trend is bullish, support at 1.0840, resistance at 1.0910, price compressing, breakout likely, risk-to-reward reasonable.
It sounds like a desk analyst.
It feels like you just borrowed professional eyes for free.
Now go back to the chart and actually check the numbers. Sometimes one of those levels is real. Sometimes two are. And sometimes the AI names a support where no candle traded, no wick touched, and no sane trader would draw a line unless they were decorating the void — a resistance that exists only in its sentence. It didn't lie on purpose; it did something worse for a trader: it sounded confident while guessing. You just took chart advice from a brilliant intern who needs glasses and would rather improvise than admit it can't read the screen.
That's the whole problem — not that AI is useless on charts (used right it's genuinely powerful), but that people use it for the wrong job. AI vision is a pattern-describer, not a measuring instrument, not a level-finder, and not a predictor. It can describe structure, red-team your setup, ask why you're forcing a trade outside your rules, and catch the part of the chart you're rationalizing because you already want to click. But the moment you ask it to read exact prices off pixels, it starts squinting — and when it squints, it doesn't always say "I can't see." It writes a fluent story, and that story can cost money.
The AI didn't read your chart. It wrote a confident story about a blurry picture of it.
Save this before your next "let me ask ChatGPT what it thinks of my setup." And send it to the friend who screenshots every trade into AI and trades the reply — that friend doesn't need a smarter model, they need a safer workflow.
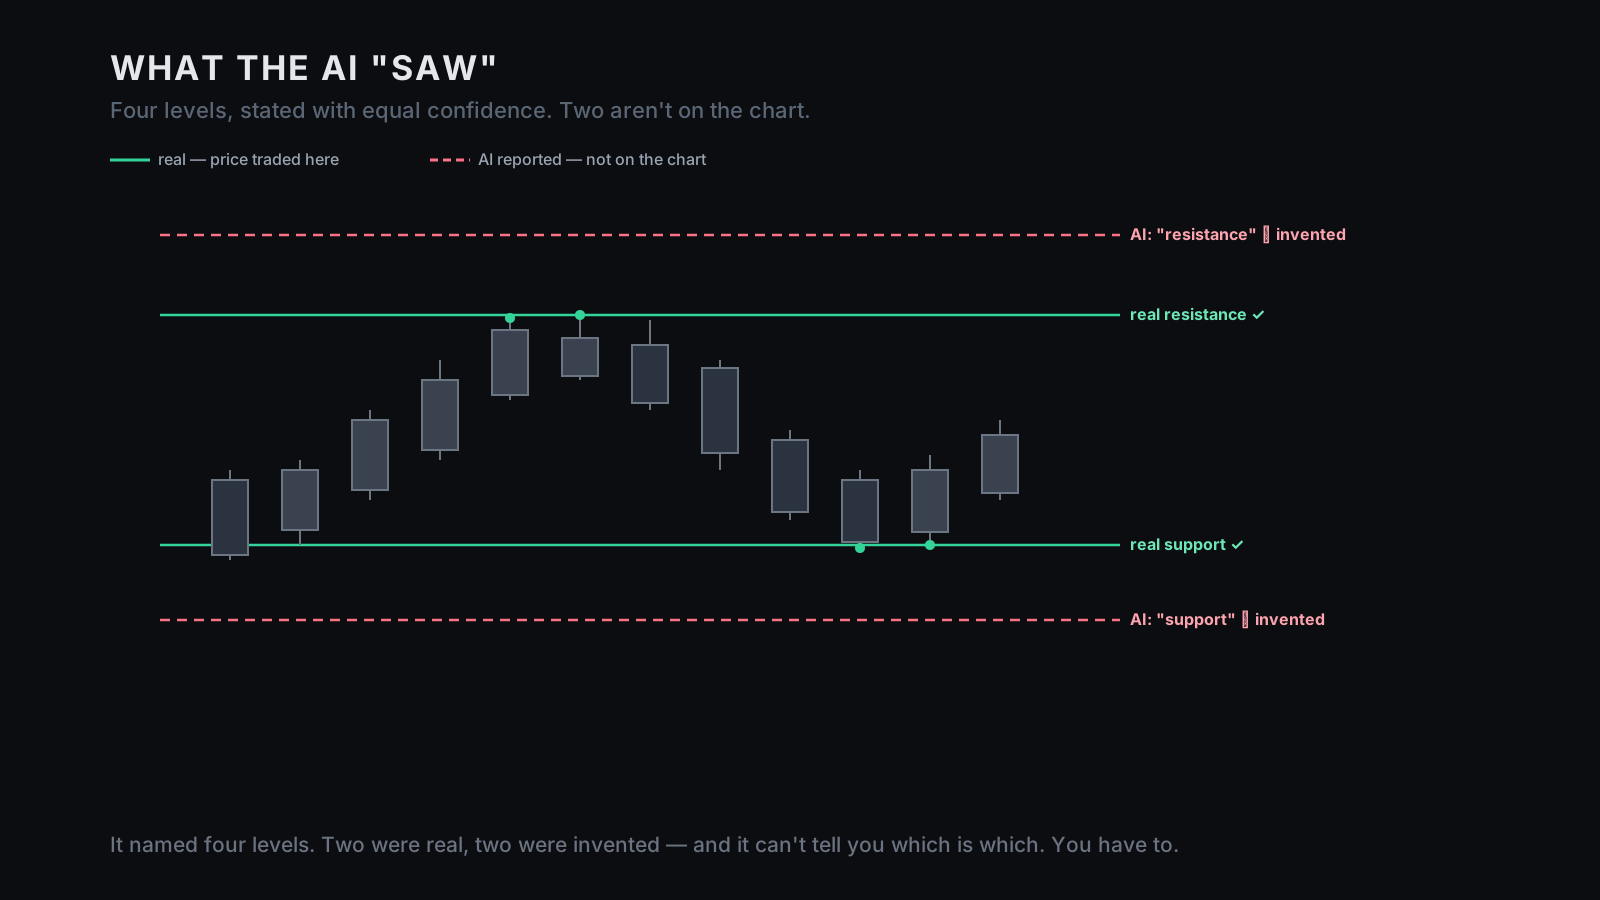
vision models can confidently state support and resistance that aren't actually on the chart — never use a level it read off an image for execution without checking it yourself.
Chart-vision tests ↗practitioners treat LLMs as tools for analysis, learning, and review — not as autonomous, real-time execution or decision tools.
QuantVPS, LLMs in algo trading ↗when many traders extract similar signals from the same models, trading on those correlated reads can crowd the signal and erode its edge.
AI-Driven Alpha Decay (2026) ↗The 60-second version
AI vision models are fluent pattern-describers, not measuring instruments. Ask one to look at a chart and it may describe the structure well — trend, range, compression, a failed breakout, a momentum shift. But ask it for exact levels and it may produce numbers that sound precise and aren't real: a support, a resistance, a target, an indicator value. Some may be right; some may be invented — and the problem is that it often states both with the same confidence. So the rule is simple: you read the chart; the AI reasons about your read. Don't ask "where is support?" Ask "my support levels are [list] — does the structure respect them, what am I missing, argue against this setup." Use AI for structure, classification, a checklist, and a red-team; never as the source of exact prices, and never to predict. Verify every number. The value isn't the line it draws — it's the objection it raises.
| What you ask (and shouldn't) | What to ask instead |
|---|---|
| "Where is support and resistance?" | "My levels are [list]. Does the structure respect them?" |
| "Is this a good trade?" | "Argue against this setup." |
| "Where will price go next?" | "Does this match my written setup?" |
| "Read the indicator values." | "My indicator values are [list]. Do they confirm or conflict?" |
| "Give me a trade idea." | "Check whether this trade violates my rules." |
| "Should I enter?" | "What's the strongest reason to skip?" |
I — The confident intern
Hallucination isn't a weird side effect you can scold out of the model; it's how these systems behave when asked to resolve uncertainty. A vision model doesn't read your chart the way you do — it doesn't always map each candle to the price axis with your platform's precision. It sees an image and predicts a plausible description. When the image is simple, that description can be useful; when the screenshot is crowded, compressed, blurry, oddly scaled, or missing price labels, the model still tries to answer — and that's where the danger starts. A human analyst might say "I can't read the exact level from this image." The model is more likely to say "support is 1.0840" — very clean, very confident, possibly fake.
That's why the intern metaphor works. The intern is smart, sees broad structure, can discuss the setup, and can catch your reasoning mistake — but can't reliably read tiny numbers off a blurry screen, and would rather sound helpful than admit the screen is hard to read. The model's confidence is not proof. It is style — and in trading, style with the wrong numbers is expensive.
Which of its lines are real? It can't tell you — but it will sound certain about every one.
II — What AI vision is genuinely good at
Aimed at the right job, AI chart analysis is very useful. It's good at structure, not execution:
- Describing the market shape — higher highs, range compression, a failed breakout, a trend channel, a momentum shift. A second view of structure, not a signal.
- Classifying a setup — given your rules, it can say "this looks more like a range-breakout attempt than a trend pullback," which saves you from calling every chart the setup you wanted to see.
- Finding contradiction — you say "I only trade with trend," then paste a flat, choppy chart, and it says "this doesn't match your trend condition." Valuable, because it isn't emotionally invested in the trade.
- Running a visual checklist — is this your regime, is the stop logical, is price near your level, is volatility too high, is the entry late, is this revenge? The checklist is the product; the chart is just context.
- Red-teaming what you already want — the chart you screenshot usually isn't neutral; you already want the trade and you're really asking for permission. A good prompt argues back instead.
III — What it's bad at, and what's dangerous
Now the sharp part. AI chart analysis is dangerous when you ask it to do measuring work:
- Exact levels and prices — support at 1.0840, target at 1.0950: maybe real, maybe not, and the model may not know the difference. Never trade a number it read from an image without checking it.
- Axes, scale, and counting — it can misread log vs linear, miscount bars, miss session boundaries, and misjudge where the current candle sits. A small chart-reading error becomes a large trade-management error.
- Indicators it can't really see — if the RSI is tiny or the values aren't labelled, it may "read" a number that it's actually guessing. That's not reading; that's guessing with a tie on.
- Prediction — the most dangerous one. AI does not know where price will go. It can describe conditions and reason about your setup; it cannot foresee the next candle, breakout, or liquidity sweep with any private certainty. Regulators say it plainly: AI can't predict the market. "This looks bullish toward 1.0950" is a sentence, not a forecast.
The danger isn't that AI is useless — it's that it's articulate about things it can't know. Articulate-and-wrong beats obviously-wrong at stealing money, because it sounds like analysis.
IV — The fix: feed facts, don't ask for facts
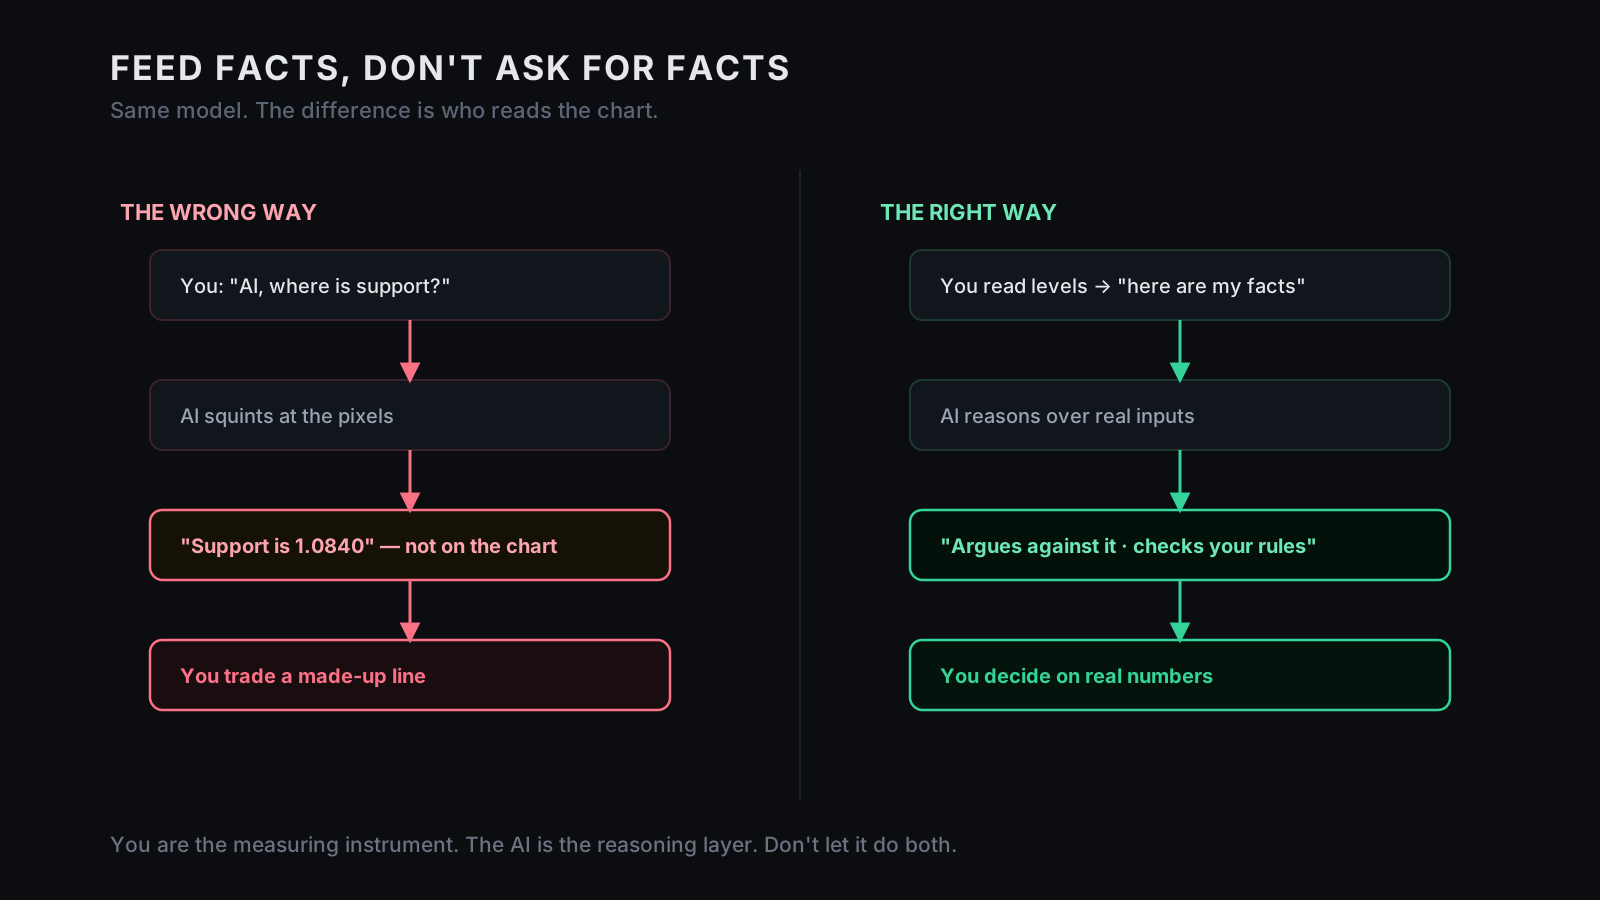
This is the workflow shift that solves most of the problem: stop asking AI to find facts from the chart, and give it the facts so it can reason. Wrong is "where is support, is this bullish, where should I enter?" Right is feeding it what you read — "I read support at 1.0840 and resistance at 1.0910; price is 1.0875; ADX is 27; price is above a rising 200-MA; my setup is a pullback long in an uptrend; does this match my rules, and what's the strongest reason to skip?" Now the AI works from verified inputs instead of inventing them.
You are the measuring instrument; the AI is the reasoning layer — don't let it do both. If you give it the wrong facts, it reasons from wrong facts, so this still requires you. Good — trading should require you. The goal isn't to outsource judgment; it's to stop judgment from getting lonely and weird.
V — Red-team the chart (the copilot, visual edition)
The best way to point AI at a chart is the same as the copilot's first job: make it argue against you. Don't ask "is this a good trade?" — ask "what's the strongest case against this trade?" That one change flips the tool from a permission machine into a risk officer. Paste the chart and your read (levels, regime, setup, stop, target, reason, correlated positions), then ask: what am I ignoring, what condition is missing, where am I forcing it, does this violate my rules, should this be GO / SIZE-DOWN / SKIP? The output isn't a trade signal — it's an objection, and the objection is the value. The chart you screenshot is the trade you've already half-decided to take. The AI's job is to make the other half argue back.
VI — Which AI, honestly
The practical version, without turning it into model religion. Claude tends to reason more cautiously and assert fewer invented levels. ChatGPT tends to answer faster and more confidently. Gemini is useful when you want current news or web-connected macro context around the chart. Those differences matter — but they don't change the rule: whichever you use, you measure, you provide the levels, you verify the numbers, and the model reasons. The best model for chart analysis isn't the one you trust most — it's the one you trust least with a number. Assume it can misread every price it states and your workflow stays safe; assume it sees exactly what you see and you're one hallucinated support away from donating to the spread gods.
VII — The deeper trap: everyone has the same eyes
Suppose the model reads the chart perfectly, describes structure well, and reasons cleanly. You still don't automatically have an edge — because everyone else can paste the same chart into the same model: the same screenshots, the same public candles, the same prompt, the same answer. That isn't a private edge; it's consensus with better grammar. Researchers now model exactly this at the market level: when many traders extract similar signals from the same models, trading on those correlated reads can crowd the signal and erode its edge.
So use AI chart analysis for discipline — am I following my rules, am I forcing a setup, am I outside my regime, am I inventing a reason to enter — not for edge, which still has to come from your rules, your regime, your execution, and your research. The model can help you apply an edge; it can't make a public chart read private. An opinion a million traders can generate for free is not an edge. It's a consensus — and consensus is a crowded place to look for alpha.
VIII — The honest workflow
Run this every day:
- Screenshot a clean chart — visible axis, minimal clutter. The clearer the input, the less nonsense you invite.
- Read the levels yourself — current price, support, resistance, trend state, regime, indicator values, setup, stop, target. If a number matters, it comes from you, not the model.
- Feed those facts to the AI and ask it to reason — not measure, not predict.
- Ask for the bear case. If the AI only agrees with you, your prompt is weak; tell it to be skeptical and to reject the setup when the facts don't fit the rules.
- Verify every number. If it volunteers a price, treat it as unverified; if it quotes an indicator, check it; if it names a level you didn't provide, assume it's a guess until proven otherwise.
- Use the objection, not the verdict. Don't outsource the click — use the objection, then decide. The trade, the risk, and the account are yours; the AI is a second set of eyes, not the hand on the mouse.
The chart prompts
Use this when attaching a chart:
I'm attaching a chart. Two strict rules:

1. DESCRIBE structure only — trend / range / compression / breakout
   attempt / failed breakout / momentum shift / obvious conflict with
   my setup.
2. Do NOT state exact support, resistance, prices, targets, stops, or
   indicator values from the image. If you need a number, ask me. Do
   NOT predict where price will go.

Facts I read from the chart:
- current price · support · resistance · trend state · regime
- indicator values · my setup · entry idea · stop · target · risk context

Your job:
- argue the strongest case AGAINST this setup
- name what I may be ignoring and any missing information
- check whether it matches my written rules
- return GO / SIZE-DOWN / SKIP — no target, no invented level, no flattery.
Use this whenever it volunteers a number:
You stated [level / price / indicator value]. I did not provide that
number — treat it as an unverified guess. Confirm you cannot reliably
read exact prices from the image, and re-answer using only the levels
and values I gave you. If a number is missing, ask me — do not invent it.
And this for a cleaner visual review:
Review this chart as a visual checklist only. Do not read exact prices.
Do not predict. Tell me:
1. What broad structure is visible?
2. What is unclear or unreadable from this screenshot?
3. What facts do you need from me before judging the setup?
4. What is the strongest reason this trade might fail?
5. Does my stated setup match the visible structure?
The 20-minute test
Run it once; it will change how you use AI charts forever.
Minutes 0–5 — Catch a hallucination. Paste a real chart and ask the old way: "where are support and resistance?" Write down every level it names — don't argue, just collect the lines.
Minutes 5–10 — Check them. Go back to your chart and verify each one: did price actually touch this, was there structure, is the level visible, did it invent it, did it misread the axis? Count the misses. That count is your tuition — better paid in pixels than in money.
Minutes 10–15 — Re-do it correctly. Read the levels yourself, feed them in, and ask for red-team reasoning. The answer becomes less magical and more useful — less "here is the future," more "here is the risk in your plan."
Minutes 15–20 — Save the prompt. Keep the chart prompt above, edited for your setup, and make it part of your copilot: facts in, reasoning out, numbers verified, decision yours.
Where this meets ProEA
There's a clean parallel here: a chart screenshot is a picture of behavior; a source file is the behavior written down. A screenshot invites a story — and, like the AI's confident-but-invented level, can imply a precision that isn't really there. A source file invites inspection. AI is good at reasoning over facts you give it, so the quality of the facts matters: hand it a blurry chart and ask for levels and you may get a story; hand it actual rules, levels, and logic and it can check the process.
That's why we sell MTR as source — not a screenshot you admire, but logic you can read, rules you can inspect, and a thing you can hand to a copilot to check directly. A chart image can be misread; a written rule can be checked. That doesn't make MTR profitable and AI won't make it so — MTR can lose. The fix for a confident story is never a more confident story — it's something you can actually read.
Disclosure
We sell source and evidence you can inspect — not outcomes, not guarantees. AI vision models can misread charts and invent support, resistance, targets, and indicator values, stating uncertain observations confidently; they cannot predict price and must not be used for execution on their own. Treat any number an AI reads from an image as unverified until you check it yourself. An AI chart read is a widely available opinion, not a private edge. Trading is risky, leverage magnifies risk, and past performance is not future performance. Use AI to reason, to argue against you, and to enforce your checklist — never as an oracle, and never as the source of the precise numbers your risk depends on.
Your first 20 minutes
Paste a chart into your AI and ask where support and resistance are. Write the levels down, check every one, and count the inventions. Then do it the right way: read the levels yourself, give the AI the facts, and ask it to argue against your setup. That one experiment permanently separates the useful part of AI from the dangerous part — it can reason about your chart better than you expect, and read the exact numbers worse than you think. Know which part you're using.
The one line to take with you
AI can reason about your chart better than you expect, and read it worse than you'd ever guess. Let it think. Never let it squint. And read the numbers yourself.