
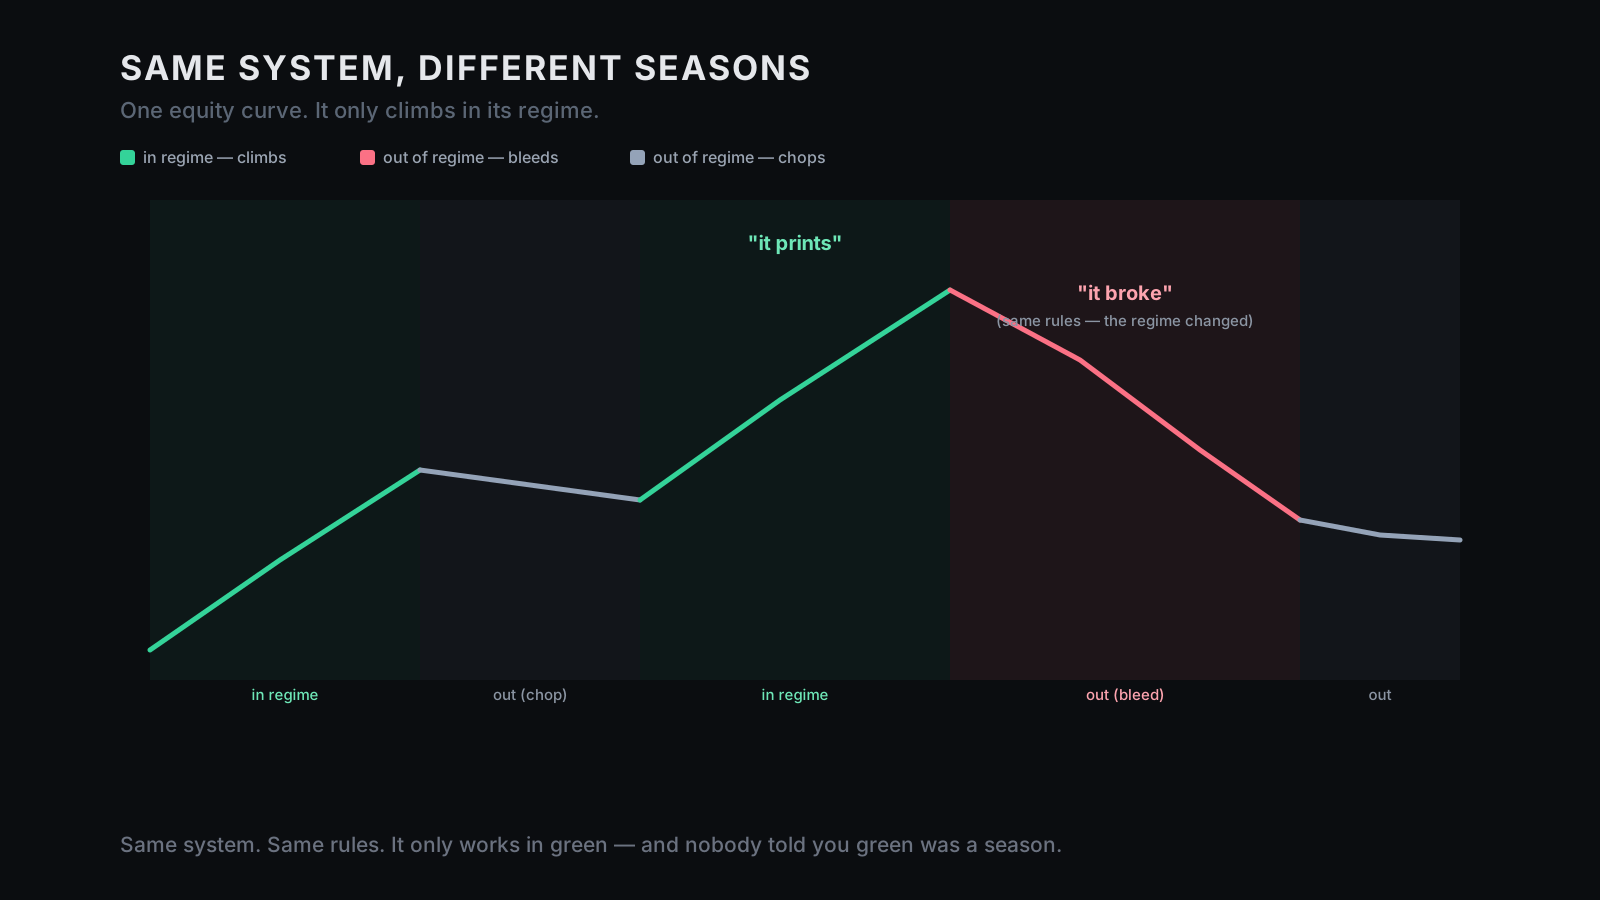
For six months, it printed.
The equity curve climbed, the rules felt clean, the entries made sense and the exits behaved.
You finally stopped touching the settings every time the market sneezed.
For once you weren't chasing a new strategy — you had one.
Then it died. Eight losing weeks: small losses, fake starts, breakouts that faded, pullbacks that never bounced, signals that used to feel obvious now firing like they were generated by a toaster with unresolved childhood issues. You stare at the report and reach for one of two stories — the system is broken, or I was lucky and never had an edge. Both might be wrong. There's a third story, the one almost nobody tells you because it's less dramatic and more useful: the market left the conditions your edge needs.
Your system did not suddenly forget how to trade. Your strategy was always a bet on a certain kind of price movement; for six months the market behaved that way, so the edge paid; then the behavior rotated. The edge didn't vanish — it went out of season. Tearing up the rules at that moment is like ripping out your tomato plants in November and concluding you can't garden. Wrong diagnosis, wrong surgery, wrong month.
This post is about the market regime — the prevailing behavior of price — and the fact that every edge is conditional on it. Not some edges. Every one. Trend systems need continuation; mean-reversion needs rotation; breakout needs compression that expands; grids need ranges that don't become cliffs. When the regime changes, the same rules can go from brilliant to stupid without a single line changing. That isn't failure. That's the seasonality of edge.
Your edge wasn't lost. It was out of season.
Save this for the next time a working system "suddenly breaks." And send it to the trader who rebuilds their whole strategy every time it has a bad month — they may not need new rules, they may need a weather report.
Hamilton's regime-switching framework made shifting market states a formal part of time-series analysis.
Hamilton, regime-switching ↗a practical trend-strength line many traders use to separate trending from weak or ranging conditions.
Trend-strength gauge ↗direction × volatility gives a usable regime map: trend/calm, trend/volatile, range/calm, range/volatile.
The regime stackThe 60-second version
Every strategy assumes a market behavior: trend-following assumes continuation, mean-reversion assumes rotation, breakout assumes compression can explode, range systems assume price keeps coming back. Each can be a real edge — but only when the market is in the condition that rewards that behavior. When the regime rotates, the edge goes quiet, the curve rolls over, and the system feels broken. Often nothing inside it changed; the market simply stopped being the market your edge was designed for.
The fix is not always a new strategy. Sometimes it's a regime map: where does my edge make money, where does it bleed, what does the market look like right now, and should I trade, size down, or sit out? The deep version is one move — add a regime column to your journal and compute expectancy in each regime. You'll usually find your entire edge lives in one or two boxes, and the rest of the trades are dilution.
| What you conclude in a bad month | What is often true |
|---|---|
| "My system is broken." | The regime rotated; the rules are fine. |
| "I have no edge." | You have a conditional edge, currently out of season. |
| "It used to work, now it doesn't." | The behavior it needs stopped showing up. |
| "I need a new strategy." | You may need a regime filter on the one you have. |
| "Losing means stop." | Losing in-regime and out-of-regime mean different things. |
I — Every strategy is a bet on a behavior
A strategy is an assumption about price, encoded as rules — that's all it is. A trend-following strategy says moves continue often enough to pay for the false starts. A mean-reversion strategy says extremes rotate back often enough to pay for the times they don't. A breakout strategy says quiet compression sometimes expands violently enough to pay. A grid says price will oscillate enough before it trends too far. None of these assumptions is always true; all of them are true sometimes — in the regime that rewards them.
So "does this strategy work?" is often the wrong question. The better one is in which market does this strategy work? — and that single shift turns a system from a magic object into a conditional tool. Tools are allowed to have conditions. A hammer isn't broken because it's bad at cutting glass. Your trend strategy isn't broken because the market stopped trending — it's just out of its job description.
II — The regime stack: direction × volatility
"Trending versus ranging" is useful, but it's only half the map. A market also has a volatility state — calm or wild — and the two axes stack into a simple grid you can actually hold in your head:
| Low volatility | High volatility | |
|---|---|---|
| Trending | smooth grind — trend-following heaven | strong but whippy — wider stops, smaller size |
| Ranging | quiet chop — mean-reversion zone | violent chop — account graveyard; often sit out |
This four-box map isn't perfect — good, because perfect maps are usually overfit maps wearing glasses. It's useful precisely because it's simple enough to use live. You're not naming every market mood like a wine critic; you're trying to avoid taking your best setup in the one box where it reliably bleeds. Most systems have one box where they make money, one where they survive, one where they chop, and one where they bleed. You don't need to predict the regime. You need to know which box you're standing in.
III — Why your system "broke"
Put the first two sections together and the autopsy writes itself. Your trend system printed for months because the market was trending; then it rotated into a range, continuation stopped paying, breakouts faded, and stops got hit before the move. Same rules, same skill, opposite result — because the regime flipped. The system looked broken; it was just doing what it always does outside its money regime: bleeding.
The cruel part is the timing. A regime persists long enough for you to believe — months of clean performance, until you finally size up, finally trust it, finally stop tinkering — and then it changes right as your conviction peaks. This is how traders destroy good systems: they mistake seasonality for failure. They tear apart rules that only needed a filter, abandon strategies that only needed patience, or optimize the system to survive the new regime and quietly break the edge it had in the old one — now it's worse everywhere, all because the diagnosis was wrong. (It's also why strategy-hopping fails: you quit each system the moment its regime turns, right before it would have come back.)
In which market does your edge actually live?
If you can't answer that, you don't yet know the system — you only know its blended equity curve.
IV — Measure your edge by regime
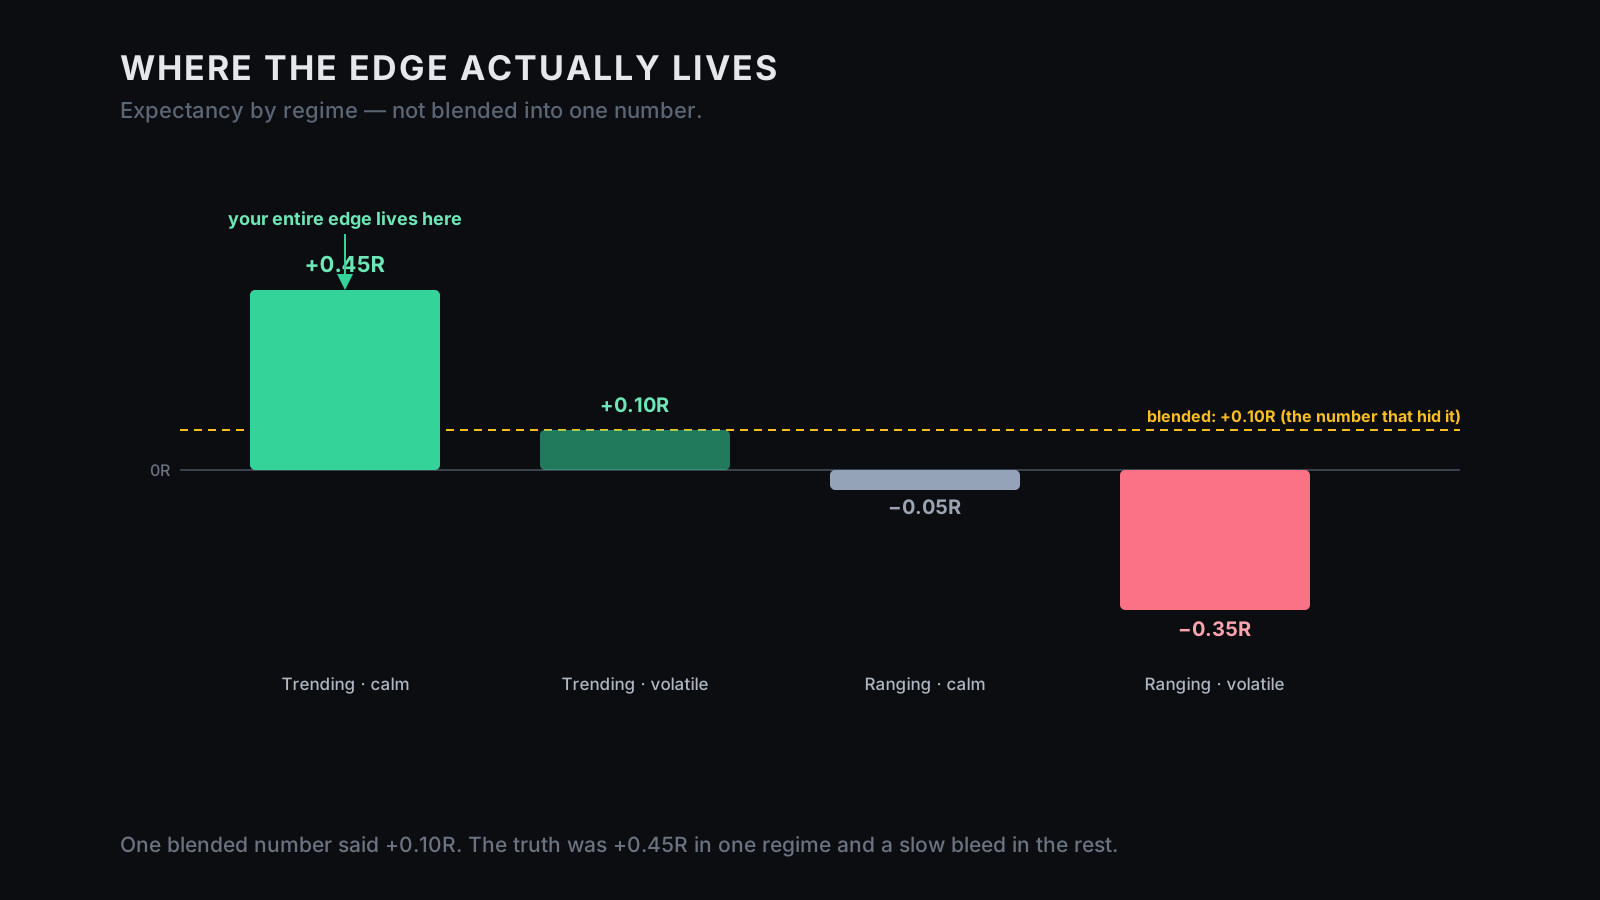
This is the real move: stop measuring expectancy as one blended number, and measure it by regime. Take your past trades, add a column for the regime at entry, and compute your average result — in R — inside each box. Not one average. Four. The first time you do it, the system starts confessing:
Trending · calm      +0.45R     ← the edge lives here
Trending · volatile  +0.10R     ← survives
Ranging  · calm      −0.05R     ← chops
Ranging  · volatile  −0.35R     ← bleeds
   blended:          +0.10R     ← the number that hid all of it
That blended +0.10R you were so unsure about was hiding the truth: a strong edge in one regime, dragged toward zero by trades you should never have taken in the others. Your edge isn't weak. It's diluted by trades taken in the wrong regime. This is counting R with one extra column — and that column can matter more than your next ten entry tweaks.
V — The three gauges that read the regime
You don't need a hidden-Markov model, or a classifier with twelve inputs and a dashboard that looks like a nuclear submarine. You need three blunt gauges — good enough to stop the dumb trades.
1. Direction — price versus the 200-MA. Above and rising is an up-trend bias; below and falling is a down-trend; repeated crosses with a flat slope is a range. It's a weather vane, not a prophecy.
2. Trend strength — the ADX. ADX doesn't tell you direction; it tells you whether a trend has strength. Above ~25 means a real trend is present (trend-following's zone); below ~20 means weak or ranging (mean-reversion's zone, or sit out); 20–25 is transition. Don't worship the threshold — it's a blunt instrument, and blunt is fine. You're not forecasting the future, you're avoiding forcing a trend system when trend strength is absent.
3. Volatility — ATR versus its own history. The absolute ATR matters less than where it sits in its recent range: top fifth of the last few months is a high-vol regime (widen stops, cut size), bottom fifth is calm. High volatility isn't "don't trade" — it's stops wider, size smaller, expect more noise. Volatility isn't the danger; unadjusted size in volatility is.
Read those three and you know your box. Not perfectly — and that's fine, because perfect is fake and useful is enough.
VI — What to actually do about it
Once you know where the edge lives, you have four moves, in order of effort:
- Trade only the regime that pays. If your journal says you make money in trending/calm and bleed in ranging/volatile, stop taking trades in ranging/volatile. It sounds too obvious — that's why it works. Most traders try to improve their entries inside the bleed regime; the best trade in a bad regime is usually still a bad trade.
- Size by regime — full size in your money regime, half in your survive regimes, flat in your bleed regime. This is fractional Kelly and the drawdown ladder wearing a weather jacket: bet most where the edge is strongest, nothing where it's absent.
- Sit out when unclear. Flat is not laziness; flat is a position. When ADX is mid-range and price chops around the 200-MA, the market is telling you that you don't have to participate in this nonsense — and "do nothing" is a valid, profitable answer.
- Add complementary edges later (advanced) — a trend system and a range system, each gated to its regime, so one is usually working. But prove each alone first; otherwise you don't have a regime-adaptive portfolio, you have a strategy zoo with no adult supervision.
VII — The trap: don't overfit the regime
A warning, because this idea is so satisfying it's dangerous. The first time you slice your journal and find the money box, your brain wants to build a detector with forty-seven conditions. Don't. Regimes are crisp in hindsight and fuzzy live — looking backward, the chart practically labels itself ("here was the trend, here was the chop"); ask where that clarity was at the hard right edge and the answer is on holiday. Live regimes are blurry, transitions are late, signals conflict, and your filter will always be imperfect.
So keep it to three gauges — direction, trend strength, volatility — which is enough to stop the worst donations. A detector that explains the past too perfectly is just overfitting wearing a lab coat. A regime filter is a pair of glasses, not a crystal ball. It helps you see the present more clearly; it does not tell you next Tuesday.
VIII — Normal drawdown vs regime change
This is the nuance that matters, and it ties straight back to The Drawdown Trap. A normal drawdown and a regime change both look like losing and both make you want to touch the system — but they demand opposite responses:
| Normal drawdown | Regime change | |
|---|---|---|
| What it is | edge still in its regime, just unlucky | edge out of season — the market left its regime |
| The tell | you're losing inside your money regime | you're losing because the regime rotated |
| The move | keep trading the rule, sized down — variance heals | stop forcing trades and wait for your regime |
One says be patient and keep betting. The other says be patient and don't. "Stick with your strategy" is correct advice in a normal drawdown and destructive in the wrong regime; "stop trading" is correct when your edge is out of season and destructive if you panic-stop a healthy edge inside its normal variance. Same losing streak, different diagnosis, opposite action — and the regime check is the divider that tells them apart.
The AI regime audit
Let AI do the slicing — not the thinking, the slicing. It can tag every trade by regime and compute the conditional expectancy you'd never work out by hand:
Here are my trades, each with: entry date/time, symbol, setup, result in R,
and price/indicator data at entry (or derive it from price).

Classify each trade's regime with simple, stated rules:
  Direction:  up-trend if price > a rising 200-MA; down-trend if below a
              falling one; range/unclear if it crosses repeatedly / flat slope.
  Strength:   trend if ADX > 25; weak/range if ADX < 20; unclear in between.
  Volatility: high if ATR is in the top 20% of its 3-month range; low if
              bottom 20%; normal otherwise.

Then output:
  1. Trade count and expectancy (avg R) IN EACH regime box.
  2. Win rate and avg win / avg loss per box.
  3. Which regime holds most of my edge, and which one bleeds.
  4. My expectancy if I had skipped my worst regime.
  5. A simple regime filter: full size / half size / flat.
  6. A warning for any box with too few trades to trust.

Do not optimize complex thresholds. Do not build a 12-rule detector.
Keep the thresholds simple and stated. Just show me where my edge lives.
The guardrail is everything: you're not asking AI to discover a magical detector, you're asking it to show where your edge has already been living. One is research; the other is curve-fit fan fiction.
The 20-minute regime audit
Minutes 0–5 — Add the column. Take your last 50–100 trades and tag each with its regime at entry — rough labels are fine ("up-trend / range / chop" plus "calm / wild"). You're sorting reality, not defending a dissertation.
Minutes 5–10 — Average each box. Compute your average R inside each regime. Don't judge yet — just measure. Even with crude buckets, a pattern almost always jumps out: one box carries the edge.
Minutes 10–15 — Find the bleed box. Identify the regime where expectancy is worst — that's where the system pays tuition. Ask what happens if you simply skip it; the improvement is often embarrassingly large, not because the entry got smarter but because the stupid trades left.
Minutes 15–20 — Write the filter. One sentence, from your own numbers:
Trade FULL size when:  price > a rising 200-MA · ADX > 25 · ATR not top-20%
Trade HALF size when:  a trend is present but ATR is in the top 20%
Stay FLAT when:        price is ranging around the 200-MA, or regime unclear
That sentence may make you more money than another entry indicator ever will.
Where this meets ProEA
"Works in all market conditions" is one of the most common claims in the EA marketplace, and it should make you suspicious, not reassured — a single strategy with a real, distributed edge in every regime is far rarer than a strategy curve-fit until the backtest stopped complaining. The honest version of a system states its regime: this is what it assumes about price, this is when it trades, this is when it sizes down, this is when it sits out. That's a thing you verify in logic, not in slogans.
This is why we sell MTR as source you can read: you can see whether the system carries a regime assumption and a filter, or whether it blindly fires in every condition and calls that "robust." That doesn't make it safe — a regime can change faster than a filter reacts, a filter can misclassify, a market can enter a state your sample never saw, and MTR can lose. A system that admits which market it needs is more honest than one that claims to need none. The question to ask any seller, ours included: in which regime does this edge live, and what does it do when the market leaves it? "All market conditions" is not an answer — it's a red flag wearing perfume.
Disclosure
We sell source and evidence you can inspect — not outcomes, not guarantees. Regime classification is approximate; moving averages, ADX, ATR and volatility percentiles describe recent or current conditions, they do not predict the next regime, and transitions are often late, blurry, and costly. A regime filter can remove trades that don't fit your edge, but it cannot turn a non-edge into an edge, and it will also remove some trades that would have won. Trading is risky, leverage magnifies risk, and past performance is not future performance. The goal is not to predict the market's mood. It is to stop taking your one good setup in the one market where it reliably loses.
Your first 20 minutes
Open your journal and add the regime column to your last hundred trades — direction and volatility, roughly. Average your R in each box. Find the box that carries your edge and the box that bleeds it. Then write one sentence: I trade full size here, half size here, and flat here. The next time your "broken" system has a bad month, you won't tear it apart or quit — you'll check the gauges and ask whether this is variance inside your season, or a market that left your season entirely. Then you'll know whether to keep betting, bet smaller, or wait. That's the point: not prediction, recognition.
The one line to take with you
Your system was never the question. The market it was trading in was. Stop asking whether your edge works. Start asking which market it works in — and only show up for that one.