Your EA went live on Monday.
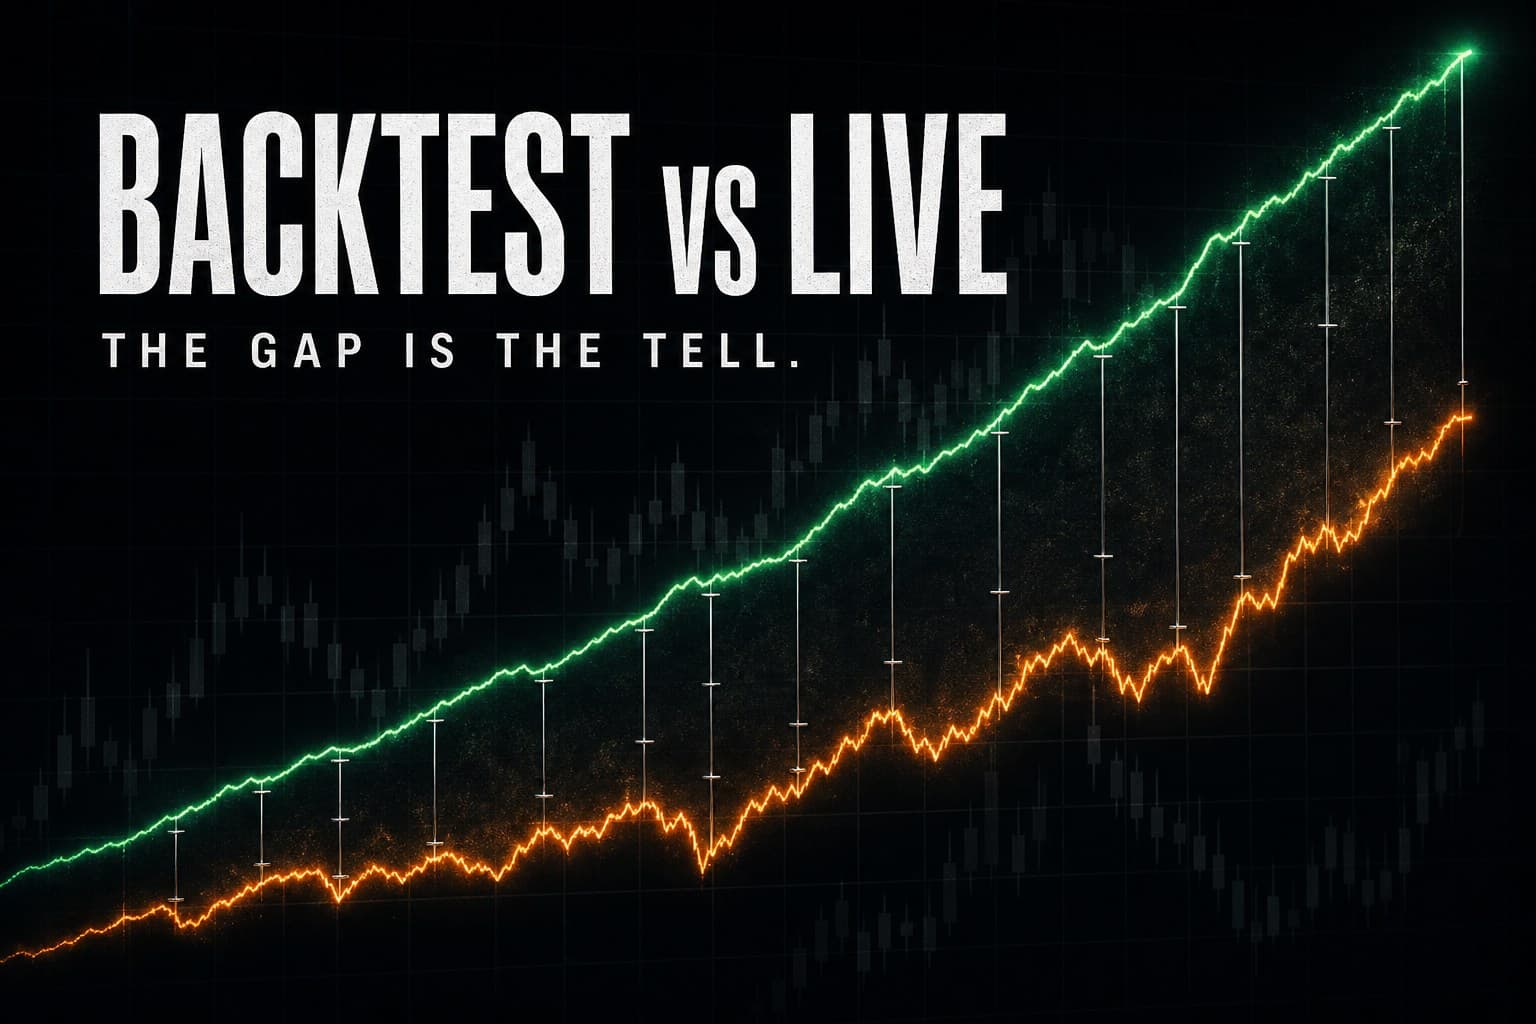
By Friday it's trailing the backtest.
Not blown up. Not broken. Just… worse. A little slower, a little heavier, a little less like the chart that convinced you.
So you do what everyone does.
You start doubting the EA.
One possible suspect. Check the evidence before choosing one.
A live/backtest gap is a diagnostic question. Neither its direction nor its cause is predetermined.The gap can contain several effects: costs, execution, changing market conditions, sampling variation, and differences between the tested and deployed code. Compare those pieces before diagnosing the system. There is no universal normal gap.
Two requests before we start:
- Save this for the day your next EA goes live and drifts under its backtest.
- Send it to one trader who's about to judge a system by week two.
The 60-second comparison
A backtest applies rules to historical data under stated execution assumptions. Live trading applies the deployed rules to a new sequence with actual fills and costs. An optimistic cost model can overstate performance, but a conservative model, a favorable regime or sampling variation can produce live results above the backtest. Compare like periods, rules and sizing where possible; label differences rather than assume one explanation.
| What traders think | What's actually true |
|---|---|
| "Live is worse — the EA is broken" | Check sampling, costs, execution, code and regime before diagnosing it |
| "A good backtest means a good EA" | A good backtest means one path looked good at modelled costs |
| "The gap should be zero" | Neither zero nor any other fixed gap is a universal target |
| "Week two tells you something" | A short sample may be inconclusive, but execution errors can still be detected immediately |
| "Sellers with perfect curves are confident" | Sellers who quantify their own gap are the confident ones |
I — The gap is arithmetic, not betrayal
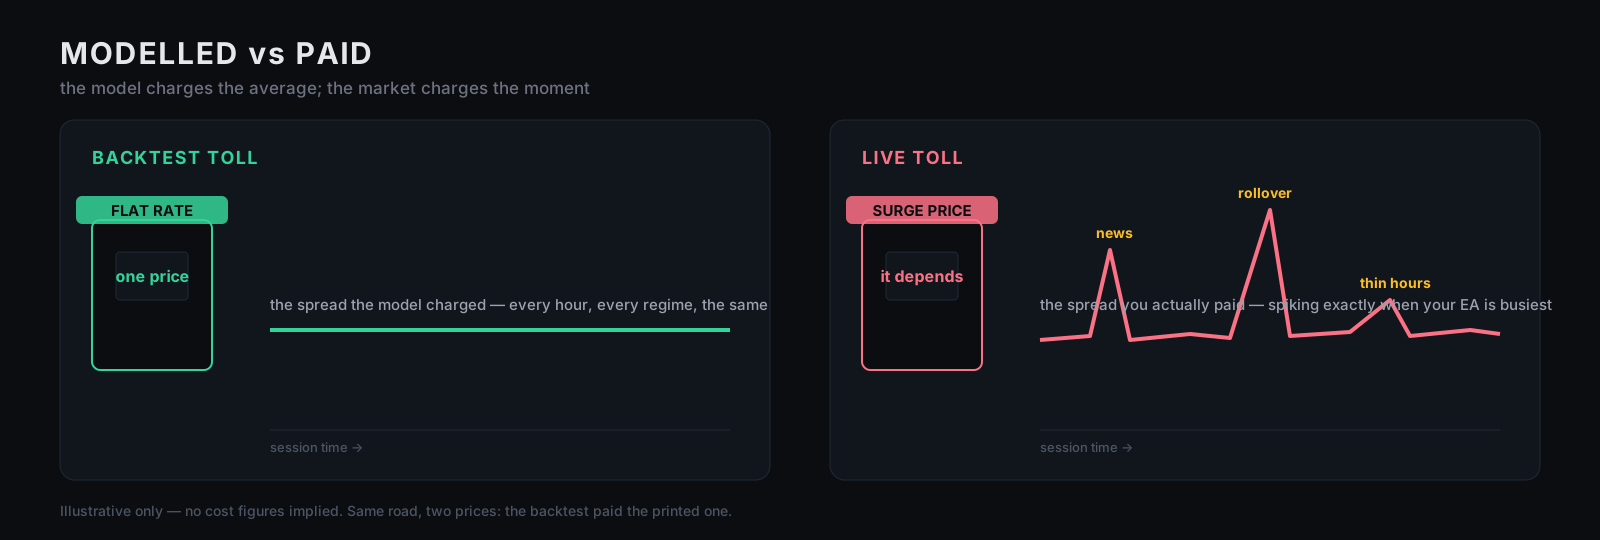
A backtest and a live account are not two attempts at the same thing. They are two different measurements. One replays the past with a cost model. The other buys the present with real fills. The difference between them decomposes into terms you can name — and once you can name them, "the EA stopped working" stops being your first theory.
We audited the report itself — the KPI grid, the screenshots, the cropped drawdowns — in Backtest Isn't Reality. This piece is about the thing the report can't hide even when it's honest: the gap.
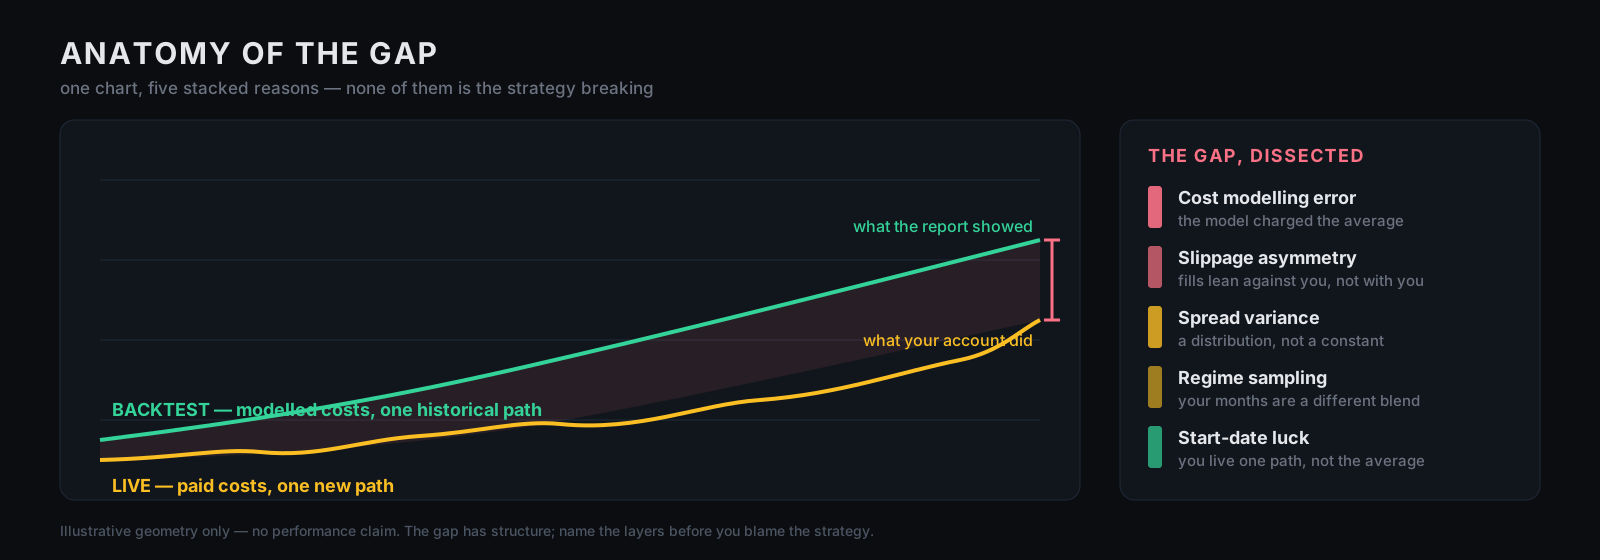
Backtest = one path × modelled costs. Live = one new path × paid costs. The gap is baked into the definitions.II — The five layers inside it
Cost modelling error. A tester may use fixed, variable or broker-recorded spreads and configured commissions. Live costs may be higher or lower than those assumptions. MT5 documents its tick modes, execution delays and cost settings; record the settings used before comparing them with paid costs.
Slippage and fills. Compare requested and filled prices by order type and market condition. Adverse slippage can erode a small edge, but its sign and distribution must be measured rather than assumed constant. Backtests can stress execution; they cannot know the exact future fill sequence.
Spread variance. If the backtest uses an average spread, check whether it represents the spreads actually paid at entry and exit. A variable-spread or real-tick model can capture more historical detail, but no historical feed determines future costs.
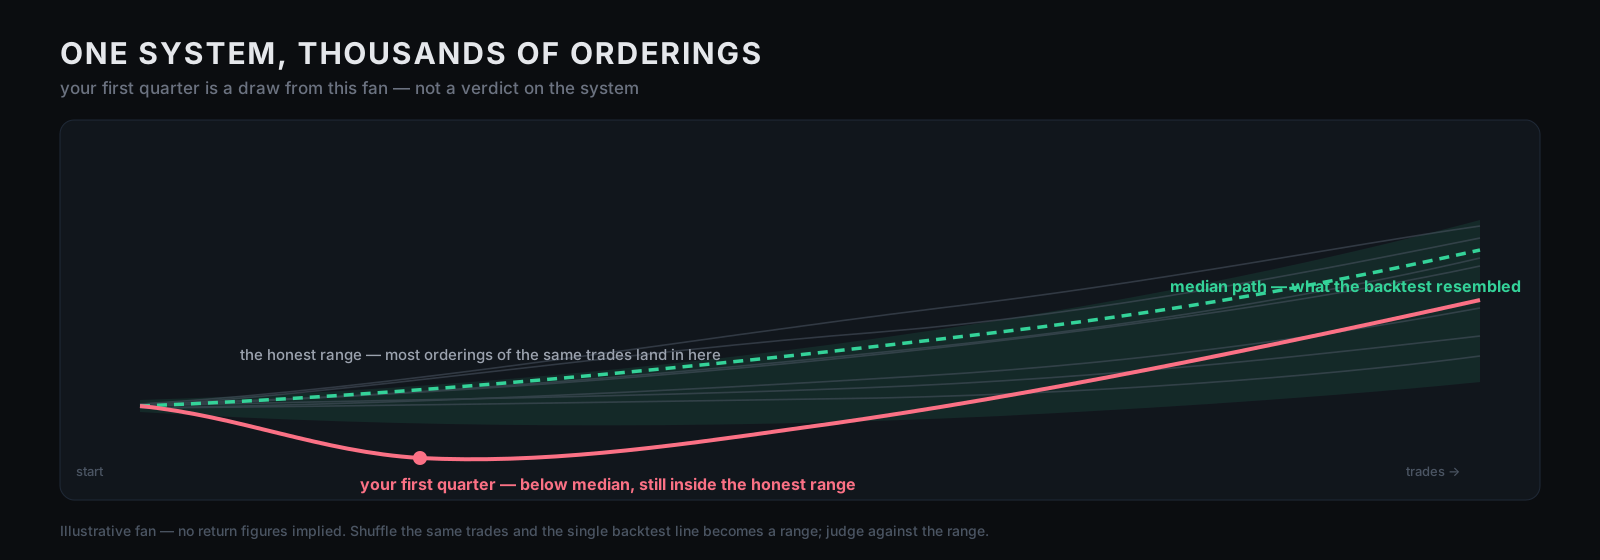
Regime sampling. The backtest window is one particular blend of trend, chop, panic, and drift. Your live months are a different blend. Even a robust edge earns unevenly across regimes; your first live quarter samples whichever regime happens to be running.
Execution reality. Latency, requotes, partial fills, a broker's server hiccup at the worst possible second. Individually negligible. Summed over hundreds of trades, a real term in the gap.
None of these five is scandalous. All five are absent from most screenshots.
III — Start-date luck: a new path, not a replay
Here's the layer traders feel most and understand least. A multi-year backtest doesn't show you your own next quarter. It shows the average texture of one long path. When you go live, you don't get the average — you get whatever three months you happened to start in. Start ahead of a drawdown the backtest recovered from, and your live account looks broken while behaving exactly to spec.
A Monte Carlo model helps explore how paths can vary under specified assumptions. Our free simulator generates simplified win/loss paths from your win rate, reward multiple and risk; it does not import and shuffle your actual trade history. Its output illustrates model sensitivity, not a calibrated live/backtest gap or a confidence interval for your EA. Different paths can occur without a broken strategy; that does not rule out a broken strategy.
IV — Compare the gap
There is no universal acceptable percentage. Compare net expectancy, drawdown, trade frequency and execution on compatible samples. A drop to half the historical expectancy can arise from sampling, a changed regime, costs, implementation differences or a weakened strategy; the ratio alone cannot choose among them.
Start with matched trade-level evidence where possible: version and settings, decision timestamps, requested orders, fills, spreads, commissions and missed trades. For different time windows, document the market and sample differences. Treat unexpectedly close results or unusually strong live results as reasons to verify records, not automatic proof of fabrication.
The Monte Carlo simulator can show the consequences of its input assumptions. It cannot define a normal live gap for a strategy whose full outcome distribution and execution process it does not model.
V — How long before you can judge?
Use the amount and quality of evidence, not a single calendar or trade-count threshold.
A short live sample may have too little information to distinguish a changed expectancy from ordinary variation. How much uncertainty remains depends on the outcome distribution, dependence and effect size. An obvious execution error can still be diagnosed on the first trade.
Plan reviews using both trade count and market coverage; there is no count or calendar window that automatically makes an expectancy comparison conclusive. Small samples and correlated trades need particular caution. Stop and investigate breached risk limits, wrong orders or implementation errors immediately rather than waiting for one hundred trades. For performance estimates, state uncertainty and compare actual observations with a model whose assumptions fit the strategy.
Assess sample uncertainty and market coverage; investigate operational failures as soon as they appear.VI — The red flags — including live doing too well
A live account can outperform its backtest because of favorable sampling, market conditions, lower costs or a conservative simulation. It can also be selectively presented. Verify account scope, dates, deposits/withdrawals, costs, versions and whether other accounts were excluded. Neither better nor worse performance alone proves honesty, fraud or an edge. The red flag is an explanation that cannot be checked.
VII — The inversion: the gap is the tell
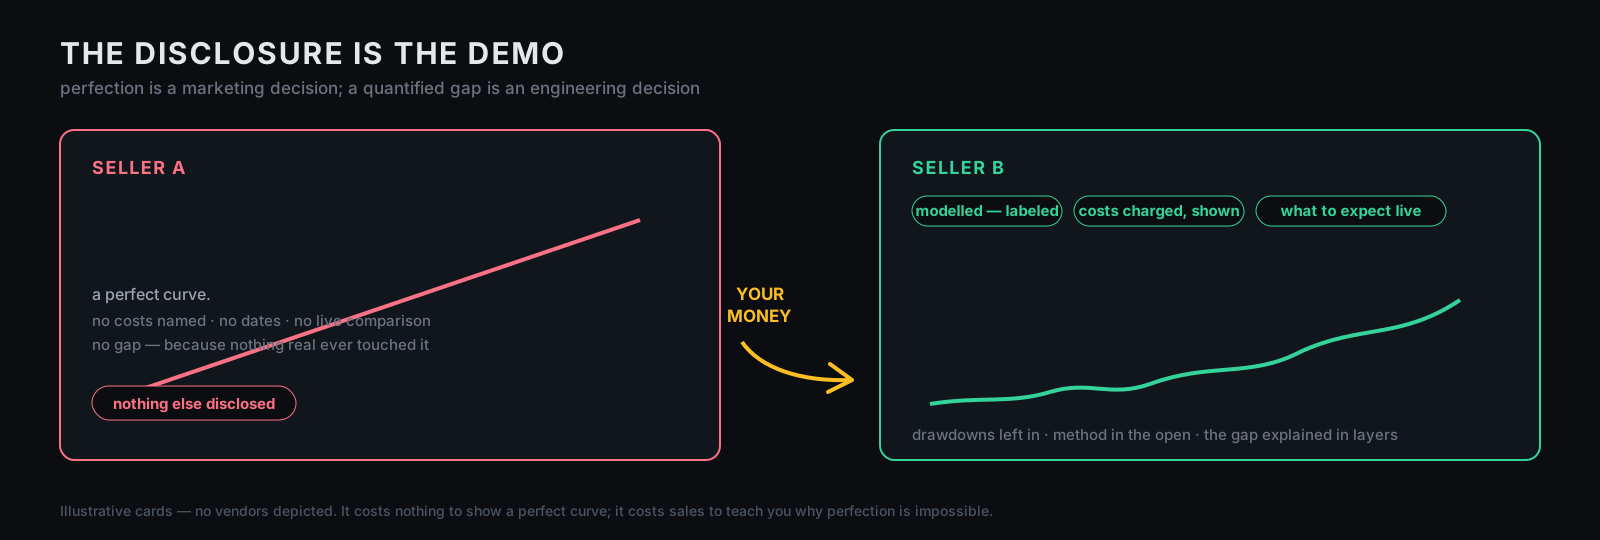
Now flip the question: can a seller show comparable records and explain the assumptions? A quantified gap is useful evidence when its inputs are inspectable. It can still be cherry-picked or mismeasured, so disclosure starts the audit rather than replacing it. Ask for the method behind the comparison, not merely two curves.
VIII — The 20-minute track-record interrogation
Minutes 0–5 — Name the costs. Find what spread/commission/slippage the backtest charged. Can't find it? That's your answer.
Minutes 5–10 — Demand both curves. Backtest and live, same instrument, dated. No live at all is honest for a new system if it's labeled as such. Live that can't be compared to the backtest is a costume.
Minutes 10–15 — Size the gap. Compare expectancy, drawdown and execution on compatible records. State which differences are explained, which remain uncertain and whether a code or premise failure needs investigation.
Minutes 15–20 — Interrogate the explanation. Ask the seller: "What gap should I expect between your backtest and my live account, and why?" Engineers answer with layers. Marketers answer with reassurance. For the rest of a seller's pitch (grid risk, "AI" claims, ratings), run the pre-buy test for forex EAs.
IX — What actually narrows it
Three practices can improve the comparison: calibrate and stress the cost model using observed conditions; keep evaluation data independent of tuning; and check that deployed code, order handling and settings match the tested system. These reduce avoidable modelling errors. They cannot remove sampling variation or guarantee that historical performance persists.
Where MTR sits
The honest ledger, because this article is also our own standard. MTR's published results are a ~29-month modelled backtest and they are labeled exactly that, on the page, in the open. We publish the method, the costs charged — cross-checked in a Rust tick simulator — and the full source: 16,923 lines you can read, because the only cure for the gap conversation is letting you inspect the premises yourself. What we will not publish is a promise about your live gap: your broker, your costs, your start date, your path. Evidence, not prophecy. Run the Monte-Carlo simulator with MTR's published trade profile or your own numbers and look at the fan of first quarters before you form an expectation — that fan is an illustration under the supplied assumptions, not a forecast of your account.
Disclosure
This is education about a measurement, not a promise about returns. Every number above is illustrative, every mechanism is checkable, and the one question worth asking any seller — including us — is the Minute-15 question: what gap should I expect, and why? If the answer isn't layers, walk.
Your first 20 minutes with the source
Open the risk module first. Find where costs enter the logic. Find the spread check before entries. Then open the backtest evidence page and read what was charged. If you can trace the cost premise from source to result in twenty minutes, you now know more about your gap than most buyers ever learn about theirs.
The backtest was never a promise.
It was a hypothesis, priced under stated assumptions.
Live is the experiment.
The gap isn't where systems fail. It's where sellers do.