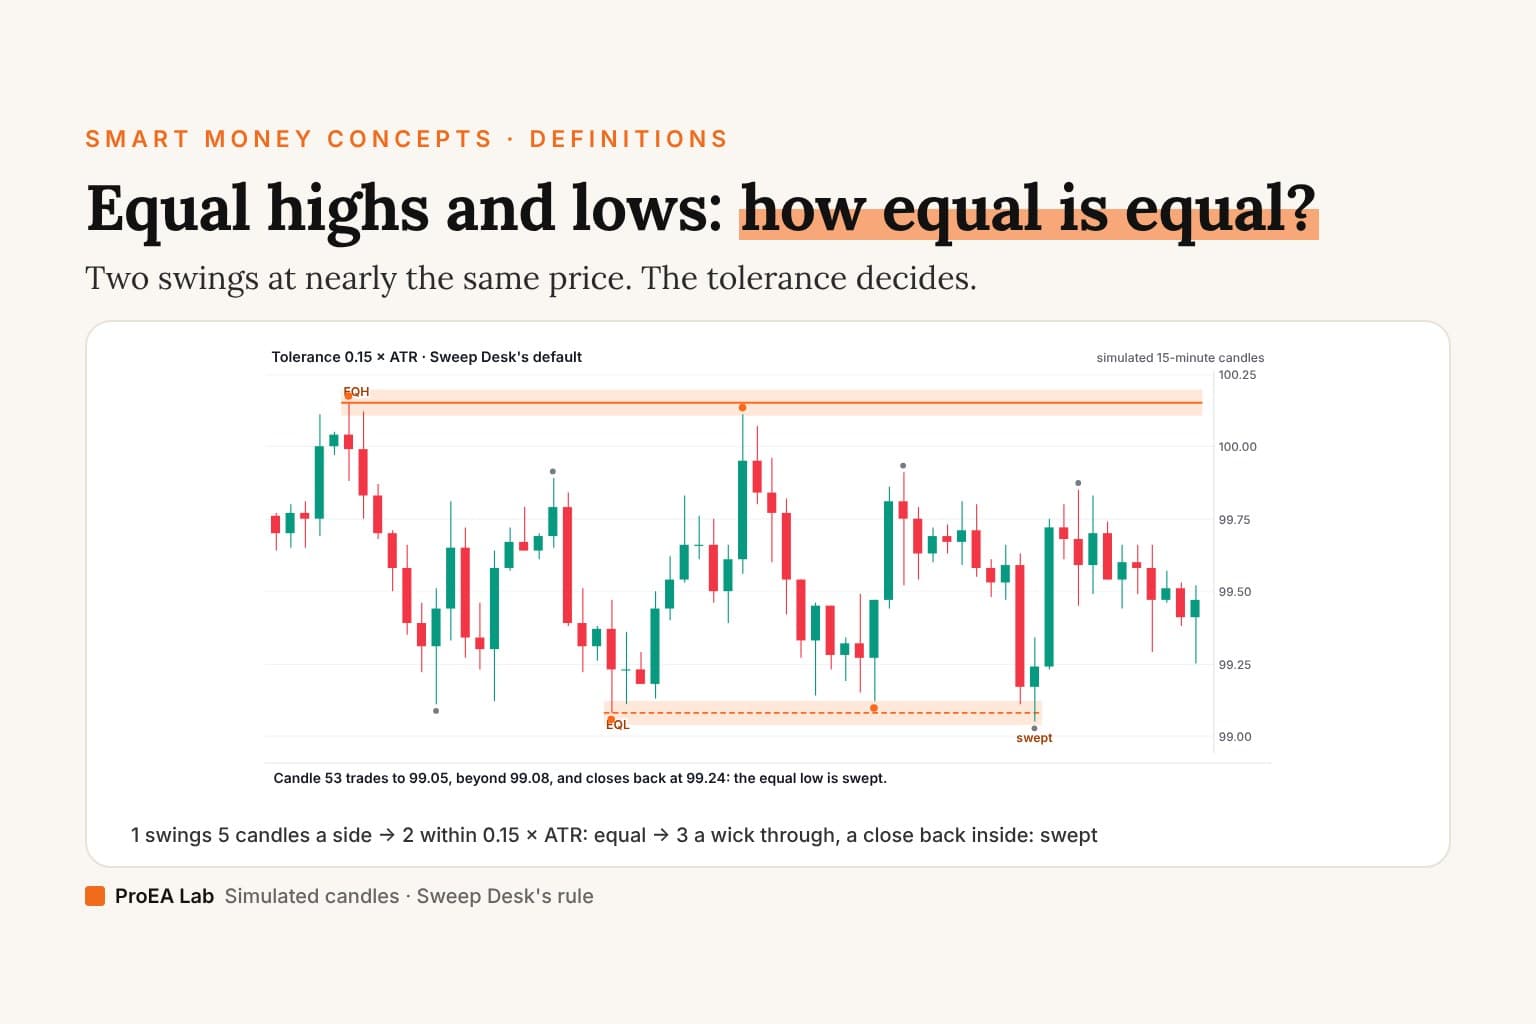
Simulated 15-minute candles, not market data (seed 487). Swings are confirmed by 5 candles on each side; the rule is our Sweep Desk's.
Read as text
- Swings 5 candles a side. Two count as equal within 0.15 × ATR(14).
- Candle 38: two swing highs 0.04 apart (100.15 and 100.11), inside 0.04: an equal high.
- Candle 47: two swing lows 0.04 apart (99.08 and 99.12), inside 0.04: an equal low.
- Candle 53 trades to 99.05, beyond 99.08, and closes back at 99.24: the equal low is swept.
How this window was chosen: Seeded simulated 15-minute candles, read by Sweep Desk's merge rule: swings 5 candles a side, a new swing joins the first resting level on its side within the tolerance × ATR(14), and a candle beyond a level ends it (a sweep if it closes back inside). The window shown is the first 64 candles after a 60-candle warm-up, on the first seed, in which at 0.15 × ATR an equal high or low forms from two swings inside the window and is then swept, the same pair is not equal at 0.05 × ATR, and 0.30 × ATR finds the same pair plus more, every pair's swings inside the window.
What counts as an equal high?
A swing high is a high above the highs of the candles around it (Sweep Desk uses 5 on each side). Two swing highs are equal when they're within your tolerance of each other. Swing lows mirror it.
LuxAlgo (checked 2026-10-08): "Equal highs are two or more swing highs stalling at nearly the same price". On tolerance: "Most traders accept highs within a few ticks (or a small fraction of ATR) of each other", and "There is no fixed tolerance."
A tolerance you don't write down is one you'll change after the fact.The rule
Equal highs and lows (Sweep Desk 2.0.0 defaults)
1. Swing: a high above the highs of the 5 candles on
   each side, known once the 5th candle after it closes.
   Swing lows mirror it.
2. Equal: when a swing is confirmed, it joins the first
   resting level on its side within 0.15 × ATR(14).
   The level is now an equal high (EQH) or low (EQL).
3. A level rests until a candle trades beyond it.
4. Swept: that candle closes back inside the level.
   Broken: it closes beyond.
In the film's window the two lows are 0.04 apart with ATR(14) at 0.28. At 0.15 × ATR the tolerance is 0.04, so they're equal; at 0.05 × ATR it's 0.01, so they aren't.
Why the tolerance matters
A tight tolerance finds almost nothing: two swings rarely stop at exactly the same tick. A loose one finds a level in every range, and a level everywhere tells you nothing. Measuring in ATR keeps the same setting meaningful on a quiet day and a busy one, and on gold and EURUSD alike. A fixed number of pips or ticks doesn't.
Use itPick one tolerance and one swing length, then mark equal highs and lows on a week of your chart.
Watch outCount how many you find. If it's one a day or ten an hour, the setting is doing the work, not the market.
What happens at an equal high or low
The level is where a liquidity sweep can happen: a candle wicks beyond it and closes back inside, like candle 53 in the film. A close beyond is a breakout candidate instead. Equal highs and lows are where to look, not a reason to trade.
Where we stand
We haven't tested equal highs or lows as a standalone rule. Our Sweep Desk (in Pine Pro Library) uses them as one kind of level among several, and what it measured is published, losses included.
Use this animation on your site.
Frequently asked questions
What are equal highs and equal lows?
Two or more swing highs (or lows) that stop at nearly the same price. Traders read them as a place where stops and breakout orders rest: above equal highs is buy-side liquidity, below equal lows is sell-side liquidity.
How close do two highs have to be to count as equal?
No published rule says. LuxAlgo's guide says there is no fixed tolerance. Our Sweep Desk uses 0.15 × ATR(14): a new swing within that distance of a resting one joins it. Write your number down, because it decides what you see.
What do EQH and EQL mean?
Equal highs and equal lows: the labels many smart money concept indicators print on such a pair.
What happens when price takes equal highs or lows?
If a candle wicks beyond the level and closes back inside, that is a sweep of it. If it closes beyond, it's a breakout candidate. What follows is the subject of the liquidity sweep guide; neither is a trade on its own.
Are equal highs a trading signal?
No. They mark a level. We haven't tested equal highs or lows as a standalone rule, and our sweep tests of the whole sequence didn't find an edge.