A liquidity sweep is a candle that trades through an obvious prior high or low and then closes back on the side it came from. The wick beyond the level is the sweep. The close back inside is what separates it from a breakout, which closes beyond the level and stays there.
The "liquidity" is an assumption about where orders rest. Stop-losses and breakout entries tend to sit just past the highs and lows everyone can see, but a candle chart can't show you those orders. So a sweep is read from price alone, and only after the candle has closed.
Traders also call it a liquidity grab, a stop run or a stop hunt. Same picture.
The wick is the easy part to see.
The close is the part you have to write down.
Until the candle closes, the same wick is a sweep and a breakout at once.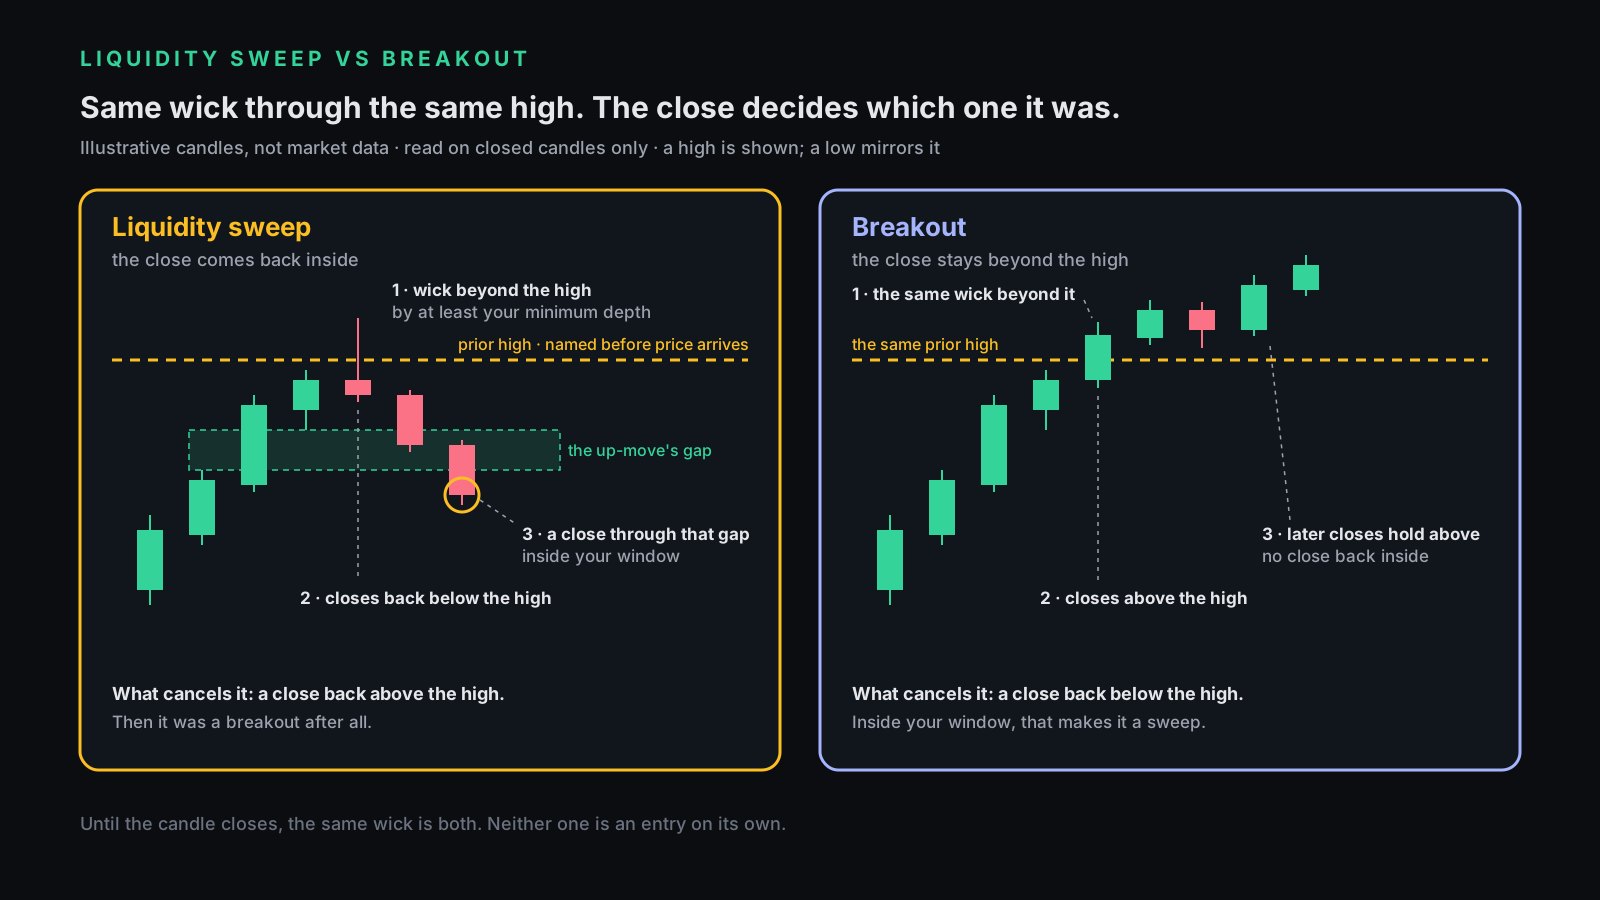
What counts as a liquidity sweep?
A sweep needs four parts: a level named in advance, a wick beyond it, a close back inside, and a deadline for that close. Drop any one of them and you can call almost any candle a sweep after the fact.
- A level named before price gets there. A confirmed swing high or low, equal highs or lows, the previous day's or week's high or low, or a session's range. A level picked after the move can be fitted to any wick, so it proves nothing.
- A wick beyond it, by a minimum depth. Decide the depth once and keep it. A candle that exactly touches the level hasn't swept it, and one that pokes a hair past is a coin toss unless your rule settles it.
- A close back on the original side. Below a swept high, above a swept low. This is the part that makes it a sweep.
- A deadline for that close. The raid candle itself, or a fixed number of candles after it. Without one, every breakout that eventually fails turns into a sweep in hindsight.
Where does the liquidity sit?
Just beyond the levels most traders can see. In ICT vocabulary, the orders above a high are buy-side liquidity and the orders below a low are sell-side liquidity.
Above a high sit the buy stops of anyone short and the buy orders of anyone waiting for the breakout. Below a low it's the mirror: long stops and breakout sells. That's why a sweep of a low that closes back above is read as a long candidate, and a sweep of a high as a short candidate.
Candidate is the right word, because the orders are assumed. Liquidity tools call these levels pools, but a pool is a price level, not a view of anyone's orders. It's an inference from where stops usually go.
Is a liquidity sweep the same as a stop hunt?
On the chart, yes: it's the same candle. "Stop hunt" adds a claim about intent, that someone pushed price there to take your stop, and a candle can't show intent.
Our Smart Money Isn't Hunting piece makes the longer case: price goes where execution is available, and a cluster of resting stops is available execution. For the definition, intent doesn't matter. The close does.
Liquidity sweep vs breakout: how do you tell them apart?
By the close, then by the next few closes. Both start with the same wick through the same level, so judge them on closed candles only and run these five checks in order.
| Check | Liquidity sweep | Breakout |
|---|---|---|
| The level | named before price arrived | named before price arrived |
| The wick | beyond the level by your minimum depth | beyond the level |
| The close | back inside the level | beyond the level |
| The next candles | a close back through the move that ran into the level, inside your window | closes keep holding beyond the level |
| What cancels it | a close back beyond the swept level | a close back inside the level |
1. Name the level first. Mark it before the candle that reaches it. If you mark it afterwards, you'll mark the one that fits.
2. Measure the wick. Set a minimum depth in advance. Our Sweep Desk uses 0.05 ATR, a twentieth of the average true range, so a wick that barely clears the level doesn't count.
3. Wait for the close. A wick beyond the level mid-candle is nothing yet. A close back inside makes a sweep candidate; a close beyond makes a breakout candidate. A finished screenshot hides how that candle looked while it was live, which is the same trap that makes indicators repaint.
4. Give the turn a deadline. A sweep only matters if price turns: a close back through the move that ran into the level. That can be a close through the fair value gap the move left behind, which inverts it, or a close beyond the last opposing swing, a structure shift. Sweep Desk allows 12 candles and wants that close at least 1 ATR from the sweep's extreme.
5. Write down what cancels it. A sweep followed by a close back beyond the swept level was a breakout after all. Gold Sweep Desk ends the setup on exactly that close; Sweep Desk cancels on a close more than 1 ATR back through the level. And a breakout that closes back inside within your deadline was a sweep.
These rules are dull on purpose. Every one of them can be checked by someone else on the same chart, and every one gets skipped when the chart already shows the answer.
Run the five checks without squinting. Sweep Desk is our free liquidity sweep indicator for TradingView. It marks the levels, waits for the closed candle, and names the reason when a raid doesn't become a plan. Copy the Pine source, paste it into the Pine Editor and use it today: MIT, no signup.
Is every liquidity sweep a trade?
No. A sweep starts a sequence: you still need the turn, an entry, a stop past the sweep's extreme and a target. In our own count, almost none of the sweeps got that far.
The count comes from the free Sweep Desk at its defaults, on OANDA:XAUUSD 15-minute candles, the 6,101 candles from 30 June to 1 October 2026. It found 280 raids that closed back inside. Of those, 105 were confirmed by a close through an opposing gap a full ATR away, and 4 passed its 60-minute gate to become plans.
280 sweeps, 4 plans. That's a count of what one written rule lets through, not a result.
The one part a sweep does hand you is the stop: just past the sweep's extreme, because if price trades back beyond it, the idea was wrong. Both of our sweep tools put it at the extreme plus a tenth of an ATR.
Trading gold? Gold Sweep Desk applies the same sweep-and-flip idea to gold's own day: yesterday's high and low, the Asia range and the London range as the levels, sweeps counted only in the London and New York windows, and the plan written out in New York time. Free source, MIT.
Check it on your own chart in ten minutes
- Pick one market and one timeframe. Before you scroll, mark yesterday's high and low and the last few confirmed swing highs and lows.
- Step forward one candle at a time with TradingView's Replay (availability varies by plan and timeframe), or cover the right side of the chart. Each time a wick crosses a marked level, wait for the close and write sweep or breakout.
- For each sweep, note whether the turn came inside your window. For each breakout, note whether the closes held.
- Count both columns. That ratio is your market's, on your rules, with the misses left in.
Disclosure
We build Sweep Desk and Gold Sweep Desk and give both away under MIT; we sell other indicators. Nothing here is financial advice, and no sweep rule on this page, ours included, has a validated edge.
The one question to ask anyone selling a sweep: what has to happen after the sweep, within how many candles, and what did that rule do on the chart you didn't show me?