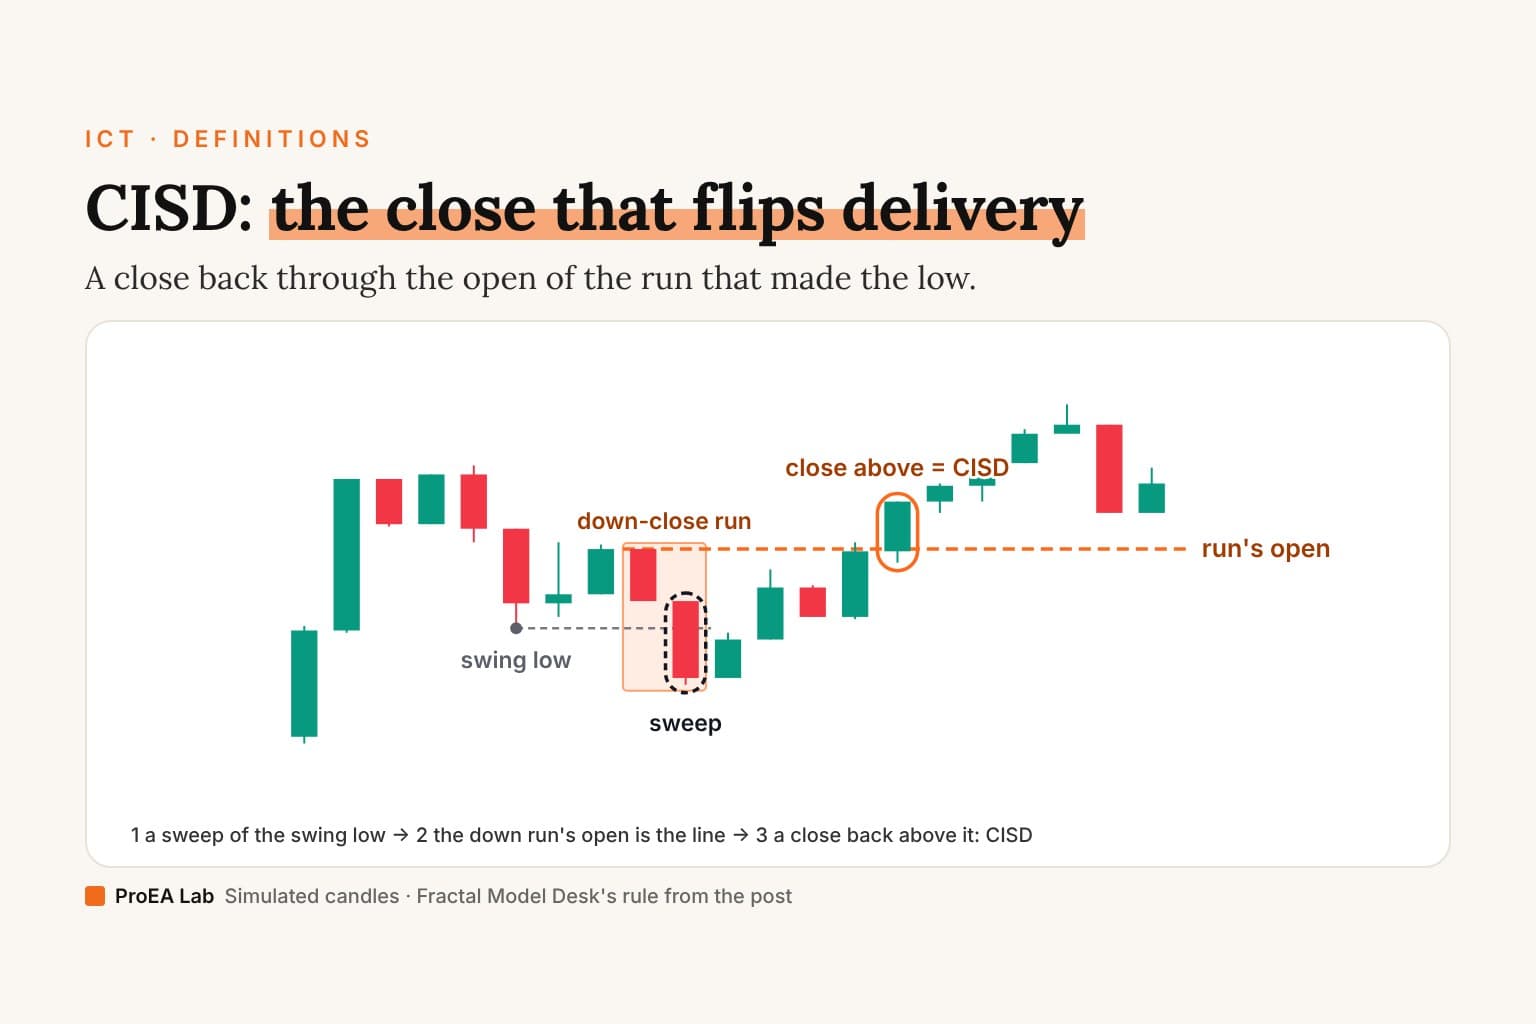
A change in state of delivery (CISD) is a closed candle that finishes beyond the opening price of the run of opposite candles that made the latest high or low. After a swept low, it's the first close above the open of the down-close run that printed the low; after a swept high, the first close below the open of the up-close run that printed the high. That is the rule our Fractal Model Desk uses on the lower timeframe, after a higher-timeframe candle sweeps the last one's high or low.
The line isn't a swing high or low. It's where the last run of candles began.
No close through the run's open, no CISD, however far the wick went.What is CISD (change in state of delivery)?
"Delivery" is the direction price is travelling. A run of down-close candles is price delivering lower. A close above the price that run started from gives the whole run back: delivery has changed state.
TTrades, whose Fractal Model is built on it, defines it in Understanding The Change in State of Delivery (CISD), published 29 June 2025 (checked 2026-10-07): "Bearish to Bullish: Price forms a series of down-close candles, then closes above the opening price of those candles." And: "When there are multiple candles, the key level to watch is the opening price of the first candle in the sequence."
To draw the same line twice, the desk adds three decisions:
- The run that made the extreme. Consecutive candles whose bodies point the same way, ending at the candle that printed the swept low (or high). A doji ends a run. Until the CISD prints, each new low moves the line to the run behind that low.
- Strictly beyond, on a closed candle. A close exactly on the run's open is not a CISD, and the live price never is.
- The first CISD freezes the line and the extreme. If price later trades beyond the frozen extreme (a wick, by default; a close, optionally), the CISD is marked failed and kept on the record.
The films below read one chart, so their sweep is a wick past the last confirmed swing low (or high), swings confirmed by 3 candles on each side, and the CISD must close within 16 candles of it. The desk's own sweep is a higher-timeframe candle's; the line is drawn the same way.
Simulated 15-minute candles, not market data. Swings are confirmed by 3 candles on each side; the sweep is a wick past the last one. A CISD needs a close strictly beyond the run's open.
Read as text
- A swing low prints at 146.17, confirmed when the 3 candles on its right have closed (21:30).
- At 21:45 a candle's wick trades to 145.92, below the swing low: the sweep. The down-close run that delivered price into it is 2 candles long; its first candle opened at 146.52. That open is the line.
- At 22:45 a wick trades above 146.52 and the candle closes below it: a wick is no CISD.
- At 23:00 a candle closes at 146.73, strictly above 146.52: the CISD, 5 candles after the sweep. The run into the low has been given back on a close.
- The line and the low (145.92) freeze here. If price traded below 145.92 later, this CISD would be marked failed, not redrawn.
How this window was chosen: The first 80-candle window of the simulated market in which a confirmed swing low at least 8 candles in is swept at least 20 candles in, by a wick at least a fifth of an average candle range below it, on a down-close candle that stays the low, the run into it at least 2 candles long and its open at least 0.6 of an average candle range above the low, and the CISD closes 1 to 8 candles after the low. The film ends 6 candles after the CISD.
Use itMark the run's open the moment the sweep candle closes. Then the next closes either pass it or they don't.
Watch outA lower low on a new run moves the line. Redraw it before you read the next close, not after.
A worked example: drag the close
From the desk's beginner lesson, in made-up prices on 5-minute candles inside 1-hour ones. C1, the 08:00 hour, ranged from 100 to 136. The 09:00 candle opened at 111 and closed down at 108; the 09:05 candle closed down at 102, with a wick to 96, below C1's low: the sweep. That down run opened at 111, so 111 is the line. The 09:10 candle closed at 112: a CISD, recorded at 09:15. The hour closed at 116, inside 100 to 136, recorded at 10:05.
We added one swing high, at 118, so you can see where an MSS line would sit. Move the 09:10 candle:
CISD. No MSS yet.
The close, 112.0, is strictly above 111, the open of the down run into the low: delivery has changed state. 118 is still above: no MSS yet. The run's open sat closer to the low, so its close came first. That is the lesson's 09:10 candle, recorded at 09:15, when it closed.
Made-up prices from Fractal Model Desk's beginner lesson; the swing high at 118 is ours, added to show the MSS line. 5-minute candles.
Anywhere between 111 and 118, you get a CISD and no MSS. That gap between the two lines is the whole difference between them. In the lesson's failure case, a wick reaches 95 by 09:20, below the frozen low of 96: the CISD at 111 is marked failed and stays on the record.
CISD vs MSS: which close comes first?
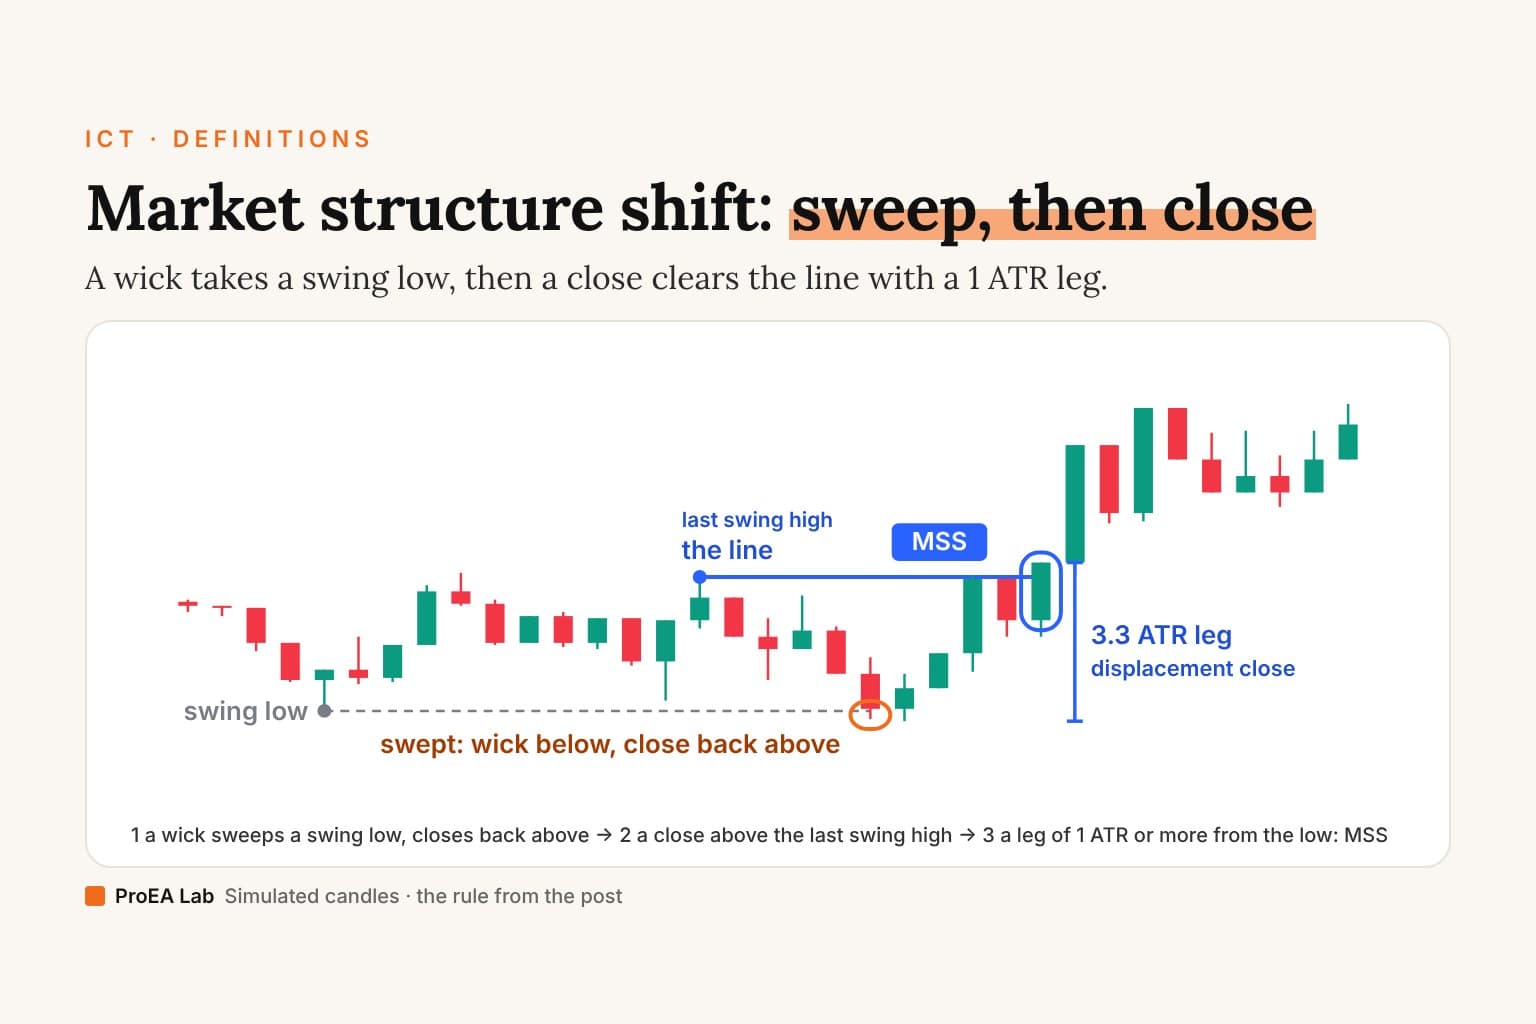
The one whose line is closer. A market structure shift (MSS), a break of structure (BOS) and a change of character (CHoCH) all close through a confirmed swing high or low. A CISD closes through the open of the run into the extreme, which usually sits closer to it.
TTrades' comparison, Market Structure Shifts vs Change in the State of Delivery, published 1 July 2025 (checked 2026-10-07): an MSS "happens when price displaces and closes above or below a swing high or swing low"; a CISD "focuses on the opening price in the series of up-close or down-close candles." In our BOS vs CHoCH terms, an MSS is a CHoCH made with displacement.
Simulated 15-minute candles, not market data. Swings are confirmed by 3 candles on each side; the sweep is a wick past the last one. The MSS here is the first close beyond the last confirmed swing the other way; displacement is not required.
Read as text
- A swing low at 92.83 is swept at 08:15. The low the rule freezes at the CISD is 92.46.
- Two lines now wait for a close. The CISD line: the open of the down-close run into the low, 92.74, 0.28 from the low (it moved once as new lows came from new runs). The MSS line: the last confirmed swing high, 93.15, 0.69 from the low.
- At 09:30 a close at 92.81 passes the run's open: the CISD. The MSS comes 2 candles later, at 10:00, when a close passes 93.15.
- Why the CISD came first: its line sat 0.41 closer to the low, so a smaller move back was enough.
How this window was chosen: The first window in which a swing low swept at least 20 candles in (by a wick at least a fifth of an average candle range below it) gets its CISD and, at least 2 candles later and within 16 candles of the sweep, an MSS (a close above the last confirmed swing high), with no trade below the frozen low in between. The film ends 4 candles after the MSS.
How often each comes first depends on where the lines sit, so we counted it in the films' simulated market: 364 days of 15-minute candles. Of 631 sweeps that got both a CISD and an MSS within 16 candles, the CISD closed first in 408, both on the same candle in 203, and the MSS first in 20. Those counts come from random prices with nobody behind them; they show the geometry of the two lines, not an edge.
TTrades on the trade-off: "CISD can give earlier entries but sometimes too early, leading to false signals, MSS is slower but often more conservative." Earlier means a closer line and a smaller stop, and more closes that turn out to be noise.
| CISD | MSS | |
|---|---|---|
| After a swept low, the close goes through | the open of the down run into the low | the last lower high (a confirmed swing) |
| Usually comes | first, or on the same candle | later |
| Ours that draw it | Fractal Model Desk | none by that name; Signal Desk labels BOS and CHoCH |
TTrades also says a close beyond that open "validates the level as an order block." That's broader than our order block rule, which needs a close beyond a confirmed swing. A zone closed back through while structure breaks the other way is read from the other side: a breaker block.
How does a CISD confirm a sweep (the fractal model sequence)?
It's the middle of three steps. A higher-timeframe candle sweeps the last one's high or low (liquidity sweep), a lower-timeframe CISD shows the move into the sweep was given back, and the higher-timeframe candle closes back inside.
TTrades treats them as two checks that both have to pass (How Change in the State of Delivery (CISD) Confirms Swing Points, published 10 January 2026, checked 2026-10-07): "CISD on its own means nothing to me unless it is paired with a higher time frame candle closure." And: "A swing point is not valid simply because liquidity is swept."
In Fractal Model Desk, the CISD can come while C2 is still open, or in C3, never first in C4. C2 must then close strictly inside C1's range, or C3 must hold C2's extreme and close beyond both of C2's body prices, with the CISD in that same candle. Its delivery review adds adjustable checks: a close at least 0.05 ATR past the line, plus a V (at most 3 candles from the extreme) or displacement (a body of at least 0.8 ATR and 60% of its range). TTrades wants "A clean V-shaped reversal or strong displacement" and gives no numbers.
The sequence as our study coded it, on simulated 15-minute candles inside 4-hour ones:
Simulated 15-minute candles, not market data, run through the study's rule. Setup 1 is the first setup whose trade reaches C1's far side, so every step shows; Another setup plays the rest in order, whatever they did. R is after a 0.40 round-trip cost.
Read as text
- C1, the four-hour candle, closes at 12:00 UTC: high 2394.41, low 2382.89.
- 12:15: a candle of C2 trades below C1's low. A long setup starts.
- 15:30: a 15-minute close above 2386.36, the open of the run of down candles that made the low (2377.80).
- C2 closes back inside C1's range: the swing is confirmed.
- 16:00: entry at 2390.96, stop 2377.80, target 2394.41 (C1's high).
- 19:30: the target fills at 2394.41: +0.23R after a 0.40 round-trip cost.
Drop the CISD and keep only the higher-timeframe close, and the skeleton is candle range theory (CRT). Put it on a clock, the Asian range instead of C1 and a close back through the midnight open instead of the CISD, and it's ICT's Judas swing.
A bearish CISD mirrors all of it: C2 trades above C1's high, the run is up-close candles into the high, the CISD is a close below that run's first open, and it fails when price trades above the frozen high. Neither is a buy or sell signal; in the desk, even a review isn't a trade.
Which timeframes work for CISD?
Any pair where the higher timeframe is bigger. Fractal Model Desk pairs them itself: a 1-minute chart reads 15-minute candles, 5-minute reads 1-hour, 15-minute reads 4-hour, 1-hour reads daily, 4-hour reads weekly. A pair set by hand must line up: each chart candle inside one higher-timeframe candle.
After costs, our study found "it only goes down, and the shorter the timeframe the faster": a 5-minute stop is small next to a normal spread. Check your clock too: TradingView starts gold's 4-hour candles at 17:00 New York, not 18:00. Our study assumed 18:00, caught it and re-ran; the 36 4-hour versions were still 0 of 36 above zero in every period.
Does CISD work?
The definition still reads a chart cleanly: which candle swept which, where the run began, whether the close came back. Whether trading it pays after costs is a separate question; our tested answer so far is no.
Common mistakes
- Calling it on the wick. Only the close counts.
- Drawing the line from the wrong run. Use the run that made the extreme, not the one that gives the nicer line. Our own v1 defaulted to the latest run after it looked better on 38 EURUSD trades (profit factor 2.03 against 0.92). Thirty-eight trades prove nothing; v2 ties the line to the run that made the extreme.
- A CISD with no sweep, or no higher-timeframe close. A close through a run's open mid-range is just a candle; if C2 closes outside C1 and C3 doesn't rescue it, the early CISD confirmed nothing.
- Moving the line after it froze. A new low after the first CISD is a failed CISD, not a new line.
- Treating CISD and MSS as one signal. Trade the CISD and you've chosen the earlier, noisier one on purpose.
The rule, in plain words
CISD rule (Fractal Model Desk 2.1.0)
1. Sweep: a higher-timeframe candle (C2) trades
   strictly past the last closed one's (C1's) low
   (bullish) or high (bearish).
2. The run: on the lower timeframe, the consecutive
   down-close candles that made C2's low (up-close
   candles for a high). A doji ends a run. A new,
   lower low moves the pending line to its own run.
3. The line: the open of the run's first candle.
4. CISD: a closed lower-timeframe candle finishes
   strictly above the line (bullish) or strictly
   below it (bearish). On the line: no CISD.
5. When: inside C2 (early) or in C3, never first
   in C4.
6. Frozen: the first CISD fixes the line and the
   extreme. Price beyond the extreme afterwards
   (a wick, by default) = CISD failed, kept on record.
7. Confirmed: C2 closes strictly inside C1 with its
   CISD in C2, or C3 holds C2's extreme and closes
   beyond both C2 body prices with its CISD in C3.
   A CISD without that close confirms nothing.
The sweep, the run's open, the close through it and the higher-timeframe close are TTrades'. The doji rule, the strict inequalities, the freeze, the failure rule, the C3 body test and the deadline are ours, so two charts give the same answer.
Which tools draw CISD?
See every CISD on your own chart: Fractal Model Desk, in Pine Pro Library. Set View to Audit and each raw CISD is labelled "CISD observed" at the candle that closed through the line, and "CISD failed" if the frozen extreme breaks later. Focus, the default, shows only the two latest setups that passed the delivery review. Full Pine v6 source, in the library.
The desk also boxes the first fair value gap after the CISD, as context, not an entry. Fractal Model Lab, in the same library, is the strategy with the study's 108 settings, including an Early CISD entry. New to Pine? How to add a Pine script to TradingView. For an MSS or CHoCH, Signal Desk, also in the library, labels BOS and CHoCH on closed candles.
Every ICT model on one page, in learning order: ICT concepts. The structure and liquidity vocabulary underneath it: smart money concepts.
Disclosure
We build Fractal Model Desk, Fractal Model Lab and Signal Desk and sell them in Pine Pro Library, alongside our other indicators. Fractal Model Desk is our own automation of public TTrades material, not TTrades' indicator, and we have no relationship with TTrades. Nothing here is financial advice.
Use these animations on your site.
Frequently asked questions
What is CISD in trading?
A change in state of delivery (CISD) is a closed candle that finishes beyond the opening price of the run of opposite candles that made the latest high or low. After a swept low, it's the first close above the open of the down-close run that printed the low.
What is the difference between CISD and MSS?
The level the close goes through. An MSS closes through a confirmed swing high or low; a CISD closes through the opening price of the run of candles into the extreme, which usually sits closer to it, so a CISD usually comes before an MSS and sometimes on the same candle.
Does a wick through the line count as a CISD?
No. A wick back through the line is not a CISD; only the close is. In Fractal Model Desk, a close exactly on the run's open isn't one either.
Which candle's open is the CISD line?
The open of the first candle in the run that made the extreme. Fractal Model Desk counts consecutive candles whose bodies point the same way, ending at the candle that printed the swept low or high; a doji ends a run.
How does a CISD confirm a liquidity sweep?
It's the middle of three steps: a higher-timeframe candle sweeps the last one's high or low, a lower-timeframe CISD shows the move into the sweep was given back, and the higher-timeframe candle closes back inside. A CISD without that close confirms nothing.
When does a CISD fail?
When price later trades beyond the frozen extreme: on a wick, by default, or on a close, optionally. The first CISD freezes the line and the extreme, so a new low after it is a failed CISD, not a new line, and the desk keeps it on the record.
Which timeframes work for CISD?
Any pair where the higher timeframe is bigger. Fractal Model Desk pairs them itself: a 1-minute chart reads 15-minute candles, 5-minute reads 1-hour, 15-minute reads 4-hour, 1-hour reads daily and 4-hour reads weekly.
Does CISD work?
We haven't tested CISD on its own; we tested it inside the Fractal Model, 108 versions on seven markets from January 2018 to September 2026, and nothing passed. The 5-minute textbook version averaged −0.004R per trade before costs over 83,460 trades, and costs then took about 0.17R from every trade.