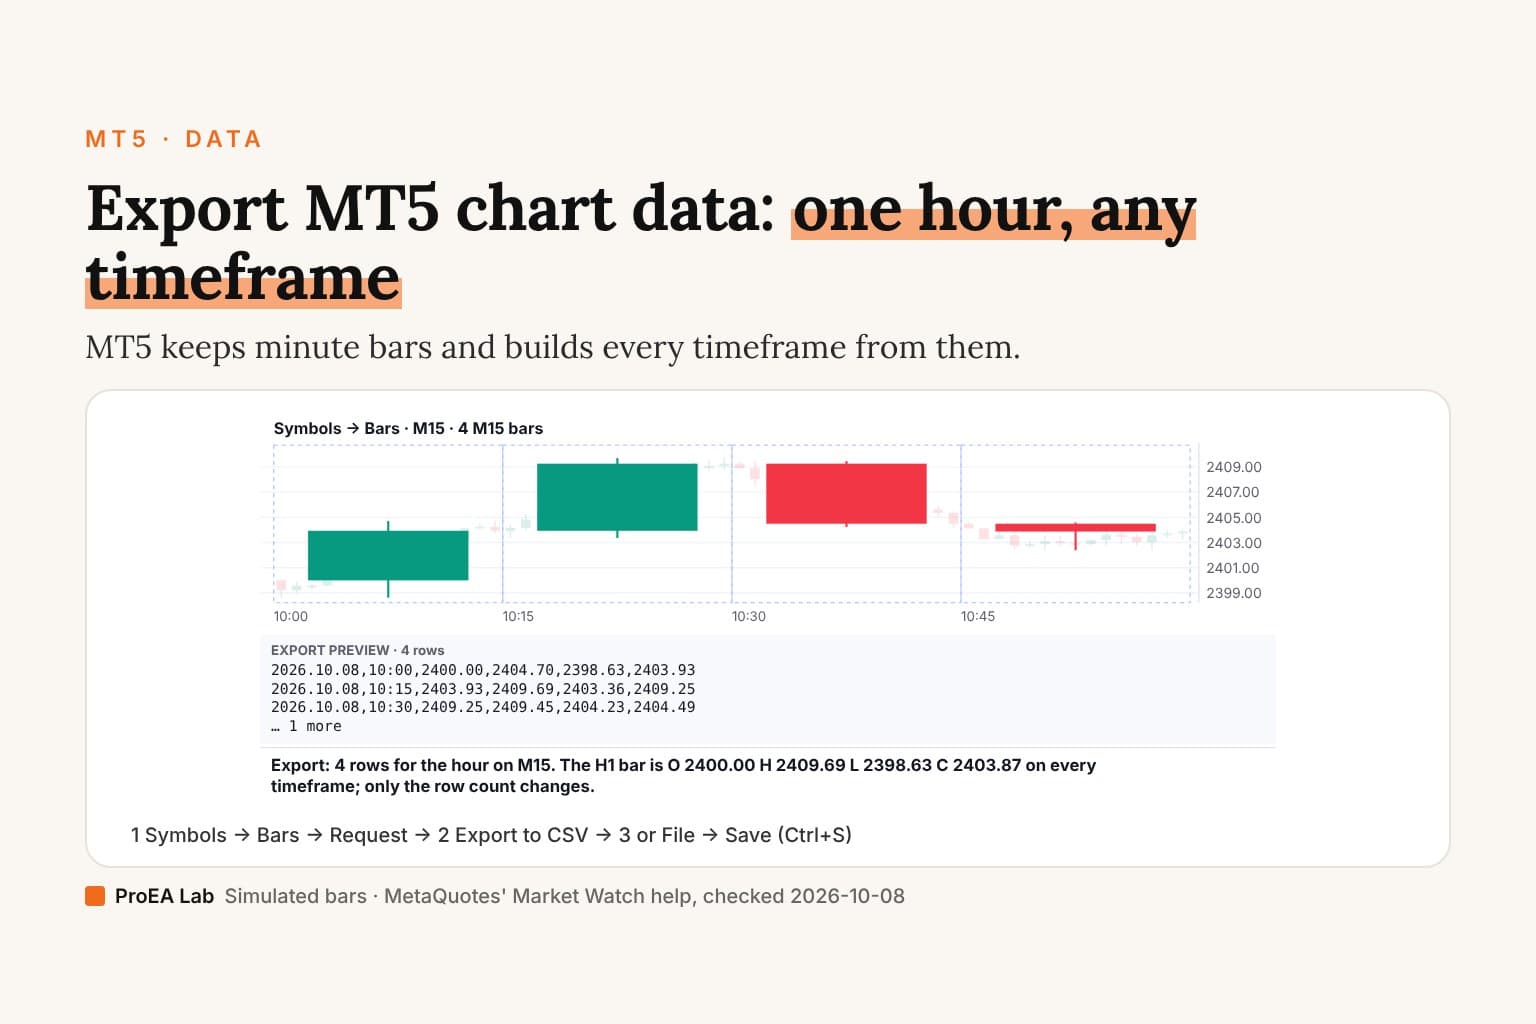
Simulated minute bars, not market data. The preview shows only date, time and OHLC; the date is illustrative.
Read as text
- Request: MT5 downloads the symbol's history as 1-minute bars. Here, one simulated hour, 60 bars.
- M15: the terminal rebuilds every 15 minute bars into one, first open, highest high, lowest low, last close.
- Export: 4 rows for the hour on M15. The H1 bar is O 2400.00 H 2409.69 L 2398.63 C 2403.87 on every timeframe; only the row count changes.
How this window was chosen: MT5 stores the whole quote history as minute bars and calculates other timeframes from them; Request downloads the history once, and the number of bars it downloads is capped by "Max bars in chart". From the MT5 help on Market Watch, checked 2026-10-08. A timeframe's bar takes the first open, highest high, lowest low and last close of its minutes.
Two routes to a CSV
All from MetaQuotes' Market Watch help and hot keys, checked 2026-10-08.
| You want | Route | Notes |
|---|---|---|
| The bars on this chart | File → Save, or Ctrl+S | CSV, PRN or HTM |
| Bars for any symbol and timeframe | Market Watch → right-click → Symbols → Bars → Request → Export | Downloads from the broker's server first |
| Raw ticks | Same window, Ticks tab → Request → Export | Large; start with a short range |
Your closed trades are a different export: that's the History tab, covered in how to export MT5 trade history.
Why the bar count is short
MT5 stores the whole quote history as minute bars and calculates the other timeframes from them, so switching timeframe doesn't change the download. "The maximum number of downloaded bars is limited by the 'Max bars in chart' parameter". It's under Tools → Options → Charts, and it takes effect after a restart (settings).
Use itRaise Max bars in chart, restart, then Request again before exporting a long history.
Watch outThe export only holds what the terminal downloaded.
Reading the tick flags
Each exported tick carries a flags number that says what changed. The values add up (Market Watch help, checked 2026-10-08):
| Flag | The tick changed |
|---|---|
| 2 | Bid |
| 4 | Ask |
| 8 | Last deal price |
| 16 | Volume |
| 32 | A buy trade made it |
| 64 | A sell trade made it |
So 6 is Bid and Ask, and 24 is last price and volume.
Same minutes underneath, whatever timeframe you export.The prices are your broker's, on its server clock: see MT5 server time before you line the file up with another source.
Use this animation on your site.
Frequently asked questions
How do I export chart data from MT5?
For the chart you're looking at, File → Save (Ctrl+S) saves its bars as CSV, PRN or HTM. For a chosen symbol and timeframe, right-click Market Watch → Symbols, open the Bars tab, pick the timeframe, click Request, then Export.
How do I export tick data from MT5?
Same window, Ticks tab: pick the symbol, Request, then Export. Ticks are large and slow to download, MetaQuotes warns, so start with a short range.
Why does my MT5 export have fewer bars than I expected?
The number of bars MT5 downloads is capped by "Max bars in chart" (Tools → Options → Charts). Raise it, restart the terminal as the setting requires, and request again.
What do the numbers in the tick FLAGS column mean?
They add up: 2 the Bid changed, 4 the Ask, 8 the last deal price, 16 the volume, 32 a buy trade, 64 a sell trade. 6 means Bid and Ask both changed, per MetaQuotes' Market Watch help.
Does exporting a higher timeframe download different data?
No. MT5 stores the whole history as minute bars and calculates every other timeframe from them, so the download is the same; the export just has fewer, wider rows.