From statement file to a checked export
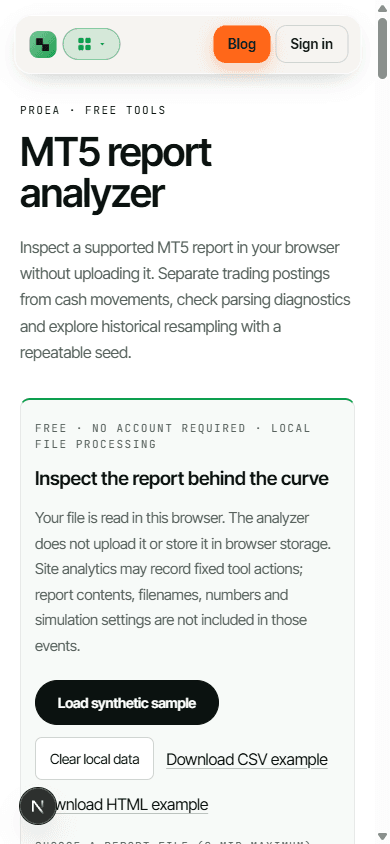
Import an English MT5 HTML table or a transaction CSV. Other CSV headings open a column mapper: choose the separator, decimal format, row type and whether the result already includes costs. Review the accepted rows, enter the opening balance and compare a statement closing balance. Download the normalized postings and row issues, or keep the full audit as JSON. Matching totals are a useful cross-check; review the period and any excluded rows as well.
A complete closed-position table can also produce a CSV draft in the free journal template’s column order. Initial risk, stop, target and R remain blank for your own records. Execution deals, unallocated fee rows or incomplete position details need further review before they can become journal trades. The free workflow processes one file in memory; ongoing journal storage and account sync are separate TradeLens features.
What an MT5 report can tell you
A report is a record of selected account activity. This analyzer adds accepted monetary postings, separates external cash movements and computes a realized balance path. It cannot prove the file came from a broker, identify whether an account was live or demo, or reproduce missing executions. Its default sample is fabricated teaching data. Use your own complete export to investigate a specific trading period, and reconcile the starting balance and final totals with the original statement before making any decision.
Deals, positions and cash are different records
One position can involve multiple execution deals. Entries, partial exits and reversals do not correspond one-to-one with complete trades, and commissions can be recorded before an exit. If an HTML report contains both Deals and Positions, this tool uses Deals alone to avoid counting the same activity twice. It reports the unit being counted and includes recorded costs instead of presenting an execution count as a trade win rate. A report containing only closed Positions cannot reveal entry-time costs or cash operations omitted from that table.
Deposits and withdrawals change account balance without being trading profit. The performance path excludes classified cash rows, while the account path includes them. Broker-specific adjustments need inspection: a row labelled balance might be a funding movement or a manually posted cost. Classify ambiguous rows explicitly in the CSV mapper. Blank required amounts are errors rather than assumed zeros; an absent cost column needs your explicit zero-cost confirmation. Unsupported or duplicate rows are reported for review.
Realized drawdown does not measure floating risk
Drawdown is the fall from the running peak to a later balance. The performance drawdown shown here uses the chosen opening balance plus recorded non-cash outcomes. Its denominator is each running peak, so changing the opening balance changes the percentage. Floating P/L between postings is absent. A strategy could suffer a much larger intratrade equity loss, or violate a daily loss rule, even if its closed balance path looks modest. Do not use this figure as certification that an account passed a broker or prop-firm rule.
A seeded bootstrap asks a limited question
The simulation asks what arithmetic paths arise if the observed monetary postings are drawn again under a selected sampling rule. Each path starts with the same stated balance; recorded amounts are added without scaling position size. A fixed seed makes the draws repeatable. Individual draws assume independent postings. Blocks retain short sequences, but new block boundaries break longer dependencies and edge observations receive less weight. Loss magnitudes or market regimes absent from the observed sample are not generated by this method.
The displayed percentiles summarize simulated paths, not confidence bounds for your future account. A profitable sample can remain favorable under resampling while being unrepresentative of future markets. Missing fees, different lot sizing, changing volatility and margin rules are outside the calculation. Compare several block lengths as a sensitivity check and review the original sequence alongside the simulation. The tool does not label its below-start frequency as a probability of future profit or ruin.
Local processing and export
The analyzer reads your selected file into browser memory and does not send it to an analysis server or persist it in local storage. Clear local data removes it from the tool state. CSV exports contain accepted normalized postings; JSON exports include diagnostics, methods and any current simulation. Files you download remain on your device until you remove them. Share an export only after checking it for private account identifiers or symbols you do not want to disclose.
Format references: MetaTrader 5 table-based trading report and MQL5 deal properties. Platform documentation explains the source record types; the supported parser subset and sampling assumptions are defined above.
Why “Every tick based on real ticks” can disagree with your other tests
If an Expert Advisor's Strategy Tester report looks smooth under 1 minute OHLC or Every tick but loses money or skips trades under Every tick based on real ticks, check two things:
- Real spreads instead of a bar's spread: in Every tick mode MT5 builds each tick's ask from the minute bar's fixed spread. Real ticks (stored by month in
bases\[server] icks\[symbol]\as.tkcfiles) carry the spread as it was, including the widening around the daily rollover and news, which can hit stops or bring10016rejections the other modes never show. - Months without real ticks: where a minute bar has no real ticks, the tester generates that minute's ticks the way Every tick does, and the Journal says so (for example “real ticks absent for N minutes… every tick generation used”). Read the Journal before trusting a long real-tick test.
To see how filling modes, spread filters and session guards are written in a full gold EA, MTR FullSystemEA ships its whole source: 21 MQL5 files, 16,923 lines, nothing obfuscated.
MT5 file extensions (.html, .csv, .mq5, .ex5, .set)
MetaTrader 5 uses different file types for account reports, source code, compiled programs and input presets. Only the statement exports (.html and .csv) can be read by this analyzer:
.html/.htmand.csv(account and Strategy Tester reports): trade history and deal exports, read here in your browser, or imported into the TradeLens journal to keep every account's history in one place..mq5(MQL5 source): editable source code, opened in MetaEditor (F4in MT5)..ex5(compiled MQL5 program): the file MetaEditor builds from an.mq5; it goes inMQL5/ExpertsorMQL5/Indicatorsto run on a chart..set(input preset): a plain-text list of an EA's input values (lot sizing, stop distance, session hours), loaded with Inputs → Load in the Strategy Tester or the EA's settings.