Download the free trading journal template as an Excel workbook (.xlsx) or a CSV for Google Sheets. The workbook has three sheets: a Trades log with eighteen columns, a Summary that computes win rate, expectancy in R, profit factor and the plan-followed split, and a Read me. Upload the .xlsx to Google Sheets to keep its formulas; the CSV carries only the columns and three example rows. Delete the rows marked EXAMPLE, then log one row per closed trade. No email, no account.
The sheet answers one question: what does an average trade earn per unit of risk, and does that change when you break your own rules? Every formula is visible, and every number on the Summary traces back to a row you typed.
A journal template is only as honest as its Risk column. Write down what you planned to lose before entry, and the sheet can do the rest of the arithmetic.Watch the sheet count in R
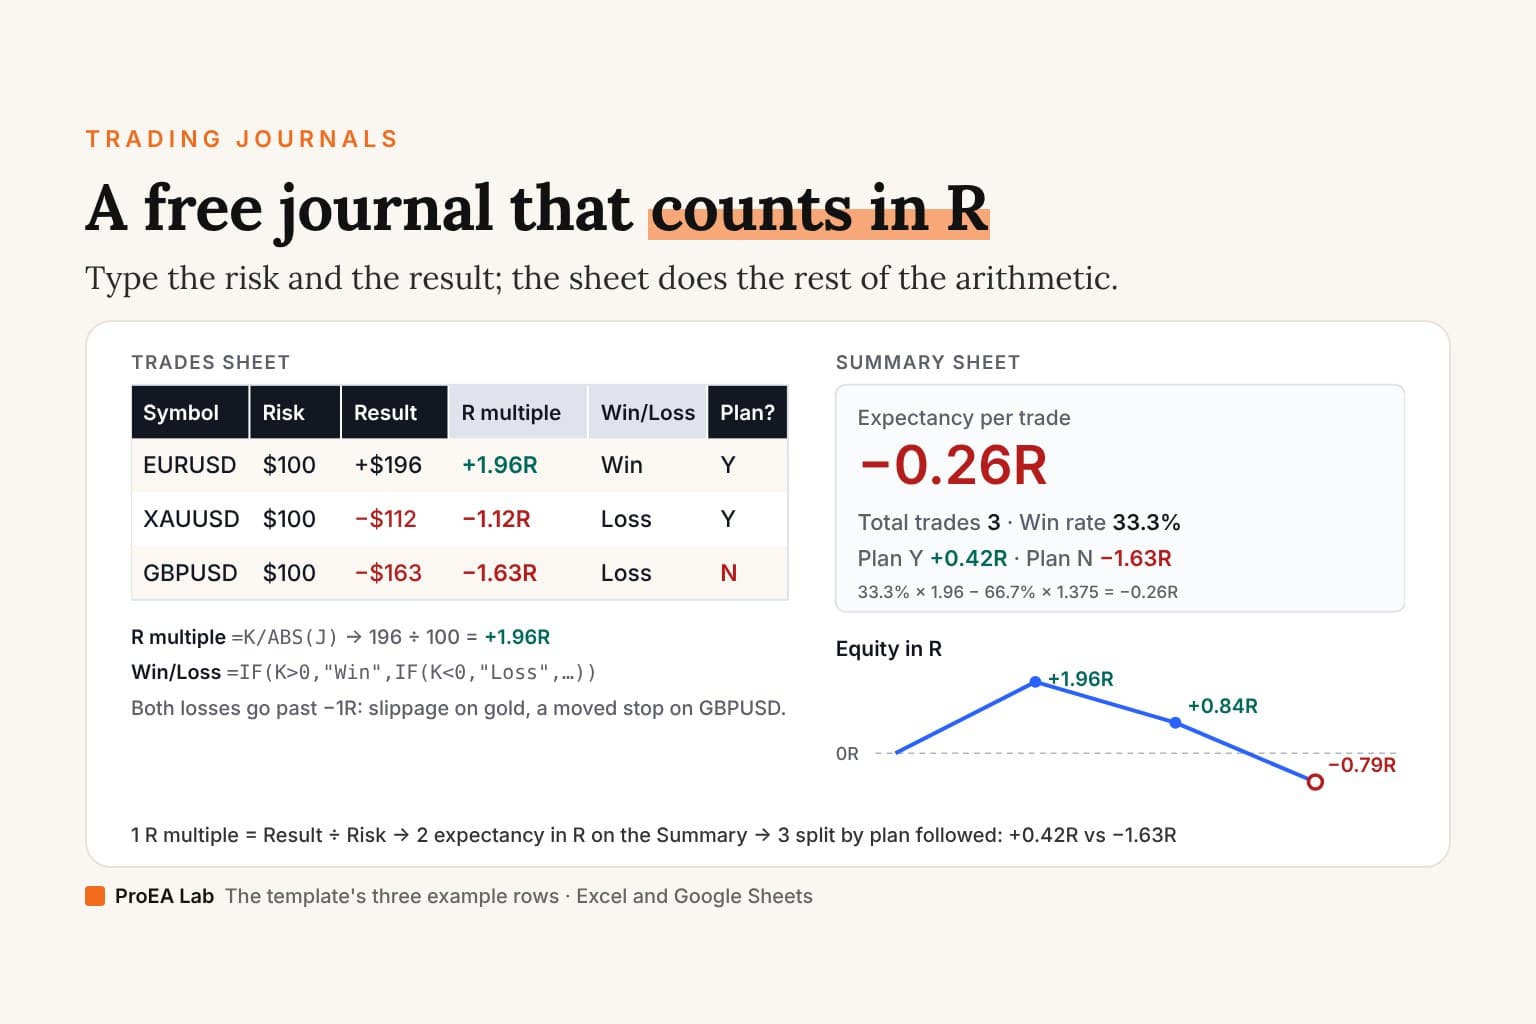
Rows 1–3 are the template's EXAMPLE rows, fabricated as the file says. Rows 4–20 are simulated, not market data and not a trading result: invented to show the arithmetic over more rows. The formulas are the workbook's own.
Read as text
- Row 1 (template example): EURUSD, risk $100, result +$196. R multiple 196 ÷ 100 = +1.96R, Win, plan followed.
- Row 2 (template example): XAUUSD, risk $100, result −$112. R multiple -112 ÷ 100 = −1.12R, Loss, plan followed.
- Row 3 (template example): GBPUSD, risk $100, result −$163. R multiple -163 ÷ 100 = −1.63R, Loss, plan broken (Moved stop).
- Summary after 3 rows: win rate 33.3%, average win +1.96R, average loss −1.38R, expectancy −0.26R per trade (the average R, −0.26R, agrees); plan followed +0.42R, plan broken −1.63R; profit factor 0.71; equity −0.79R, or −$79 in dollars.
- Row 4 (simulated): EURUSD, risk $100, result −$170. R multiple -170 ÷ 100 = −1.70R, Loss, plan broken (Moved stop).
- Row 5 (simulated): XAUUSD, risk $150, result +$295. R multiple 295 ÷ 150 = +1.97R, Win, plan followed.
- Row 6 (simulated): EURUSD, risk $100, result −$103. R multiple -103 ÷ 100 = −1.03R, Loss, plan followed.
- Row 7 (simulated): EURUSD, risk $50, result −$52. R multiple -52 ÷ 50 = −1.04R, Loss, plan followed.
- Row 8 (simulated): GBPUSD, risk $50, result −$52. R multiple -52 ÷ 50 = −1.04R, Loss, plan followed.
- Row 9 (simulated): USDJPY, risk $150, result +$294. R multiple 294 ÷ 150 = +1.96R, Win, plan followed.
- Row 10 (simulated): EURUSD, risk $100, result +$196. R multiple 196 ÷ 100 = +1.96R, Win, plan followed.
- Row 11 (simulated): EURUSD, risk $50, result −$52. R multiple -52 ÷ 50 = −1.04R, Loss, plan followed.
- Row 12 (simulated): XAUUSD, risk $100, result −$201. R multiple -201 ÷ 100 = −2.01R, Loss, plan broken (Oversized).
- Row 13 (simulated): USDJPY, risk $150, result −$266. R multiple -266 ÷ 150 = −1.77R, Loss, plan broken (Moved stop).
- Row 14 (simulated): USDJPY, risk $100, result −$112. R multiple -112 ÷ 100 = −1.12R, Loss, plan followed.
- Row 15 (simulated): EURUSD, risk $150, result +$296. R multiple 296 ÷ 150 = +1.97R, Win, plan followed.
- Row 16 (simulated): GBPUSD, risk $100, result −$166. R multiple -166 ÷ 100 = −1.66R, Loss, plan broken (Oversized).
- Row 17 (simulated): XAUUSD, risk $50, result −$51. R multiple -51 ÷ 50 = −1.02R, Loss, plan followed.
- Row 18 (simulated): EURUSD, risk $50, result −$51. R multiple -51 ÷ 50 = −1.02R, Loss, plan followed.
- Row 19 (simulated): GBPUSD, risk $50, result +$99. R multiple 99 ÷ 50 = +1.98R, Win, plan followed.
- Row 20 (simulated): USDJPY, risk $150, result +$297. R multiple 297 ÷ 150 = +1.98R, Win, plan followed.
- Summary after 20 rows: win rate 35.0%, average win +1.97R, average loss −1.32R, expectancy −0.17R per trade (the average R, −0.17R, agrees); plan followed +0.36R, plan broken −1.75R; profit factor 1.08; equity −3.42R, or +$122 in dollars.
How this window was chosen: Rows 1–3 are the template's own EXAMPLE rows. Rows 4–20 are simulated (seed 1) with no edge built in: risk of $50, $100 or $150; four rows in five follow the plan, and of those a third reach +2R and the rest lose 1R, before fees of 2–5% of the risk (a loss sometimes slips a further 0.1R). A broken-plan row is a moved stop (a loss of 1.4R to 1.8R), an early exit (+0.3R to +0.8R) or an oversized trade (a loss of 1.5R to 2R). Results are rounded to whole dollars and run through the template's formulas.
Rows 1–3 are the template's own example rows. The film holds where your Summary should land after an import: 3 trades, a 33.3% win rate and −0.26R expectancy. If your copy shows anything else, the import broke a formula.
Then switch to Count in dollars. The same 20 rows end at +$122 in dollars and −3.42R in R, because the winners happened to be the $150-risk trades. Dollars reward size; R scores the decision. Rows 4–20 are simulated with no edge built in, so the arithmetic is the point, not the result.
What's in the trading journal template?
The Trades sheet has eighteen columns and 500 pre-formatted rows, with the header frozen and dropdowns on Direction and Followed plan?. You type into the dark-header columns; the two grey columns are formulas.
| Column | What you enter | Why it matters |
|---|---|---|
| Date | The day the trade closed | The weekly review groups by date |
| Symbol | EURUSD, XAUUSD, as your platform names it | Finds the instrument that keeps costing you |
| Direction (Long/Short) | Pick from the list | Some traders only make money one way |
| Setup / reason | One name from a fixed menu, plus a few words, written before entry | A closed menu groups; free text doesn't |
| Entry, Stop, Target, Exit | Prices | Stop means the initial stop you sized from |
| Size (lots) | Lots | Shows whether size followed your rule |
| Risk (account currency) | Planned loss at the initial stop, as a positive number | The denominator of every R figure |
| Result (account currency) | Net result after commission, swap and fees | What actually happened |
| R multiple | Formula: Result ÷ Risk | Makes trades of different sizes comparable |
| Win/Loss | Formula: Win, Loss or Breakeven | Feeds win rate |
| Fees | Commission and swap charged, as a positive number | Already inside Result; shows the cost drag |
| Followed plan? (Y/N) | Pick from the list | Splits your record into the system and the rule breaks |
| Mistake tag | A short tag from a fixed list: Moved stop, Early exit, Oversized | Counts the repeat offender |
| Notes | One line | The context you'll want on Sunday |
| Screenshot link | A link to a chart image | Images inside cells make the file heavy |
Two design choices matter. Result is net: commission, swap and fees are already subtracted, so every R multiple is a net R multiple, the convention in count R, not money. The Fees column only shows what costs took. Risk is fixed at entry: if you move your stop, Risk stays what you planned, so a moved stop shows up as a loss bigger than −1R, which is exactly what you want the sheet to catch.
The Summary sheet holds 23 formulas in three blocks (Results, Plan discipline and Data checks), each with a "how it's calculated" note. The Read me sheet repeats the column definitions, the Risk formula and the MT5 mapping, so the file makes sense without this page.
The five numbers to review every week
An R multiple is the result divided by the risk you planned: risk $100, make $196, and the trade is +1.96R. It makes a 0.10-lot trade and a 2-lot trade comparable, which dollars never do. The template's three example rows:
| Example row | Risk | Result | R multiple | Followed plan? |
|---|---|---|---|---|
| EURUSD long, target hit | $100 | +$196 | +1.96R | Y |
| XAUUSD short, stopped with $0.50 slippage | $100 | −$112 | −1.12R | Y |
| GBPUSD long, stop moved, then closed | $100 | −$163 | −1.63R | N |
Both losses are bigger than 1R for different reasons. The gold trade paid slippage and fees, the ordinary cost of trading. The GBPUSD trade had its stop moved, a rule break. In dollars they're two bad days; with R and a plan flag, they're two different problems.
- Expectancy per trade (R) = win rate × average win R − loss rate × |average loss R|. On the examples: 33.3% × 1.96 − 66.7% × 1.375 = −0.26R, the same as the plain average R (−0.79R ÷ 3). The Summary shows both; if they disagree, a trade is missing its Risk. The trading expectancy calculator adds a per-trade cost and the break-even win rate.
- Plan followed vs plan broken. The two Y trades average +0.42R; the one N trade is −1.63R. If Y is positive and N negative, the method may be fine and the leak is behaviour. If Y is negative too, more discipline won't rescue the method.
- Largest loss in R. Here −1.63R. Any loss beyond −1R means slippage, costs, a gap or a moved stop came between the plan and the fill. Read that row's mistake tag.
- Profit factor = gross wins ÷ |gross losses| = $196 ÷ $275 = 0.71. It's in dollars, so position size moves it: in the film's 20 rows it reads 1.08 while expectancy is negative. Read it beside expectancy, not instead of it.
- Total trades. Here 3, which tells you how much to believe the other four: not at all. Even a few dozen trades leave a wide range of plausible win rates; the risk-of-ruin calculator shows how much variance a real edge can produce.
Win rate (33.3% here) is context, not a target. A low win rate with large winners can be positive; a high one with large losers can bleed.
How do I use it in Google Sheets?
Upload the .xlsx: it's the version with the formulas, the Summary and the dropdowns. Download trading-journal-template-v1.xlsx, open a blank spreadsheet, choose File → Import → Upload, select the file and pick Replace spreadsheet (or Create new spreadsheet).
Then check the Summary reads 3 trades, 33.3% and −0.26R. The formulas use only functions Excel, Google Sheets and LibreOffice share (IF, IFERROR, COUNT, COUNTIF, SUMIF, AVERAGEIF, AVERAGE, MIN, ABS, N). We verified the results in LibreOffice but didn't test every Sheets locale, so the check is worth its 30 seconds.
The CSV route gives you the eighteen columns and three example rows as plain values: no Summary, no formulas. For R multiple and Win/Loss, paste these into L2 and M2 and fill down:
=IF(OR(J2="",K2=""),"",IFERROR(K2/ABS(J2),""))
=IF(K2="","",IF(K2>0,"Win",IF(K2<0,"Loss","Breakeven")))
If your Sheets locale writes decimals with a comma, the CSV's numbers may arrive as text; the .xlsx avoids that. In Excel, open the .xlsx. Rows 2 to 501 are pre-formatted; for more, copy the last row down, and the Summary still reads whole columns.
How do I fill it from MT5?
Export first: Toolbox → History, right-click the list, choose the period, then Report (full walkthrough, Mac included). Then copy each closed position from the report's Positions table:
| Template column | From the MT5 report |
|---|---|
| Date | Close time |
| Symbol | Symbol |
| Direction (Long/Short) | Type: buy is Long, sell is Short |
| Entry | Opening price |
| Stop | Your initial stop. The report's S / L column may show the stop as it was last set |
| Target | T / P |
| Exit | Closing price |
| Size (lots) | Volume |
| Result | Profit + Commission + Swap |
| Fees | The commission and swap charged, as a positive number. A swap credit lowers it |
| Risk | Not in the report. Work it out, below |
Risk is the one number you calculate: the distance from entry to initial stop, times what a 1.00 price move is worth on one lot, times your lots. On EURUSD in a USD account, a 20-pip stop on 0.50 lots is 20 × $10 per pip per lot × 0.50 = $100. On XAUUSD with a 100-ounce contract, a $5.00 stop on 0.20 lots is 5 × 100 × 0.20 = $100; check your broker's contract size first. The forex position size calculator and the pip value calculator do the pip arithmetic for any pair.
MT5 can't give you the setup, the plan flag, the mistake tag or the reason: fill those yourself, ideally on the day. A position closed in parts gets one row with the combined result, and deposits or withdrawals never go in Result. Before copying, the free MT5 report analyzer checks in your browser that the statement is complete.
Spreadsheet or journal app?
Both are legitimate. TradeLens, the journal we sell, is the app example here because it's the one whose claims we can check line by line.
| Spreadsheet (this template) | Journal app (TradeLens, as one example) | |
|---|---|---|
| Price | Free | Paid; current prices are on the TradeLens page |
| Getting trades in | You type or paste each row | Imports MT4, MT5 and CSV files |
| Automatic sync | None | Cloud edition only: syncs closed trades via a read-only investor password. The download edition imports files |
| Setup, plan flag, notes | Yes; the columns are yours | You still type these; no import knows why you entered |
| Analysis | The Summary sheet; slicing by setup or session means building a pivot table | Breakdowns by session, symbol and setup, leaks priced in dollars, and an AI coach that explains the computed numbers |
| Changing the formulas | Anything; it's your file | What the app computes; TradeLens ships its source if you code |
| Portability | One file that opens almost anywhere | Depends on the export; our check of TradeLens's trade CSV found it leaves out notes and planned risk |
A spreadsheet is free, transparent and yours, and typing each trade forces you to look at it. An app earns its place when capture breaks (you trade often enough that typing decays into skipping) or when you want the analysis done daily without building it. Until then, the spreadsheet is the right tool. The portability row comes from a test we ran on our own export, in the one-time-purchase piece.
What should a trading journal include?
At minimum, five things: the risk you planned (so R exists), the result net of costs, a setup name from a fixed menu, a yes/no plan flag, and a one-line reason written before entry. Everything else (symbol, direction, prices, size, a mistake tag, a screenshot) is context for reading those five. Why those five do the work is argued in how to journal forex trades; more guides live under trading journals.
For most traders a spreadsheet is enough. Its limits are practical: manual entry gets skipped on busy or losing days, there's no sync, slicing takes a pivot table, and the Summary's two data checks (the expectancy cross-check and a count of trades missing their Risk) catch the commonest errors, not all of them.
Where we sit
We sell TradeLens, a trade journal with an AI coach that imports MT4, MT5 and CSV history. This template is the manual version of the same method: free, no email gate, no expiry. If the spreadsheet is enough for you, that's a good outcome, not a lost sale.
The example rows are fabricated; their prices are illustrative. The template only summarises what you enter: it doesn't connect to your broker, check your entries, or tell you whether a strategy has an edge, and nothing in it is financial advice. On 7 October 2026 we recalculated the workbook in LibreOffice: every Summary formula matched independently computed values, for the example rows and for an empty sheet, with zero formula errors. If the file disagrees with this page, email support@pulltrade.app and we'll fix whichever is wrong.
Your first 20 minutes: download the .xlsx, check the Summary reads −0.26R, then delete the three example rows. Write your setup menu (three to seven names) and your mistake tags; only those words go in their columns. Backfill your last five closed trades from your MT5 history, Risk column included, and look at the Summary.
The spreadsheet can't make you honest. It can make honesty cheap: one row, sixty seconds, every trade.Use this animation on your site.
Frequently asked questions
Is the trading journal template free?
Yes. Download it as an Excel workbook (.xlsx) or a CSV for Google Sheets: no email, no account, no expiry.
How do I use the trading journal template in Google Sheets?
Upload the .xlsx with File → Import → Upload to keep its formulas, Summary sheet and dropdowns. The CSV carries only the eighteen columns and three example rows as plain values, with no Summary and no formulas.
What should a trading journal include?
At minimum, five things: the risk you planned, the result net of costs, a setup name from a fixed menu, a yes/no plan flag, and a one-line reason written before entry. Everything else, such as symbol, direction, prices, size, a mistake tag and a screenshot, is context for reading those five.
How do I calculate the R multiple of a trade?
Divide the net result by the risk you planned at entry: risk $100, make $196, and the trade is +1.96R. The template's R multiple column is the formula Result ÷ Risk.
How does the template calculate expectancy?
Win rate × average win R − loss rate × |average loss R|. On the three example rows that's 33.3% × 1.96 − 66.7% × 1.375 = −0.26R, the same as the plain average R, which the Summary shows as a cross-check.
Can I fill the template from MT5?
Yes: export your history from Toolbox → History, then copy each closed position from the report's Positions table. Risk isn't in the report, so work it out: the distance from entry to initial stop, times what a 1.00 price move is worth on one lot, times your lots.
Is a spreadsheet good enough for a trading journal?
Yes, for most traders: a journal's value comes from the columns and the weekly review, not from the software. The limits are practical: manual entry gets skipped on busy or losing days, there's no sync, and slicing takes a pivot table.
Will the template tell me whether my strategy has an edge?
No. It only summarises what you enter; it doesn't connect to your broker, check your entries, or tell you whether a strategy has an edge. Three example rows are a worked example, not evidence.