"Five of five timeframes agree." It feels like the safest moment in trading.
We measured what that feeling is worth over gold's next hour. Nothing detectable. Agreement is not rare or precious — quite the opposite: the whole stack agrees far more often than most traders would guess, and the next hour looks the same either way.
We sell the tool that displays this agreement, so the receipts matter. Our own matrix calls itself a bias visualizer and refuses to make win-rate claims. This is our internal check of the claim, using a separate implementation. It is not independent third-party verification.
What we tested
The MTF Confluence Matrix reads a trend bias for each timeframe. At the default SMART setting, eleven classic indicators vote up, down, or abstain; the tool then reduces the default five-timeframe stack (15m, 1h, 4h, daily, weekly) to three numbers: percent aligned, net bias, and a strength-weighted conviction score.
Its own docs call it a bias visualizer. They make no win-rate claims and offer no entry signals. The pitch is simpler: replace flipping through five charts, using only confirmed bars so the higher-timeframe cells never repaint.
The folklore around tools like this makes a stronger claim: only trade when everything lines up. Traders repeat it as if alignment itself were an edge. That claim is testable, so we tested it.
The design
Data. The observation clock and the 15-minute stack use the same frozen 50-session GC=F 5-minute tape as studies #1 and #2: 13,640 bars from 2026-04-29 to 2026-07-10. A 200-period EMA on the 4-hour chart needs months of warmup, so we froze two longer series from the same source: hourly bars back to February 2024 and daily bars back five years. All three files are retained in our private website checkout; they are not public downloads from this article.
The rig. We ported the shipped Pine to TypeScript at defaults and annotated every rule with its source line. The port covers the eleven votes, the abstain rules, the consensus math, the confluence reducer with flats excluded, and the confirmed-bar read; every cell sees only the last completed bar of its timeframe.
Observations. We sampled every hour on the 5-minute clock: 1,131 readings, spaced so the primary forward windows never overlap. Of those, 1,124 had a directional net bias; we excluded 7 ties.
Outcomes. We pre-registered two. Hit asks whether price sits on the net-bias side of the entry one hour after a reading. Return is the one-hour move in ATR units, signed by the bias.
The null. We shuffled the confluence column across observations 2,000 times (fixed seed, committed code) and measured how often shuffled alignment separated outcomes as well as the real column. This is the same design that audited our zone score. Because hourly readings of a slow-moving stack are serially dependent, we added a session-cluster bootstrap as the honesty guard and a four-hour horizon as sensitivity.
Finding 1 — full alignment is common, and sticky
Folklore treats "everything agrees" as rare and precious. On this tape, it was neither.
The stack reached 100% alignment in 28.6% of all hourly readings: 323 of 1,131. At the product's default alert threshold of 80%, it was aligned 58.0% of the time. Aligned runs lasted a median of 3 hours; the longest lasted 57.
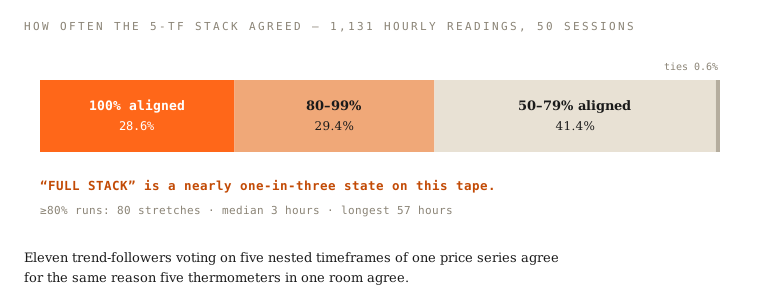
Stop on that before the statistics. A condition that holds 29% of the time cannot be a rare edge. Whatever full alignment means, "special" is not it — and no test we ran below changes that arithmetic.
Why so common? All eleven trend-followers vote on five nested timeframes of the same price series. They agree for the same reason five thermometers in one room agree: correlation, not confirmation.
Finding 2 — alignment level says nothing about the next hour
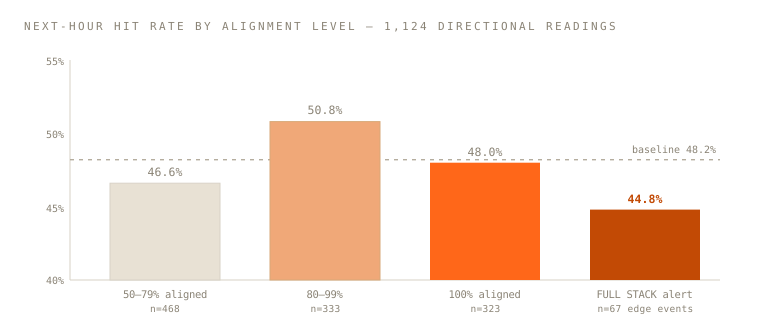
Start with the baseline. Following the net bias for one hour hit 48.2% across all directional readings, with a mean signed return of −0.020 ATR. On this window, the stack's direction was a coin flip; the test was whether more alignment beat less.
It didn't:
| Reading (H = 1 hour) | Bottom tercile | Top tercile | Diff | Shuffle p |
|---|---|---|---|---|
| Hit rate by confluence % | 47.1% | 47.5% | +0.4 pts | 0.43 |
| Signed return (ATR) by confluence % | −0.229 | −0.020 | +0.209 | 0.14 |
| Hit rate by conviction score | 47.1% | 46.9% | −0.1 pts | 0.50 |
The session-cluster bootstrap puts the hit-rate difference at a 95% CI of [−5.2, +10.0] points. That band sprawls across zero and ends the conversation. The four-hour horizon reads the same (+2.3 pts, p=0.27).
The flagship moment was the FULL STACK alert: the edge-triggered crossing into 100%, seen in 67 readings. It hit 44.8% over the next hour, below the 48.2% baseline (p=0.77 against random non-event draws). The panel's most-aligned moment carried no next-hour information at all.
Finding 3 — confluence is a state, not a forecast
Put the two findings together. The matrix's number acquires its real meaning.
Alignment describes now. It says the trend reads across five timeframes currently cohere — a regime statement, just as "it's raining" describes weather without predicting tomorrow's. That is useful: one glance replaces five charts, and the panel can't repaint what a closed bar already said.
What it is not (on this tape, at these horizons) is a forecast. And this rhymes with what study #2 found from a different angle: there, the impulse features (displacement, volume — things that just happened) carried real signal while the composite state-score diluted it. Here, a pure state-description carries none. Twice now, the same lesson from our own products: information about what price just did beats information about how tidy the current picture looks.
What survives, honestly
The product's own framing passes its audit. Its docs say "no win-rate/profit claims" and call the matrix a visualizer. Nothing we measured contradicts a shipped claim. The folklore fails; the tool doesn't.
The panel consolidates timeframe context. It brings completed-timeframe readings into one view so readers can compare them. That does not establish predictive value or guarantee that results remain unchanged after input, feed or history changes. This study tests alignment and later outcomes, not comparative runtime reliability.
The audit loop worked again. The matrix ships readable source, so we could run the test. The research scripts and frozen data remain in our private checkout. Buying the indicator does not provide this research rig. A separately implemented test on another market or horizon may answer differently.
Limits — read before quoting
One symbol (gold futures), one 50-session observation window, two horizons. A different market, timeframe stack, or bias method may answer differently. Rerunning our exact analysis requires the private checkout and its frozen inputs; the method description alone does not provide those materials.
The rig is a faithful line-annotated port of the shipped Pine at defaults, not the TradingView runtime itself. Its 4-hour and weekly buckets are UTC-aligned rather than exchange-session aligned, and forward windows near a session close straddle the overnight gap; both apply identically across alignment levels, so they move the baseline, not the comparison.
The observations are hourly readings of a slow-moving stack, so they are serially dependent; the flat shuffle leans optimistic, which is why the session-cluster bootstrap is the reading that matters — and it straddles zero.
What we're changing
- The matrix's docs get a "what confluence is — and isn't" section linking this study, putting the limit in the manual.
- The FULL STACK alert's description will call it a state-change notification, not an action cue.
- Study #4 in this series will test transitions rather than states: whether a direction flip, rather than sustained alignment, carries anything. Both audits so far point at change, not condition.
If a rerun on another market overturns any number above, the committed script will report it before we do.
Count how often it's true
Before you treat a condition as an edge, count how often it is simply true. On any chart, mark every hour it holds and divide.
If the answer is "a third of the time," you are looking at wallpaper, not an edge. Wallpaper can be useful and honestly descriptive without predicting anything by itself.
The stack agreeing is information about the present. The folklore sold it as information about the future. Only one of those survived contact with its own source code.Frequently asked questions
Does multi-timeframe confluence predict the next move?
Not on our test. Across 1,124 directional hourly readings of gold futures, the most-aligned third of readings hit 47.5% over the next hour and the least-aligned third 47.1%, a 0.4-point gap that shuffled alignment matched or beat in 43% of 2,000 shuffles. The four-hour horizon read the same.
How often do all five timeframes agree?
More often than the folklore suggests. The stack reached 100% alignment in 323 of 1,131 hourly readings, 28.6%, and sat at or above the default 80% alert threshold 58.0% of the time. Aligned runs lasted a median of 3 hours.
Does the FULL STACK alert work as an entry signal?
No. The alert fired on 67 readings, and an hour later price was on the bias side 44.8% of the time, below the 48.2% baseline for all directional readings. On this tape it carried no next-hour information: read it as notice that the state changed, not as a cue to act.
Why is timeframe alignment so common?
Because all eleven indicators in the default vote are trend-followers reading five nested timeframes of the same price series. They agree for the same reason five thermometers in one room agree: correlation, not confirmation.
What are the limits of this study?
One market, gold futures; one 50-session window from 2026-04-29 to 2026-07-10; two horizons; and a TypeScript port of the shipped Pine, not the TradingView runtime. Hourly readings are serially dependent, so the session-cluster bootstrap is the reading that matters, and its 95% interval for the hit-rate gap runs from −5.2 to +10.0 points.