You marked the perfect order block on Sunday.
Clean displacement. Textbook last-down-candle. You even drew it in the good color.
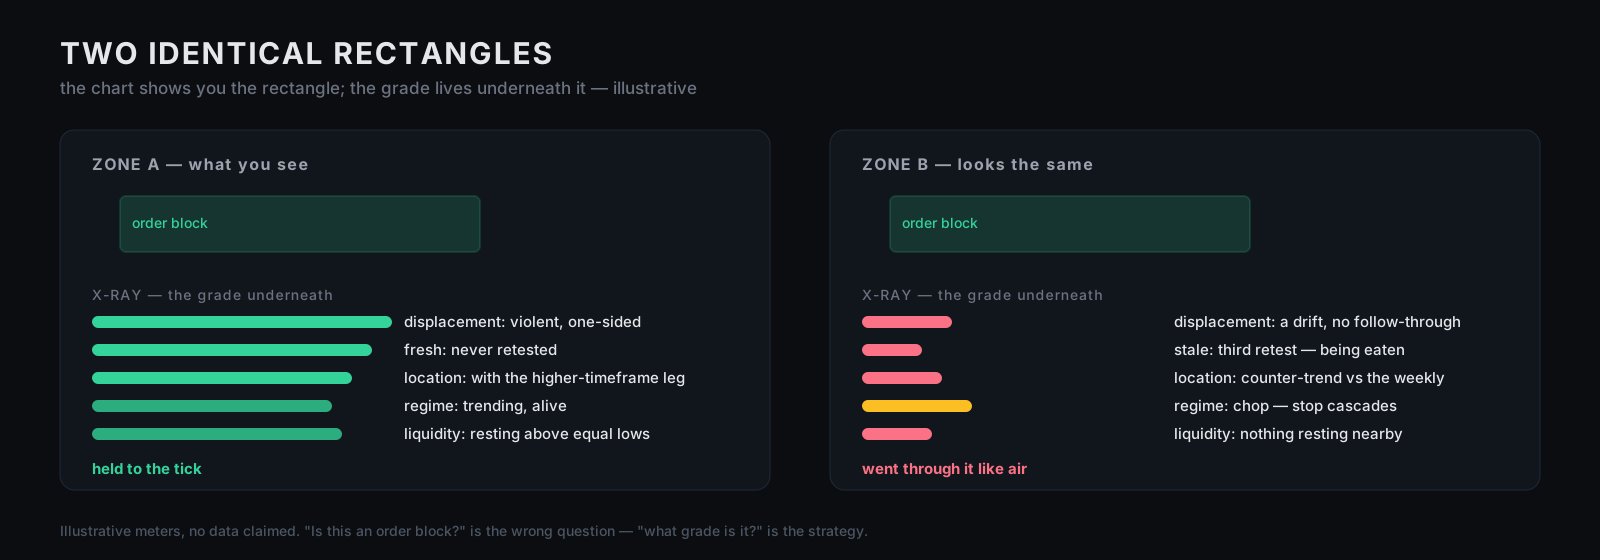
Monday, price came back to it — and went through it like it was air.
The zone two levels below it? The one you almost didn't draw? Held to the tick.
Both were order blocks. Both looked identical.
So which one was the real order block?
Wrong question. "Is this an order block?" is a yes/no question, and yes/no questions about zones are worthless.
An order-block strategy needs rules beyond a rectangle: when it becomes tradable, what confirms entry, where it is invalidated, and how results are measured. A grade is a hypothesis to test.Many SMC tools draw candidate zones. The useful question is what happens after a rule identifies one, before the outcome is known. This piece defines the setup, from entry to stop and target, suggests descriptors to record, and gives an audit you can run on a zone tool, including ours.
Two requests before we start:
- Save this before you take your next order-block trade.
- Send it to one trader whose chart looks like a Mondrian painting.
What is an order block trading strategy?
An order block trading strategy is a written rule for trading the retest of an order block: which zone qualifies, what confirms the entry, where the setup is invalidated, where it takes profit, and how the results are measured after costs. Without all five, it's a rectangle and a feeling.
Sixty-second version: an order block is a chart convention, usually the last opposing candle or cluster before a defined displacement move. It is sometimes interpreted as a footprint of unfilled institutional interest, but OHLC bars alone do not establish that cause. Define the zone, retest entry, invalidation and target, then measure outcomes after costs. Displacement, freshness, location, regime and liquidity context are candidate descriptors, not validated predictors. Our own zone-score study found no statistically detected separation for the composite score on its 50-session gold sample; two factors showed exploratory associations there. That result does not establish a profitable strategy.
| What traders think | What's actually true |
|---|---|
| "Price respects order blocks" | Price respects some zones; the job is knowing which, before the retest |
| "More zones = more opportunities" | More candidates require explicit selection rules and measured outcomes |
| "The zone failed" | A validly defined setup can lose; one outcome does not identify a filter problem |
| "My indicator finds the good ones" | Does it ever tell you to stand aside? If not, it's a decorator |
| "Order blocks are institutional secrets" | The concept is public; any claimed edge still needs testing |
Bullish vs bearish order blocks
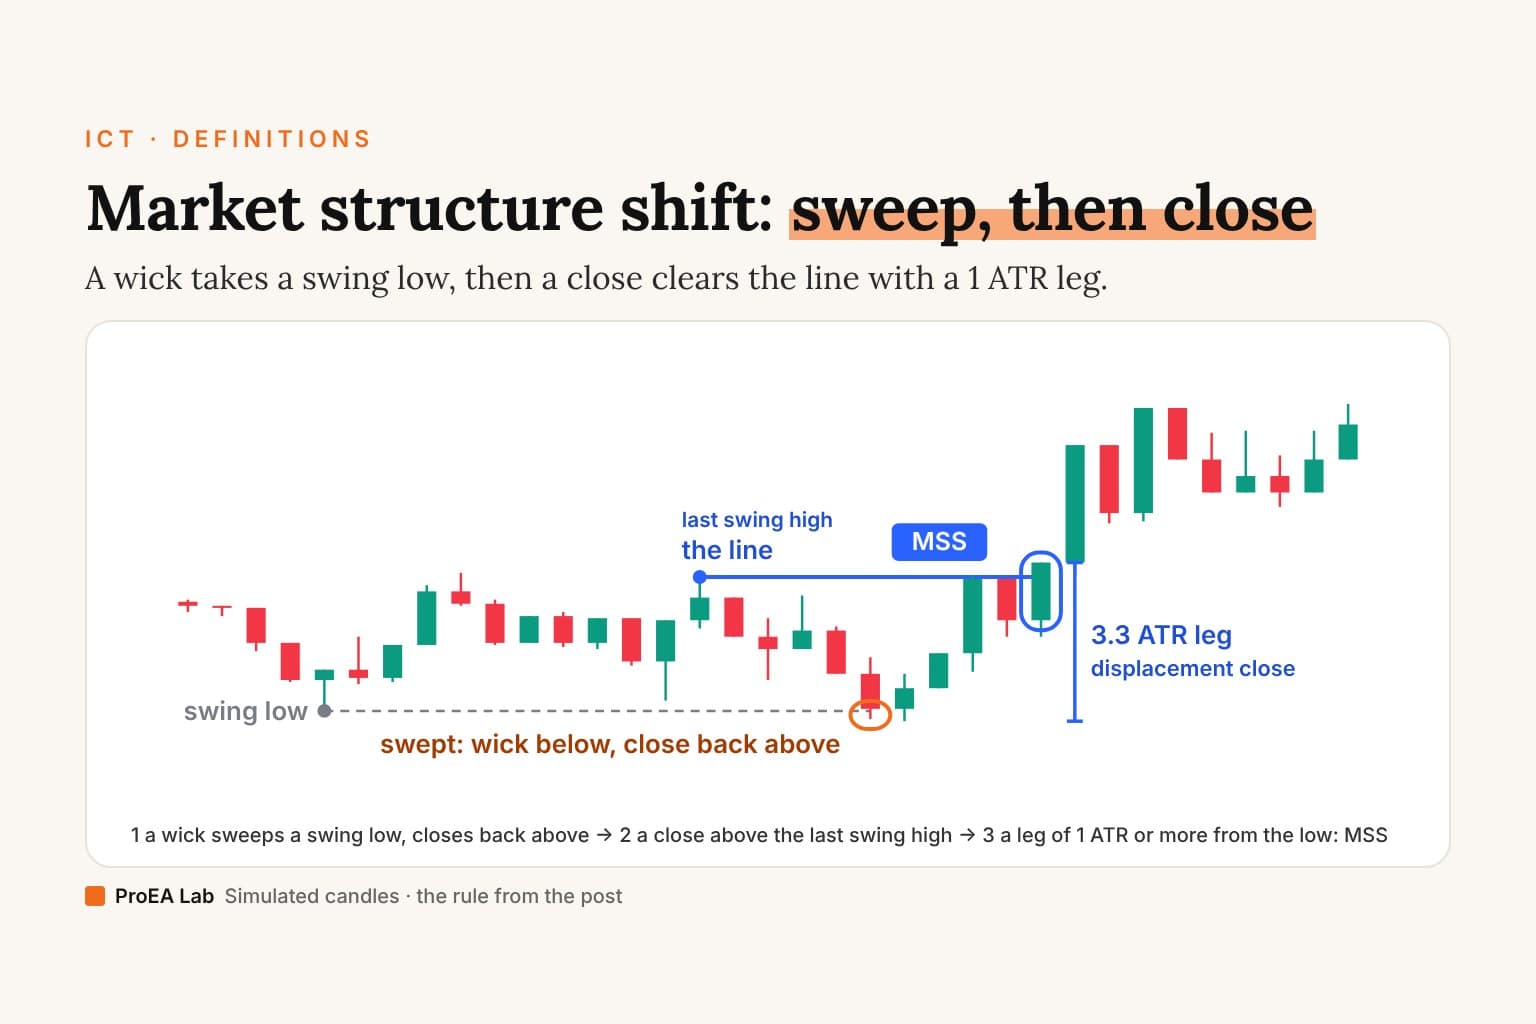
A bullish order block is the last candle that closed down before a move up broke structure; when price returns, it's watched as support for a long. A bearish order block is the last candle that closed up before a move down broke structure; it's watched as resistance for a short.
| Bullish order block | Bearish order block | |
|---|---|---|
| The candle | the last down candle before the break | the last up candle before the break |
| The break | a close above the last swing high | a close below the last swing low |
| Watched as | support, from above | resistance, from below |
| The retest idea | long | short |
| Ends on | a close below its far edge, the bottom | a close above its far edge, the top |
The definition itself, on a replayed chart (which candle, which part of it, when a zone ends), is in what is an order block. The rest of this section is about why anyone trades it.
The chart definition starts with observable prices: an opposing candle followed by a sufficiently large move away, using thresholds declared in advance. Traders interpret that pattern as possible institutional activity. A chart pattern cannot, by itself, identify the participants, their unfilled orders or their motives.
The trading logic is a hypothesis about remaining interest near the earlier price area. That interest might support a retest, or the next move might cross the zone. The smart-money discussion separates the observable pattern from stories about who caused it.
Notice what the definition does not establish: that large orders caused the move or remain at the level. The rectangle records a price pattern. The institutional explanation and future reaction are hypotheses.
Why most drawn order blocks are noise
Here's the uncomfortable arithmetic most "ultimate guides" skip. Displacement happens constantly. Opposing candles precede every move by definition. So a rule that marks every last-opposing-candle-before-impulse marks dozens of zones a week on a single pair — and your indicator dutifully draws all of them, in the same confident rectangle, at the same opacity.
A permissive definition can produce many candidates, including overlapping zones on the same price move. That creates selection and dependence problems in evaluation. We do not have evidence that a fixed fraction are unfilled orders or that trading all candidates produces exactly chance-level results; those outcomes depend on the specified rules and costs.
Record all eligible candidates before choosing filters. Otherwise, a tidy chart can hide the losing examples that mattered to the test.Which order blocks are worth trading? Five things to measure
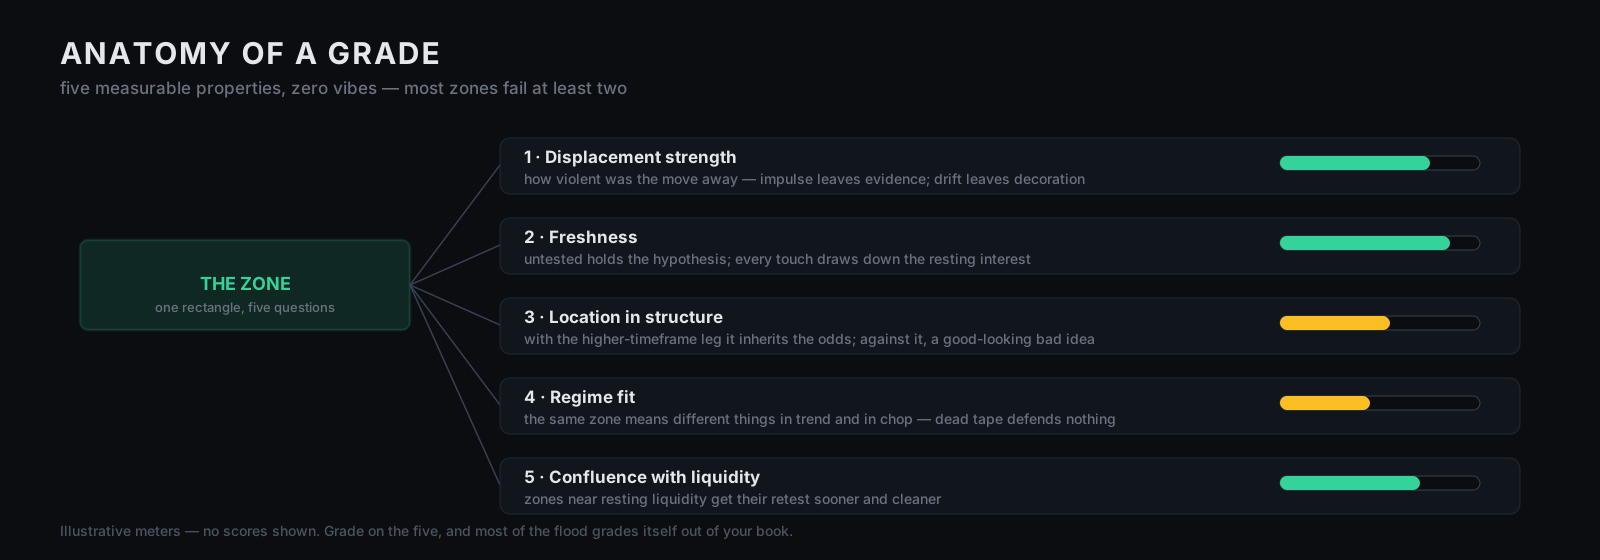
The ones that pass criteria you froze before the retest, and that held up when you measured them. These five properties can make a setup measurable. None independently proves that a zone is worth trading:
Displacement strength. Measure the move relative to ATR or another declared scale. A larger move describes momentum; it does not reveal how much institutional interest remains.
Freshness. Record zone age and the number of prior touches. Whether fresh zones outperform retested ones is a testable hypothesis, not a rule that every touch consumes a known order pool.
Location. Record higher-timeframe direction and the zone's place in a range. Premium and discount and the 62%–79% optimal trade entry (OTE) band are conventions for describing location; their names do not supply profitable odds.
Regime fit. Define trend, range and volatility states using information available when the zone forms. Compare results by state without inferring a stop cascade or a participant's motive from candles alone.
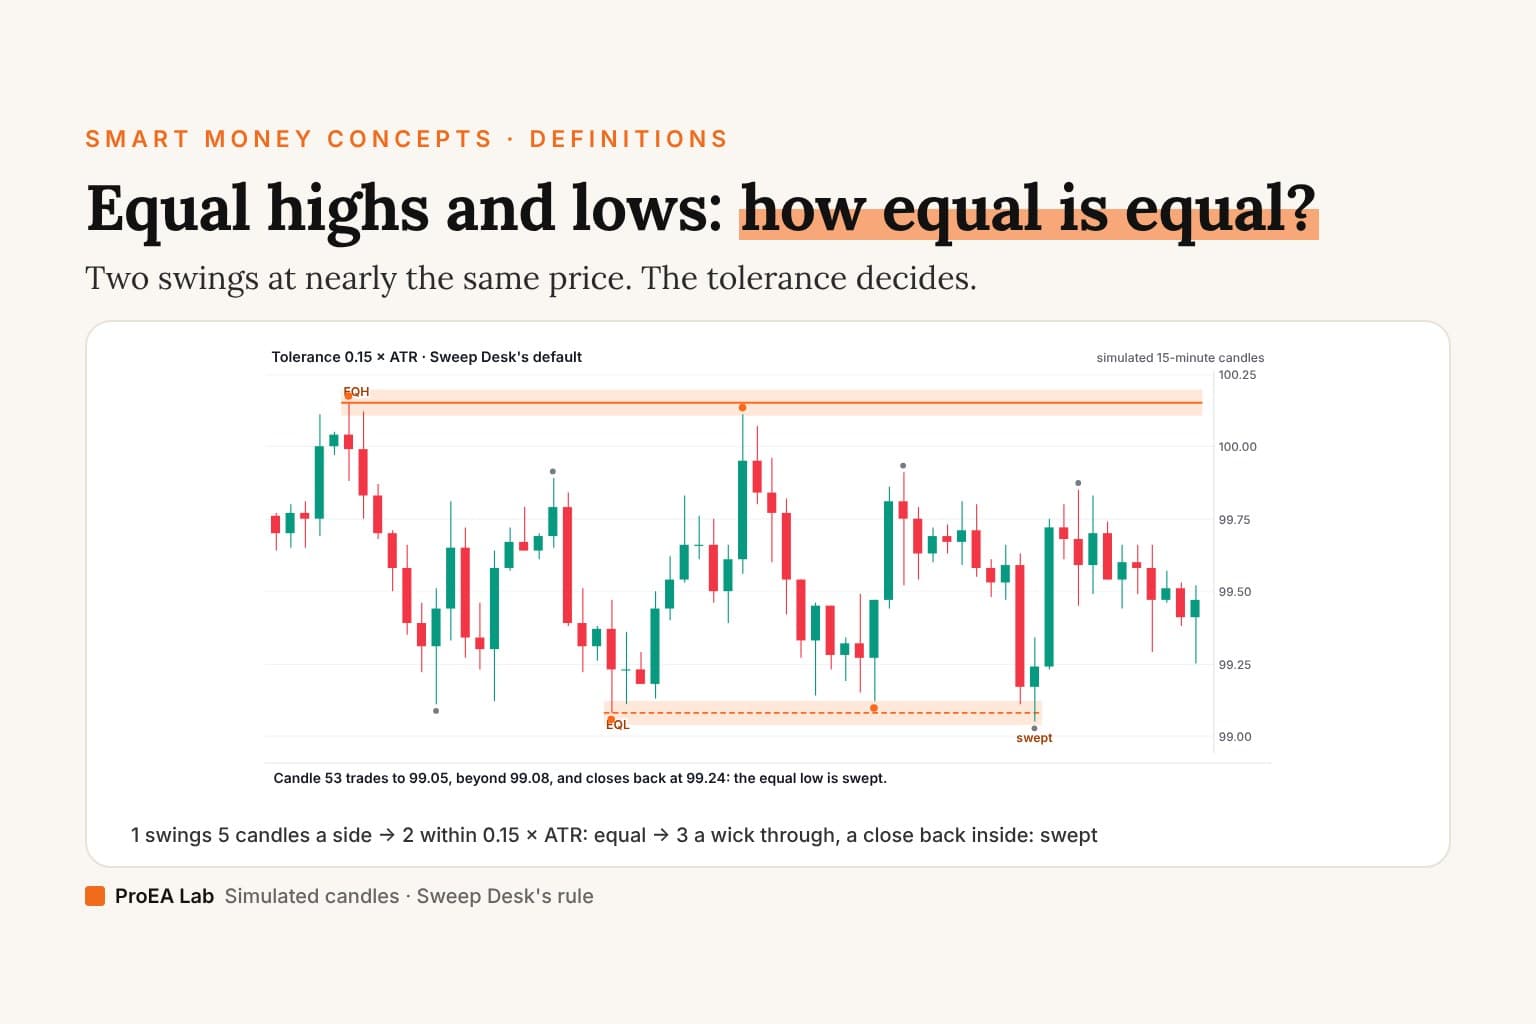
Liquidity context. Record nearby equal highs/lows or session extremes. Whether that context improves the retest rate or net outcomes needs separate measurement.
Freeze the definitions before an untouched evaluation. The goal is a reproducible rule and a measured result, which may be negative.
Order block entry: 50% limit vs confirmation close
Two ways in, and the difference is what you let the market show you first. A limit order at the zone's 50% line fills on the touch, at the better price, with nothing confirmed. A confirmation close waits for a candle to trade into the zone and close back inside it, or past it in the trade's direction, then enters at a worse price.
| 50% limit | Confirmation close | |
|---|---|---|
| The order | a resting limit at the zone's midpoint, placed before price arrives | entered after the confirming candle closes |
| Fills on | every touch of the midpoint, including zones price slices straight through | only retests where a candle closes back on the zone's side |
| Price | better: closer to the stop | worse: further from the stop |
| Misses | nothing that reaches the midpoint | moves that tag the zone and leave without a qualifying close |
Price returns to the zone; with the confirmation entry, you want evidence the defense is real before committing. Pick ONE confirmation definition and write it down — a candle that trades into the zone and closes back inside or above it (inside or below it, for a bearish block); a lower-timeframe break of structure in your direction off the zone; or the first touch holding above the zone's midpoint — then apply it identically on every trade. Which definition you choose matters less than refusing to improvise a new one per trade; improvised confirmation is how a graded zone turns back into a feeling.
A limit on every zone with no confirmation is a bet on the hypothesis at every touch; confirmation makes the market show its hand first, and you pay for it in price. Neither choice has a measured edge here. Test the one you write down, after costs.
Where to put the stop loss on an order block
Beyond the zone's far edge: below a bullish block's bottom, above a bearish block's top. A close beyond that edge is what ends the zone, so a trade still open past it is no longer the trade you planned. Our zone-score study counted a zone as failed on exactly that: a bar closing beyond the far edge.
A stop order there fills on any trade through it, wick included, while the zone itself ends on a close. A small buffer beyond the edge, fixed in advance, is one way to handle the difference; picking it after you see the chart is not.
Define the price that invalidates the setup before entry, then use it for position sizing. A nearby stop limits the planned distance, not the actual maximum loss: gaps and slippage can exceed it. Clear invalidation is useful risk specification; it does not by itself create positive expectancy.
The entry choice moves the stop distance too. The same stop sits closer to a 50% limit than to a confirmation close, so the two entries size differently on the same zone.
A zone that dies this way, on a close through it while structure breaks the other way, gets a second life in some playbooks: traders watch it from the other side as a breaker block.
Take-profit targets for an order block trade
Take profit at the next structure the trade runs into: the opposing zone, the range extreme, the prior swing. Somewhere another hypothesis lives. Not a fixed R multiple pulled from a course PDF.
Prior swing highs and lows are also where resting stops are assumed to sit, the levels a liquidity sweep takes. Measure the distance before you enter: if the stop is further away than the first structure, the trade risks more than it can reach.
And the discipline nobody sells: stand aside when your declared criteria are absent. This makes execution consistent with the tested rules; it does not establish that refusing a trade is always the most profitable action.
Order block + fair value gap strategy
The pairing uses the gap as evidence of displacement. A strong move away from an order block often leaves a fair value gap: three candles where, in a bullish move, the third candle's low stays above the first candle's high. A block with a gap behind it was left in a hurry.
Displacement is the first of the five descriptors above, and it's the one that stood out in our zone-score study: the top third of zones by displacement moved 1 ATR their way before a close through the far edge 18.0 percentage points more often than the bottom third, on the thinned pool (shuffle p below 0.0005). That was an exploratory association across order blocks and fair value gaps together, on one market in one 50-session window. It is not a tested order-block-plus-gap rule.
Write the combination down one of two ways:
- The gap as a filter. Trade only blocks whose move away left a gap; enter and stop at the block as above.
- The gap as the entry. Enter at the gap, which sits closer to price, and keep the stop beyond the block's far edge. Price reaches it more often, and the stop is wider.
A gap that a later candle closes through the wrong way flips sides and becomes an inverse fair value gap.
Order block vs supply and demand zone
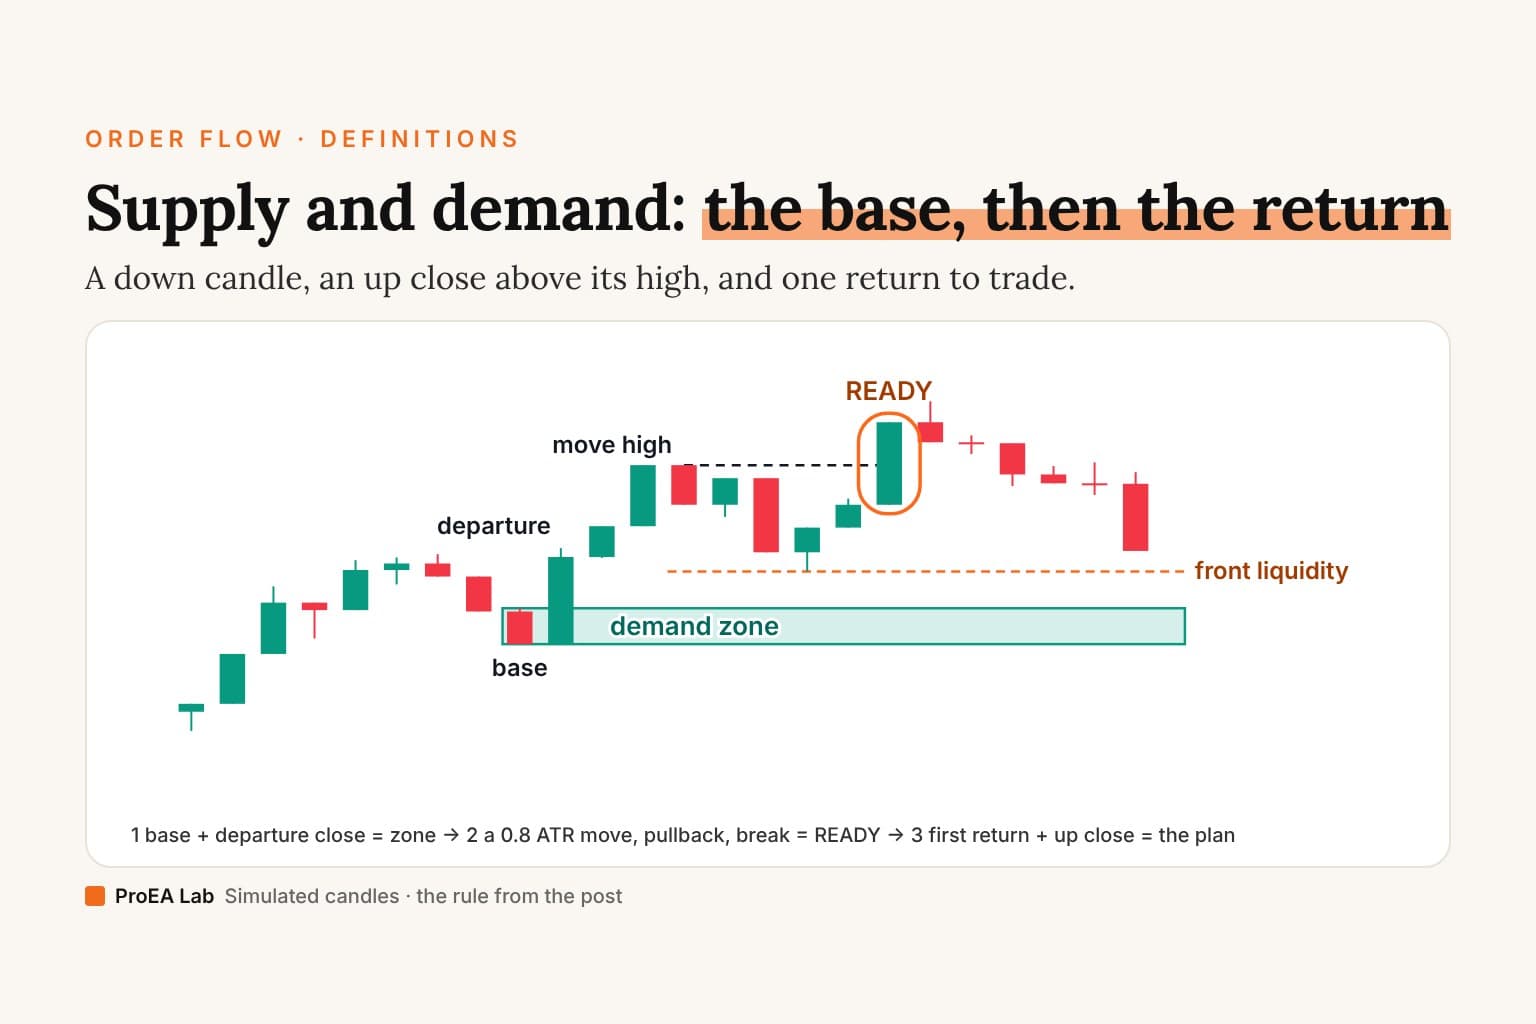
Mostly the trigger and the exit. An order block needs a structure break and ends on a close through its far edge. A supply or demand zone marks the base a strong move left from; the version our Supply & Demand Desk draws needs no structure break, is drawn from the wicks, and ends on any close back into it.
| Order block | Supply or demand zone (Supply & Demand Desk) | |
|---|---|---|
| Starts from | the last candle that closed against a move before it broke structure | the base a strong move left from: an opposite candle and the departure that closes past it |
| Structure break | required | not required |
| Zone edges | the body by default (SMC Basics), wicks optional | full wicks |
| Strength filter | none beyond the break | the move reaches 0.8 × ATR(14) |
| Ends on | a close beyond the far edge | any close on or inside the near edge |
On a sharp reversal the two can start from the same candle, with a different box and a different way to die. How to draw one, and the desk's full rule: supply and demand zones.
Is order block trading profitable? What our zone-score study measured
Not established, by us or by any screenshot. Our zone-score study measured whether zones held, not whether a strategy made money after costs. What it found is a base rate and a score that didn't separate outcomes.
- The sample: COMEX gold futures (GC=F), 5-minute bars, 50 sessions from 29 April to 10 July 2026: 1,729 zones, 241 of them order blocks and 1,488 fair value gaps.
- The base rate: of 1,693 zones that resolved, 982 (58.0%) moved 1 ATR in the zone's favour before a bar closed beyond the far edge; 711 failed. A mechanical race, not a win rate.
- The score: our 0–100 composite did no better than 2,000 shuffles of the same scores. Zones scored 70 or more did it 59.8% of the time, zones below 40, 58.1%. Top third vs bottom third: +2.6 points (p = 0.21), and −1.9 after thinning clustered zones (p = 0.72).
- Two factors: displacement, +18.0 points (thinned, p below 0.0005), and volume, +10.5 (p = 0.003). Liquidity sweep, higher-timeframe alignment and time of day showed no detected association. Exploratory: one market, one timeframe, one window.
A profitable order block strategy is a separate claim with its own test: a fixed entry, stop and target, with costs, on data the rules never saw.
When do order blocks fail?
In chop, on stale zones and around news. And on screenshots, where a repainting tool has deleted its failures. Those three market conditions, chop, zone age and news, are worth examining separately. Each can change the price path or execution. Record their effects under your rules instead of assuming that every move in chop is a stop cascade or that every old zone is invalid.
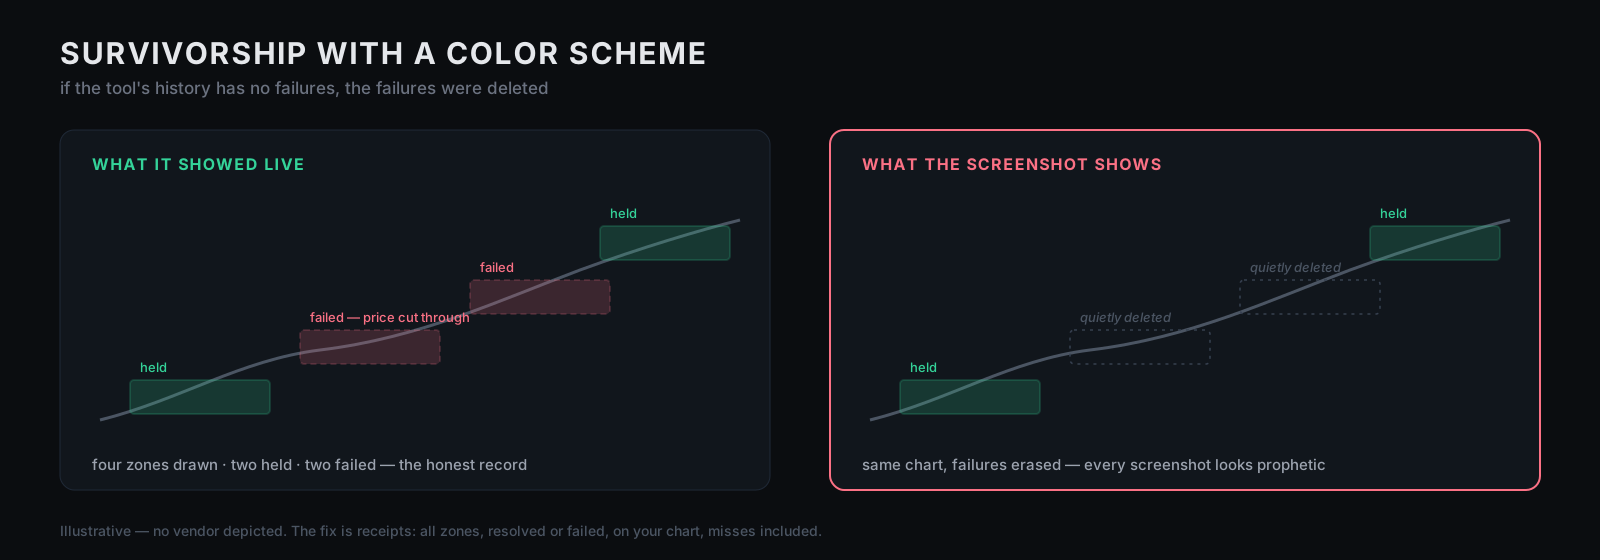
And one dishonest failure mode, which belongs to the tools rather than the market: repainting. Some SMC indicators re-evaluate zones after the fact — the failed rectangle quietly disappears, the surviving ones stay, and the chart's history becomes a highlight reel. Every screenshot looks prophetic because the misses were deleted. If your zone tool's past always looks perfect, you're not looking at analysis — you're looking at survivorship with a color scheme. (We've made the general case — a repainting indicator is a memoir, not a strategy — in the smart-money piece; here the point is narrower: your zones specifically.) The fix is receipts: an honest zone tool must show how all of its zones resolved, on your chart, misses included.
The 20-minute order block indicator test
Run this on any order-block indicator — free, paid, ours:
Minutes 0–5 — The flood check. Load a week of chart. Count the zones it drew. If it drew everything, it graded nothing — you're the filter, and you're paying for rectangles.
Minutes 5–10 — The replay test. Bar-replay a fresh session and watch zones form live. Do they appear when tradable — or only reveal themselves as brilliant after the move? Anything that redraws history fails on the spot.
Minutes 10–15 — The receipts test. Find where the tool reports its own zone outcomes on your chart — held, failed, untested. No self-reported outcomes = no way to distinguish it from the survivorship problem above.
Minutes 15–20 — The stand-aside test. Scroll to a dead, choppy day. Does the tool ever conclude nothing here is worth trading? A tool that always finds a setup isn't reading the market; it's reading your hope.
Where the SMC toolkit sits
The honest ledger, caveats first. No zone system — ours included — wins in every regime, and nothing on this page or ours promises profit; a grading tool's job is restraint, not prophecy. What our SMC AI-Scored Toolkit is, per its own page: every order block and FVG scored 0–100 on five transparent factors, re-weighted to the live regime (classified from ATR percentile and structure), and the top-scored few drawn. The score ranks and describes zones; it isn't odds. Its zone boxes commit on the closed bar; a zone that fails is removed from the chart and counted in its Resolved %. Up to v1.4.0, one of its five score factors, higher-timeframe alignment, read the still-forming 4-hour bar live, so a live score could differ after a reload; v1.4.1 reads the last closed bar (our repaint check has the line). Our zone score study also found its composite score did no better than a shuffle on 50 sessions of gold, while two factors showed exploratory associations in that same window, not a validated trading edge. The dashboard renders a verdict — ARMED, MANAGE, or STAND-ASIDE — with a one-line plain-English reason, and when a zone qualifies you get the ticket (entry / stop / target from its geometry). And the part this article demands of everyone: it shows its Resolved % — how its own zones actually held, computed live on your chart, misses included. Receipts, not a slogan. It scores; it never predicts. Run the 20-minute test against it before you trust it — that's what the test is for.
Disclosure
This is education about a method, not a promise about returns. Order blocks are a hypothesis about resting interest; hypotheses fail, and any tool vendor — including us — should be interrogated with the 20-minute test before money moves. The one question that sorts zone tools instantly: "Show me every zone you drew last month and how each one resolved." If the answer is a curated history, you have your answer.
Your first 20 minutes
Open your current chart and record the candidates against the five descriptors above. Keep the failed and untested ones in the ledger. Run the 20-minute test on the tool, then evaluate a fixed entry and exit protocol with costs on fresh data. Passing an interface audit does not replace that performance test.
The rectangle was never the edge.
The grade is a testable hypothesis.
Draw fewer. Grade harder.
Trade the zones that earned it — and let the rest stay decoration.Frequently asked questions
What is an order block trading strategy?
A written rule for trading the retest of an order block: which zone qualifies, what confirms the entry, where the setup is invalidated, where it takes profit, and how the results are measured after costs.
What is the difference between a bullish and a bearish order block?
A bullish order block is the last candle that closed down before a move up broke structure; when price returns, it is watched as support for a long. A bearish order block is the last candle that closed up before a move down broke structure; it is watched as resistance for a short.
Should you enter an order block with a 50% limit or a confirmation close?
A limit at the zone's 50% line fills on the touch at the better price, including on zones price slices straight through. A confirmation close waits for a candle to close back inside the zone, at a worse price. Neither has a measured edge here; pick one definition and apply it to every trade.
Where do you put the stop loss on an order block trade?
Beyond the zone's far edge: below a bullish block's bottom, above a bearish block's top. Decide it before entry and size the position from it. Gaps and slippage can still make the loss larger than planned.
Where do you take profit on an order block trade?
At the next structure the trade runs into: the opposing zone, the range extreme or the prior swing high or low, not a fixed R multiple. If the stop is further away than the first structure, the trade risks more than it can reach.
What is the difference between an order block and a supply and demand zone?
Mostly the trigger and the exit. An order block needs a structure break and ends on a close through its far edge. The supply and demand zone our Supply & Demand Desk draws needs no structure break, is drawn from the wicks, and ends on any close back into it.
Does adding a fair value gap improve an order block?
We have not tested that rule. A gap left by the move away is a visible sign of displacement, and in our zone-score study displacement showed the strongest exploratory association, on one market in one 50-session window.
Is order block trading profitable?
Not established. In our zone-score study of 1,729 order blocks and fair value gaps on 50 sessions of gold futures, 58.0% of the zones that resolved moved 1 ATR their way before a close through the far edge. That is a mechanical race, not a win rate, and our composite zone score did no better than a shuffle.