
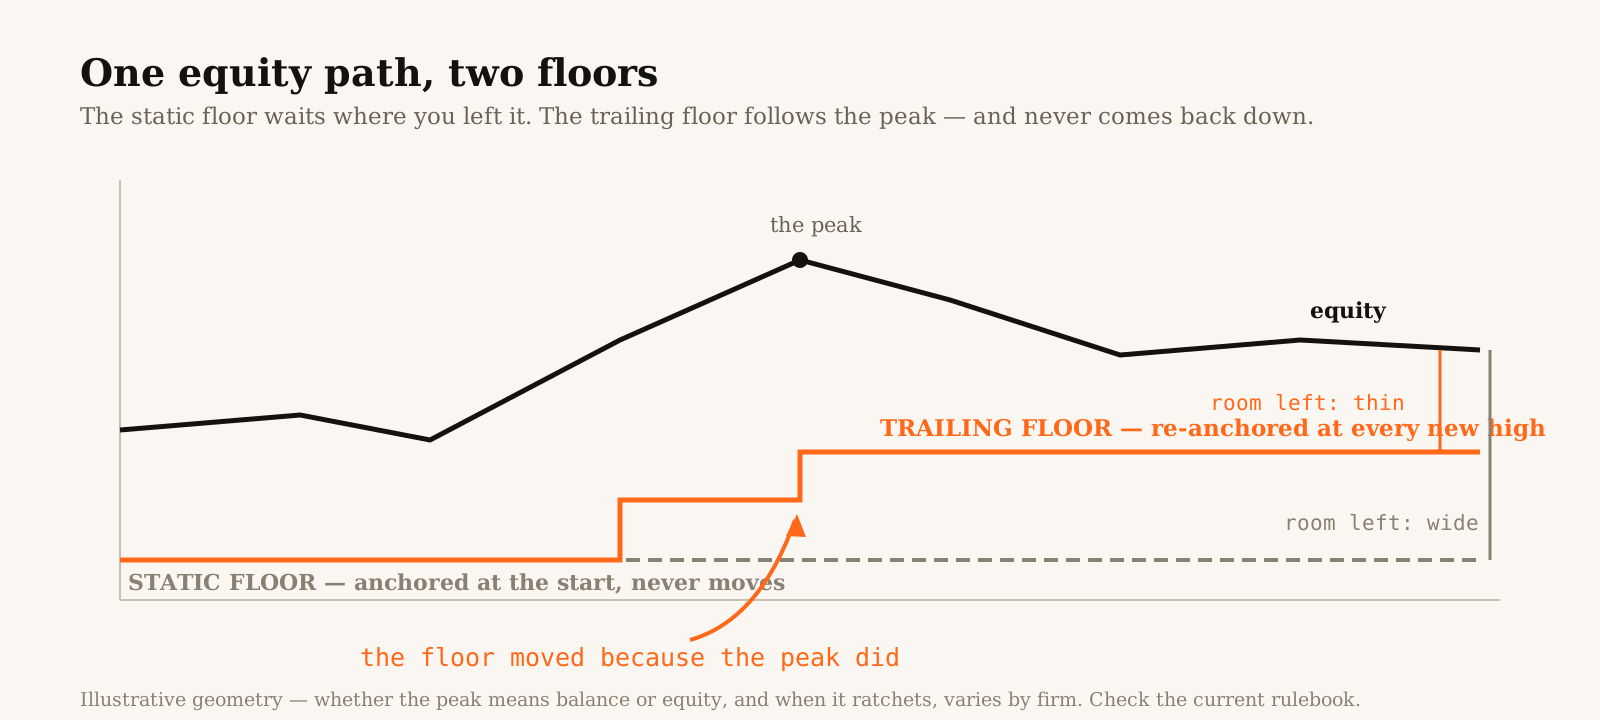
Static drawdown sets a loss floor from your starting capital. Trailing drawdown raises that floor as a defined account peak rises. The difference is what moves the floor; the actual calculation also depends on the loss allowance, whether the peak uses balance or equity, and when it updates.
For example, a $50,000 account with a fixed $2,500 loss allowance starts with a $47,500 floor. At a qualifying $52,000 peak, a static floor stays at $47,500; a trailing floor with that same fixed allowance rises to $49,500. A percentage-of-peak trailing formula gives a different result, shown below.
Use this guide to identify your rule, then try the percentage-based comparison calculator. It illustrates that specific model; it does not reproduce every prop firm's account rules.
What is a trailing drawdown?
A trailing drawdown is a loss limit whose floor follows a defined high-water mark. Within an unchanged trailing rule, the floor moves up when the qualifying peak rises and does not move down when the account loses money. Any lock, withdrawal adjustment or account reset must be checked separately.
There are at least two ways to calculate an unlocked trailing floor:
- Fixed monetary allowance: floor = high-water mark − allowed loss. If the allowed loss is a percentage of starting capital, convert it to money once.
- Percentage of the peak: floor = high-water mark × (1 − drawdown%). Here the monetary allowance grows with the peak.
Those formulas are not interchangeable. For a $52,000 peak, a fixed $2,500 allowance gives a $49,500 floor. A 5% allowance measured from the peak gives $49,400.
What is a static drawdown?
A static drawdown keeps the total-loss floor anchored to the account's starting capital. With starting capital of $50,000 and a 5% allowance, the floor is $50,000 − $2,500 = $47,500. Profits do not raise that floor while the same static rule applies.
| Question | Static drawdown | Trailing drawdown |
|---|---|---|
| What anchors the floor? | Starting capital | A defined account peak |
| Does a higher peak raise it? | No | Yes, until any rule-specific lock |
| Does a loss lower it? | No | No, within the same trailing rule |
| Can open losses breach it? | Yes, if the rule checks equity | Yes, if the rule checks equity |
Static describes the floor's anchor. It does not remove a separate daily loss rule or permit unlimited open losses.
The same number, two different games
Walk one account through three moments: $50,000 start and a 5% limit. This table uses the percentage-of-peak trailing model, matching the calculator's formula. It assumes the $52,000 peak qualifies under the rule, with no lock or withdrawal adjustment:
| Moment | Static floor | Trailing floor | Room above the floor |
|---|---|---|---|
| Day one, $50,000 | $47,500 | $47,500 | $2,500 either way |
| Peak touches $52,000 | $47,500 | $49,400 | static $4,500 · trailing $2,600 |
| Back to $50,500 | $47,500 | $49,400 | static $3,000 · trailing $1,100 |
Same trades, same ending equity. The static account's buffer grew from $2,500 to $3,000. The trailing account's buffer fell to $1,100 after the pullback. Notice that at the peak itself the percentage-based trailing buffer was $2,600: a new high does not automatically shrink the buffer. Giving back gains after the floor rises is what reduces the remaining room.
The three variants that decide everything
After identifying the loss-allowance formula, find these three answers in the current account rulebook. The prop-firm rules guide gives a wider checklist:
What counts as the peak. Closed balance only, or equity including open, floating profit? An equity-tracked floor can ratchet up on a trade you never closed — the $52,000 touch in the table moves it even if you banked nothing.
When it updates. Intraday tracking can raise the floor during an open trade. End-of-day tracking uses the specified closing observation. An EOD update does not mean breaches are checked only at the close. An existing floor can still be enforced against live equity throughout the session.
Whether it ever locks. A rule may stop the floor at a stated level, such as starting capital, or continue trailing. A lock limits further movement of that floor; it does not assure a breakeven outcome or cancel daily limits. Check what happens after a payout or account transition too.
Examples from published prop-firm rules
Sources checked 7 September 2026. These illustrate why the exact account product matters:
- FTMO's trading objectives describe a static Maximum Loss limit for its 2-Step accounts. Its 1-Step rule instead trails a qualifying end-of-day balance while subtracting an allowance based on initial capital. That is not a percentage-of-peak calculation.
- Topstep's Maximum Loss Limit for the Trading Combine uses a fixed monetary allowance, updates with end-of-day balance highs, and stops rising at starting balance. The current limit is still enforced during the session, including open P/L. Other account stages have their own details.
Use the rulebook for your exact account and stage; the generic calculator is not a firm-specific compliance check.
Why winners are the dangerous part
An account can remain profitable relative to its starting balance and still breach a trailing limit. After the floor rises, measure the remaining buffer from current equity to that floor, rather than treating all profit since day one as available loss capacity.
Check the daily loss allowance separately: it can restrict the account before the total drawdown floor does. Both tools show their assumptions so you can compare them with the rules that actually apply.
Is static drawdown better than trailing drawdown?
With the same starting capital and initial loss allowance, a static floor generally leaves more room after the account makes new highs. That does not make an account better overall: targets, daily limits, fees, payout conditions and permitted strategies can differ. Compare the whole rulebook, not just the word "static".
Continue with the prop-firm rules and risk hub, or compare the static and percentage-based trailing floors with your own inputs.