The best trading day of your life happens on a Tuesday.
One clean trend, three adds, textbook exits. The dashboard shows a number you screenshot before it feels real.
Wednesday morning you request your first payout.
Denied — not for losing. For winning wrong.
A consistency rule caps how much of your total profit one day may hold. Breach it and your best day becomes a debt: profit you now owe the account, on other days, before the payout unlocks. The arithmetic of that debt is printable — and almost nobody prints it.Two requests before we start:
- Save this before your next evaluation, while the ratio is still yours to shape.
- Send it to one funded trader still celebrating a monster day.
Skip this if you want the math
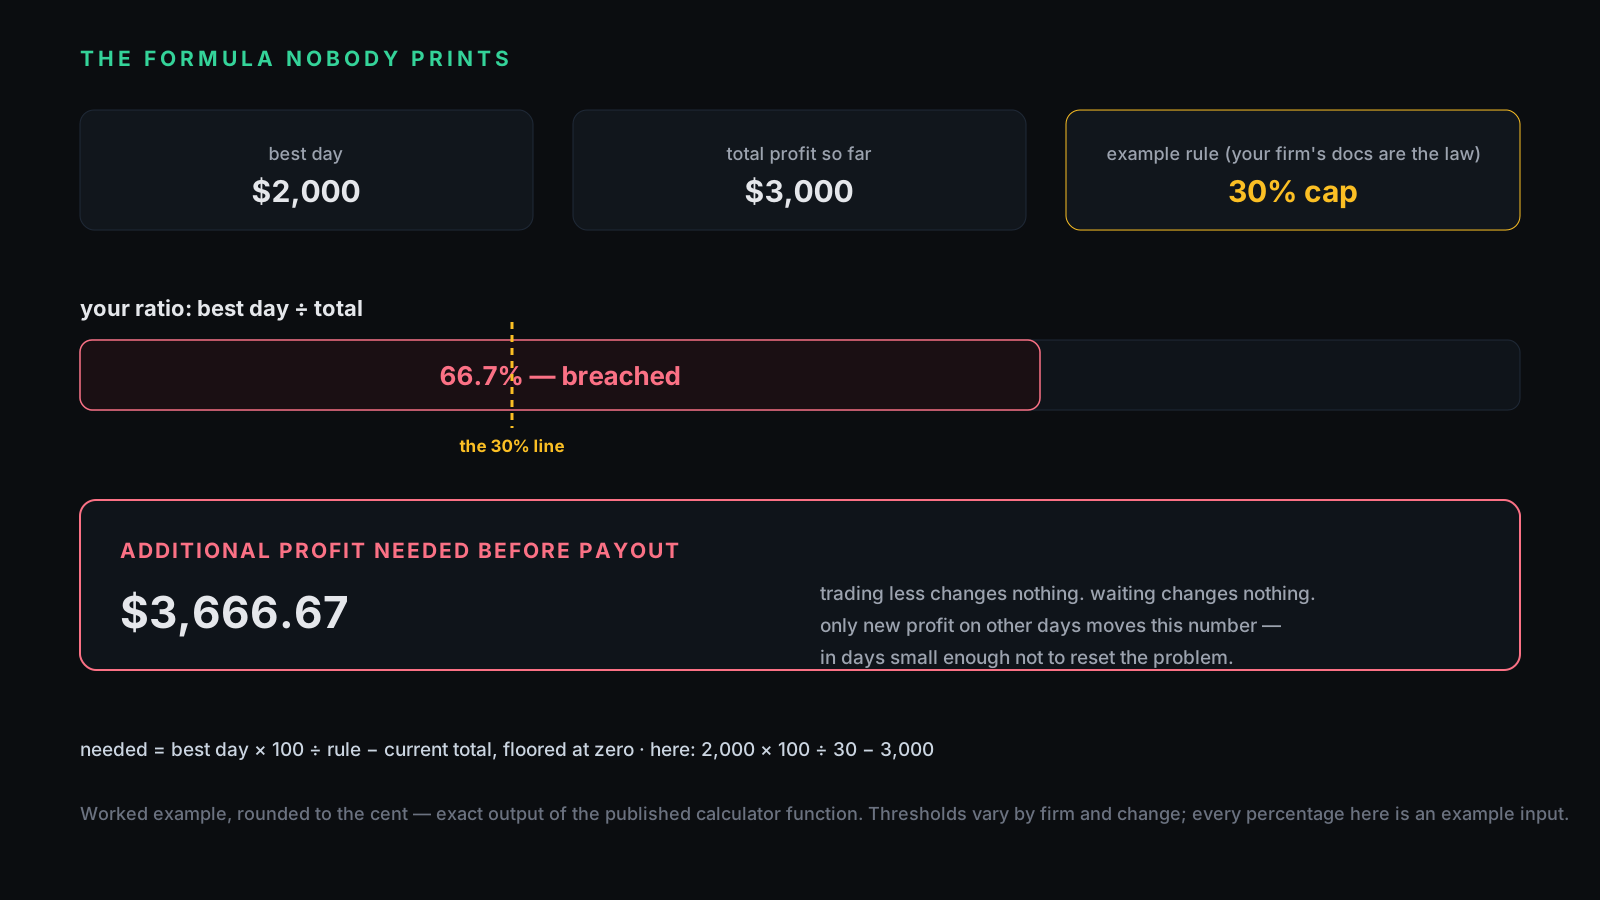
Sixty-second version: a prop firm consistency rule computes best day ÷ total profit and caps it — common shapes run from 20% to 45%, and your firm's official documents are the only version that counts. Breach it and, at many firms, nothing fails — but the payout waits until the ratio drops, and the only lever that drops it is the denominator: you must add profit on other days. The debt is exact: required total = best day × (100 ÷ rule), so under a 30% cap a $2,000 best day demands a $6,666.67 total — if you're at $3,000, you owe $3,666.67 more before anyone pays you. Trading less doesn't help; time doesn't help; only new profit does, earned in days small enough not to reset the problem. The forward-looking version is cheaper: know the cap before your first trade, size days evenly (one risk-fixed formula per trade, same risk every day), and treat any day approaching the cap as a reason to stop early — our free calculator does the ratio and the debt in your browser.
| What the celebration assumes | What the rule computes |
|---|---|
| "Huge day — I'm ahead of schedule" | Best day ÷ total just spiked — the payout may have just locked |
| "I'll trade carefully and wait it out" | Waiting does nothing; only new profit on other days moves the ratio |
| "I breached — the account is dead" | At many firms a breach delays payout, not the account — read your docs |
| "The rule is arbitrary cruelty" | It's a variance filter — the same math that catches one-lucky-day passes |
| "My firm's cap is 30%, I read it somewhere" | Rules vary by firm and change — the official docs are the law |
I — What the prop firm consistency rule is, and why firms run it
The mechanics fit in one line: consistency % = best day's profit ÷ total profit × 100, kept under a threshold your firm sets.
Why it exists deserves the honest double answer. The stated reason is real: evaluations can be passed by one oversized coin-flip, and a firm paying out to coin-flippers doesn't survive; requiring profit to spread across days filters lottery passes from repeatable process. And the structural observation is also real: a rule that converts your best day into a payout delay is, mechanically, payout friction — it slows money leaving the firm. Hold both facts without picking one, and the right posture falls out: the rule is neither a scandal nor a suggestion — it's a constraint with math, and math can be planned for.
What this article won't do is tell you your firm's number. Thresholds differ across firms, account types, and evaluation-versus-funded phases, and they change. We decode the whole prop rulebook elsewhere; here, every threshold is an example input, and your firm's official documents are the only source that counts.
II — The ratio, and the debt formula
Two formulas run everything. The ratio you know. The second one is the one nobody prints:
Additional profit needed = (best day × 100 ÷ rule%) − current total — floored at zero.
That's the debt your best day created. Four worked examples under an example 30% cap (exact outputs of the calculator's public function, rounded to the cent):
| Best day | Total profit | Ratio | Verdict at 30% | You still owe |
|---|---|---|---|---|
| $800 | $4,000 | 20.0% | passes | $0 |
| $1,500 | $4,000 | 37.5% | breached | $1,000 |
| $2,000 | $3,000 | 66.7% | breached | $3,666.67 |
| $900 | $2,000 | 45.0% | breached at 30 — passes at 45 | $1,000 at 30% · $0 at 45% |
Read the third row twice, because it's the one that ruins celebrations: a $2,000 day on a $3,000 total means you must more than double the account's profit — while never printing another day big enough to re-lock the ratio — before the payout button works.
What happens if tomorrow becomes the new best day?
Recompute both numbers. Under an illustrative 30% threshold, a best day of USD 500 and total profit of USD 2,000 gives 25%. A new USD 1,000 day raises the total to USD 3,000 and the best day to USD 1,000: the ratio becomes 33.33%, not 16.67%.
| Hypothetical stage | Best day | Total profit | Ratio | Additional total needed at 30%, if best day stays fixed |
|---|---|---|---|---|
| Before the new day | USD 500 | USD 2,000 | 25.00% | USD 0 |
| After a new USD 1,000 best day | USD 1,000 | USD 3,000 | 33.33% | USD 333.33, rounded |
| After a later USD 500 day | USD 1,000 | USD 3,500 | 28.57% | USD 0 |
These are outputs of the existing consistency calculator: required total = best day × 100 ÷ threshold; additional amount = max(0, required total − current total). Enter each row to reproduce it. The USD 333.33 figure is a rounded mathematical gap, not an instruction to chase profit; losses or another new best day change it again. Confirm your firm's period, fees, day boundary, eligibility rules and rounding before using its threshold. This ratio alone does not establish payout eligibility.
III — The multiplier ladder
Divide 100 by the rule and the whole constraint becomes one number: the multiple of your best day that your total must reach.
- 20% cap → total must reach 5× your best day
- 25% cap → 4×
- 30% cap → 3.33×
- 40% cap → 2.5×
- 45% cap → 2.22×
(Exact values are 100 ÷ rule; 3.33 and 2.22 are rounded.) This is the number to hold in your head during a good day, not after it: every extra dollar your best day gains raises the total you owe by three, four, five dollars — at 30%, a day that runs $500 further just added $1,666.67 to your required total. The rule taxes outliers at the multiplier rate, in profit you haven't earned yet.
Under a consistency cap, your best day isn't just profit — it's a purchase order for more profit, at 2× to 5× face value, payable before the payout.IV — Playing it forward
Everything in §II–§III is autopsy. The cheap version happens before the big day exists, and it's three habits:
Know the multiplier before the first trade. If the cap is 30%, then no day may exceed roughly a third of whatever total you expect to show — which, early in an account, is every day, because the total is small. The most dangerous day for the ratio is a great day one — best day $1,000, total $1,000, ratio 100%.
Separate risk inputs from profit outcomes. A position-size calculation can make your intended per-trade risk explicit. It cannot flatten daily P/L: trade counts, realized outcomes, costs and gaps vary. Avoid assuming that equal risk per trade guarantees a compliant best-day ratio.
Write down your review point. Record the applicable threshold and a point at which you will recheck the ratio in your journal. A personal ceiling does not make the rule unenforceable: later losses can shrink total profit, a new best day can raise the numerator, and the firm may use a different period or definition. Recalculate from the actual record; do not treat a plan as proof of compliance.
None of this is gaming the rule. It's the behavior the rule was written to select for, adopted on purpose, with arithmetic instead of vibes.
V — The uncomfortable mirror
Here's the part the complaint threads skip: the consistency rule is a variance detector, and it's running the same mathematics we keep publishing. One monster day inside a small sample is exactly what routine variance produces — and exactly what a firm can't distinguish from luck, because you can't either, not at that sample size. A trader whose edge is real and evenly executed generates a ratio the rule never notices. A ratio that keeps breaching is information: your results are concentrated in a way that neither you nor the firm can yet tell apart from chance.
That's an uncomfortable sentence to read the morning after a monster Tuesday. It was uncomfortable to write — we sell tools to prop traders. But the honest read of the rule is that it's the rare constraint whose incentive points the same direction as your own survival math: spread the risk, flatten the days, let the sample size do the proving.
The 20-minute audit
Minutes 0–7: from your journal, compute day-level P&L (sum R × risk per day), find your best day and your total for the current payout period. Minutes 7–12: run both numbers through the calculator at your firm's threshold — the real one, from their official docs, checked today, because rules change. Minutes 12–17: if you're breached, write the debt number where you can see it, and the day-ceiling sentence (§IV) under it. Minutes 17–20: compute the multiplier (100 ÷ your cap) and put it on a sticky note for the next green morning — the moment it matters is mid-hot-streak, which is precisely when you won't want to look.
Where we sit
Bias, priced: the consistency calculator is free and runs in your browser — the ratio and the debt formula above are its exact public math. One step up, the Prop Firm Challenge Toolkit puts the rule math on your chart: daily-loss buffer in dollars, drawdown floor, and a consistency percentage among its customizable rule parameters, wrapped in a three-state verdict (ON TRACK / AT RISK / FAILED) — launch-priced at $29 as a one-time download, with all 975 lines of Pine v6 source included. Its own page says the two honest things we'd say here anyway: it can't touch your broker — it's a monitor, not a blocker — and its firm presets are conveniences to confirm against each firm's official rules, because rules change. It also refuses to flash "PASSED" until minimum trading days are actually served, which tells you whose side its math is on. None of it replaces the two formulas in §II. Those are free, and they fit on a sticky note.
Disclosure
This article asserts no specific firm's threshold anywhere — every percentage is an example input, the calculator takes the rule as a parameter for the same reason, and your firm's official documents override anything written here. The worked examples are cent-rounded outputs of our published calculator function; "a breach typically delays payout rather than failing the account" is the common shape across firms, not a guarantee about yours. We sell tools in this lane (a free calculator, a $29 toolkit). If any number above disagrees with what the calculator returns, email support@pulltrade.app — one of them is wrong and we'll fix it in public.
Your first 20 minutes
Run the audit above — ratio, required total, multiplier and review point. Repeat it when the reporting window, best day, total profit or applicable rule changes.
The trader from the opening didn't lose the payout on Tuesday.
He lost it months earlier, when he decided rules were things to read after breaching them.
Make the rule's inputs visible, then recalculate when they change. An example ratio is a check to review, not a promise of eligibility.