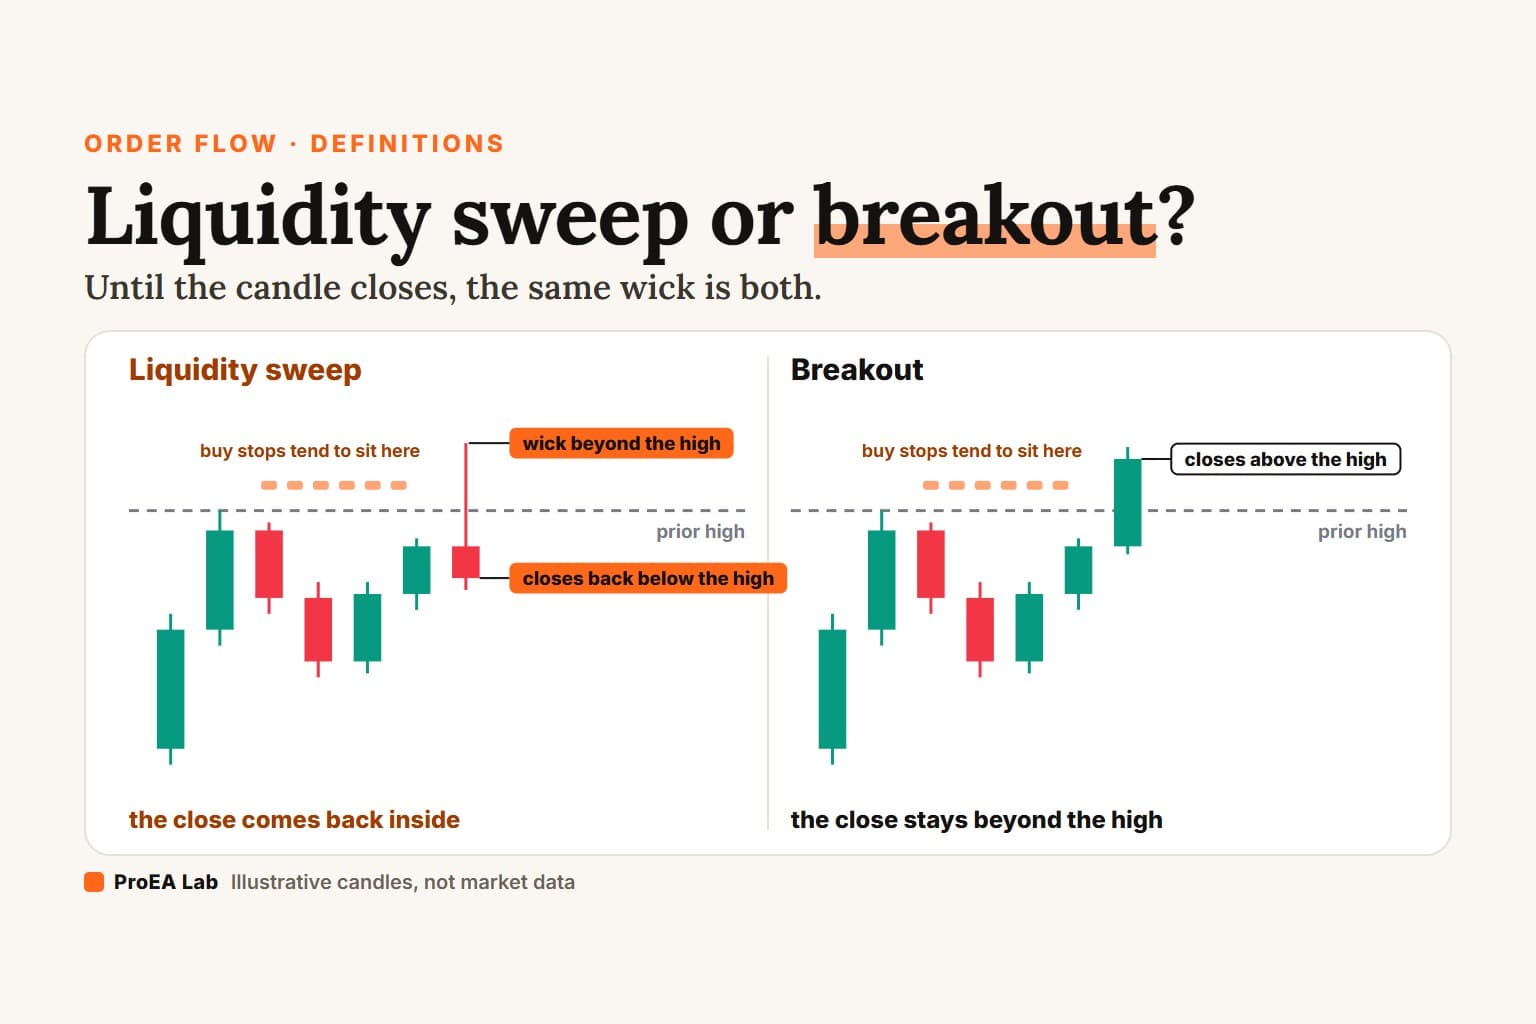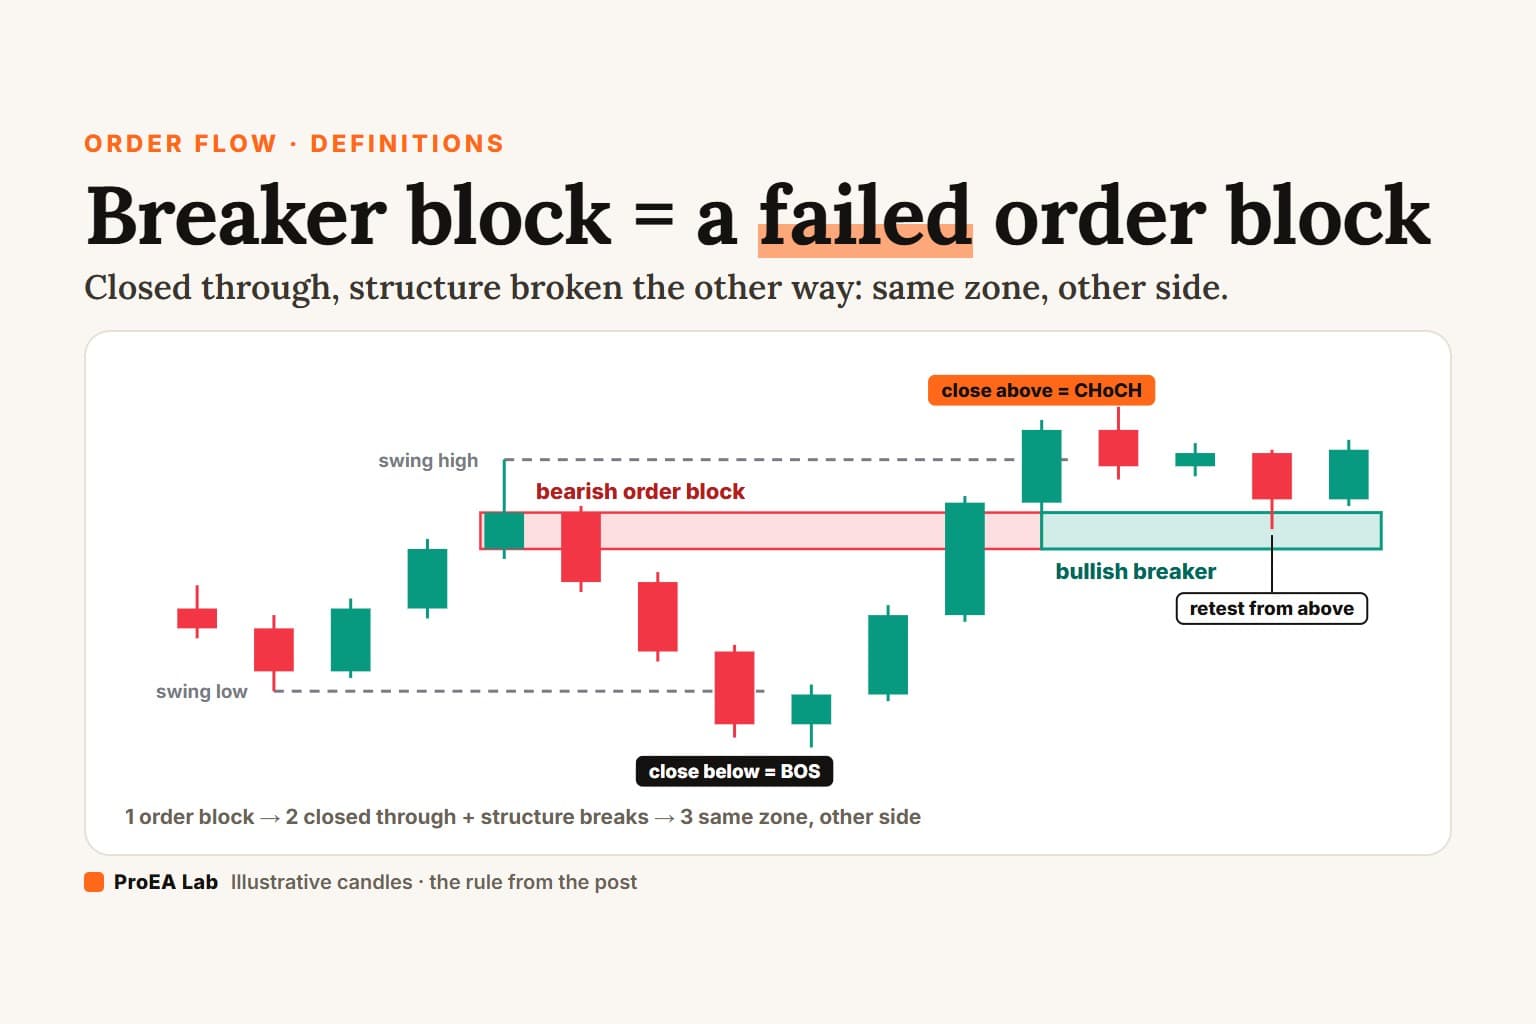
A breaker block is an order block that failed. A candle closed through it while structure broke the other way, and from then on the same zone is watched from the other side. A bearish order block closed through on a break up becomes a bullish breaker, watched as support from above. A bullish order block closed through on a break down becomes a bearish breaker, watched as resistance from below.
A wick through the zone doesn't make one. Only closes do.
Every chart below is a replay of simulated candles, read by one written rule. It builds on BOS vs CHoCH and the order block.
What is a breaker block?
Three closes make one. A close beyond a swing creates the order block. A close through the order block's far edge breaks it. A close beyond the next swing the other way confirms the turn. From the later of those last two closes, the zone is a breaker, facing the other way.
Simulated 15-minute candles, not market data. Swings are confirmed by 3 candles on each side; order blocks follow SMC Basics' rule. No ProEA indicator draws breakers; the breaker marks are this article's rule.
Read as text
- A candle closes below the last swing low at 115.61: a BOS. The last up candle before it is a bearish order block, 115.64 to 115.78 (body).
- 3 candles after the break a candle closes above the zone; the close above the swing high at 116.02 (a CHoCH) comes 10 candles after the break.
- From that close the same zone is a bullish breaker: price is now above it, and it is watched as support.
- 8 candles later price trades back into it from above: the breaker's first retest. The film stops there; what can happen next is the last film's subject.
How this window was chosen: The first 15-minute window of the simulated market in which a bearish order block with a visible body is closed through 3 to 12 candles after the break that made it, structure breaks up by then, and price first trades back into the zone from above 3 to 12 candles later, without closing through it on that candle. The film ends on that retest; the last film shows what can come next.
Use itMark the order block's far edge the moment it exists. A close beyond it, plus a break of structure the same way, is the flip.
Watch outA close through the zone alone is a failed order block. Until structure breaks the same way, it isn't a breaker.
Breaker block vs order block
| Order block | Breaker block | |
|---|---|---|
| Starts as | the last opposite candle before a break | an order block |
| Made by | a close beyond a swing | a close through the zone, plus a break the other way |
| Price sits | on the zone's original side | on the other side |
| A bullish one is | the last down candle before a break up | a bearish order block that failed |
| Ends on | a close beyond its far edge | a close beyond its new far edge |
Breaker vs mitigation block: what's the difference?
The swing before the break. If the drop from the high closed below the low before it, a new low, the block is a breaker. If the drop never closed below that low, it's a mitigation block. Then price closes above the high in both.
Simulated 15-minute candles, not market data. Swings are confirmed by 3 candles on each side; order blocks follow SMC Basics' rule. No ProEA indicator draws breakers; the breaker marks are this article's rule. Both blocks are drawn from the last up candle at or before the swing high.
Read as text
- A swing low at 74.38, then a swing high at 75.21. The last up candle at or before the high is the candle both blocks are drawn from: 75.01 to 75.17 (body).
- The drop from the high closes below 74.38: a new low and a BOS. By the order-block rule, that same up candle is now a bearish order block.
- A candle closes above the high at 75.21: a CHoCH.
- The order block failed after taking the low: the up candle's zone is a bullish breaker.
How this window was chosen: The first window in which a drop from a swing high closes below the swing low before that high (a new low), the order block of that close is the last up candle at or before the high and has a visible body, and a later close above the high comes within 12 candles of the drop's low. Each film's window starts after the windows of the films above it, so no two films share candles.
By our order-block rule, only the breaker was an order block before it failed. The drop that held above the low never closed below a swing, so nothing broke and no order block formed.
A drop that only wicks below the low and closes back is a liquidity sweep, not a close. By this page's rule it makes no order block, so the block counts as a mitigation block, not a breaker. Tools that read swings from wicks, like the EmreKb script below, may call it a breaker.
Use itBefore you call it a breaker, check one thing: did the move before the break close beyond the prior low (or high)?
Watch out'Mitigation' alone often means a zone's first retest, and some sites use 'mitigation block' for a retest in the zone's own direction. Say which one you mean.
Does a wick through the order block count?
No. A wick beyond the far edge that closes back is a touch, and the order block is still there. In the film the zone survives its wick and flips later, on a close.
Simulated 15-minute candles, not market data. Swings are confirmed by 3 candles on each side; order blocks follow SMC Basics' rule. No ProEA indicator draws breakers; the breaker marks are this article's rule.
Read as text
- A close below the swing low at 84.86 (a CHoCH) makes the last up candle a bearish order block: 85.36 to 85.61 (body).
- 6 candles later a wick trades above 85.61, the zone's top, but the candle closes back at or below it. The order block is touched, not broken: no breaker.
- 7 candles after the wick, a candle closes above the zone and above the swing high at 85.62: a CHoCH. That close makes it a bullish breaker.
How this window was chosen: The first window in which a candle's wick trades beyond a bearish order block's top and closes back inside or below it, and at least 3 candles later a close above the top, with a break of structure up, turns the zone into a breaker. Each film's window starts after the windows of the films above it, so no two films share candles.
Use itWait for the candle to close. Then ask two things: beyond the far edge, and did structure break too?
Watch outA wick through the zone that closes back is the classic fake. Mark it as a touch, not a flip.
What happens when price comes back?
The first retest is the first candle back into the breaker from its new side. That's where breaker traders look for an entry. It can hold, or a candle can close back through it, and then the breaker is gone too. The film shows both; neither is a result.
Simulated 15-minute candles, not market data. Swings are confirmed by 3 candles on each side; order blocks follow SMC Basics' rule. No ProEA indicator draws breakers; the breaker marks are this article's rule. Both outcomes are shown; neither is a result.
Read as text
- A bearish order block (140.90 to 141.10) fails: a close above it and a close above the swing high at 141.19 (a CHoCH) make it a bullish breaker.
- 8 candles later price trades back into the zone from above: its first retest.
- That candle closes back above the zone, and no candle closes below the zone for the rest of the film, 8 more candles.
How this window was chosen: The first window in which a bullish breaker's first retest comes 3 to 12 candles after it was confirmed and closes back above the zone, and no candle closes below the zone for the next 8 candles (the rest of the film). Each film's window starts after the windows of the films above it, so no two films share candles.
Use itPut the stop beyond the breaker's new far edge, and write down the close that cancels the idea.
Watch outA breaker fails like any zone: on a close. One that's been closed back through is finished.
How to spot a breaker block, step by step
- Fix the timeframe, the swing length and body or wick before you look.
- Find the order block: the last opposite candle before a close beyond a swing.
- Mark its far edge: the top of a bearish zone, the bottom of a bullish one.
- Wait for a candle to close beyond that edge.
- Check structure: has a candle closed beyond the next swing the other way? Once both have happened, it's a breaker.
- Check the move before the break. Closed beyond the prior low (or high): breaker. Didn't: mitigation block.
- Watch for the first retest from the new side. A close back through ends it.
Which timeframe works best?
We haven't compared timeframes, so we can't name a best one. The rule is the same on every chart. Pick the timeframe before you look, and read every break on that timeframe's closes.
Common mistakes
- Calling a wick a break. Only a close beyond the far edge counts.
- Skipping the structure break. A zone closed through with no break the other way is a failed order block, not a breaker.
- Mixing up breaker and mitigation block. Ask whether the move before the break closed beyond the prior low or high.
- Keeping a breaker after a close back through it. It's gone.
- Switching between body and wick to fit the trade you want.
- Mixing timeframes. A 5-minute breaker is not a 4-hour one.
Do breaker blocks work?
Which tools draw breaker blocks?
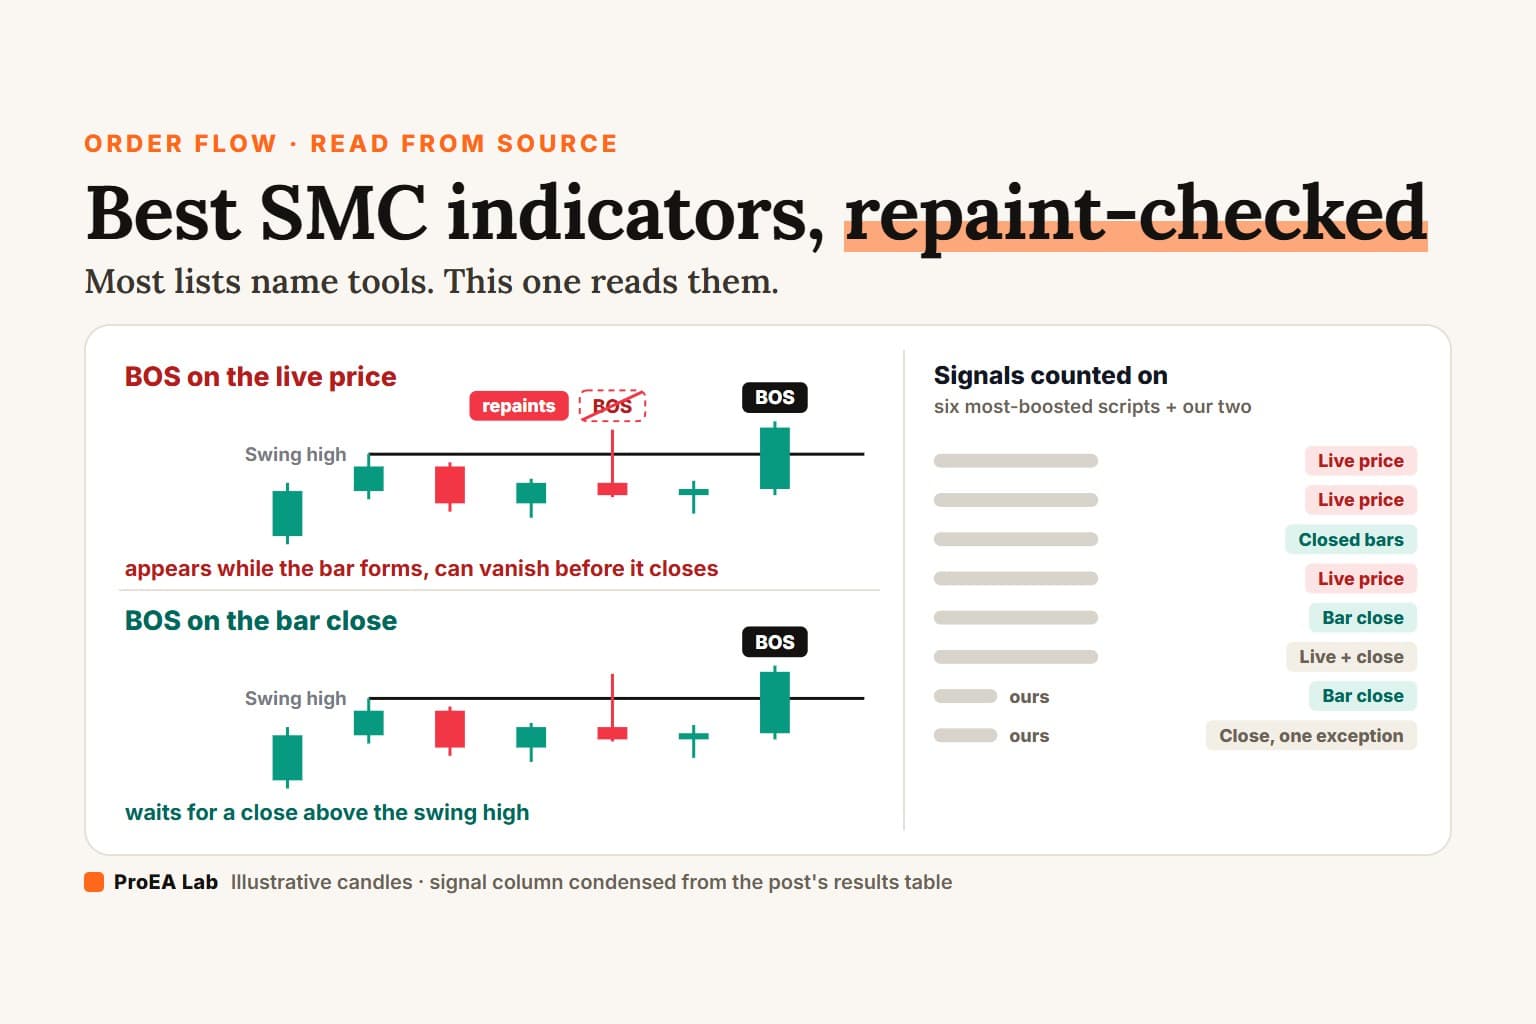
None of ours. We read the Pine source of each. SMC Basics deletes an order block when a candle closes through it. The SMC AI-Scored Toolkit (v1.4.1) marks the zone mitigated and drops it. Neither flips a zone or labels a breaker.
Half of it on your own chart, free. SMC Basics draws order blocks with this page's rule. Turn on "Keep mitigated zones as ghost outlines" and every closed-through order block stays as a grey outline that ends at the candle that closed through it. That's the first half of a breaker. For the second half, Signal Desk labels BOS and CHoCH on closed candles (View preset Pro). Set both to the same swing length; their defaults differ, 10 and 5 candles a side.
Two free TradingView scripts we source-checked for our SMC indicator comparison do draw breakers, each with its own rule (source read 2026-10-03):
- Market Structure Break & Order Block by EmreKb draws a breaker at each market structure break: for a bullish one, the last up candle at or before the previous swing high, high to low. It labels it Bu-BB if the low before the break was a lower low and Bu-MB, a mitigation block, if not (lines 152 and 159). That's the second film's split, with the lower low read from wicks rather than a close. Its breaks come from 9-bar zigzag swings plus a 0.33 Fibonacci margin, not from a close.
- Order Blocks by Flux Charts turns an order block into a breaker as soon as price trades past its far edge, by wick by default (a Close option uses candle bodies), with no structure-break check. It deletes the breaker when price trades back past the other edge (lines 16 and 256 to 263).
Same name, three rules. Check which one a tool uses before you trust its boxes.
The same flip happens to gaps. A fair value gap that a candle closes through is an inversion gap, and IFVG Desk, free, draws those on closed candles.
Disclosure
We build SMC Basics and Signal Desk and give both away; we sell other indicators, including the SMC AI-Scored Toolkit. We have no relationship with EmreKb or Flux Charts. Nothing here is financial advice.
Use these animations on your site.