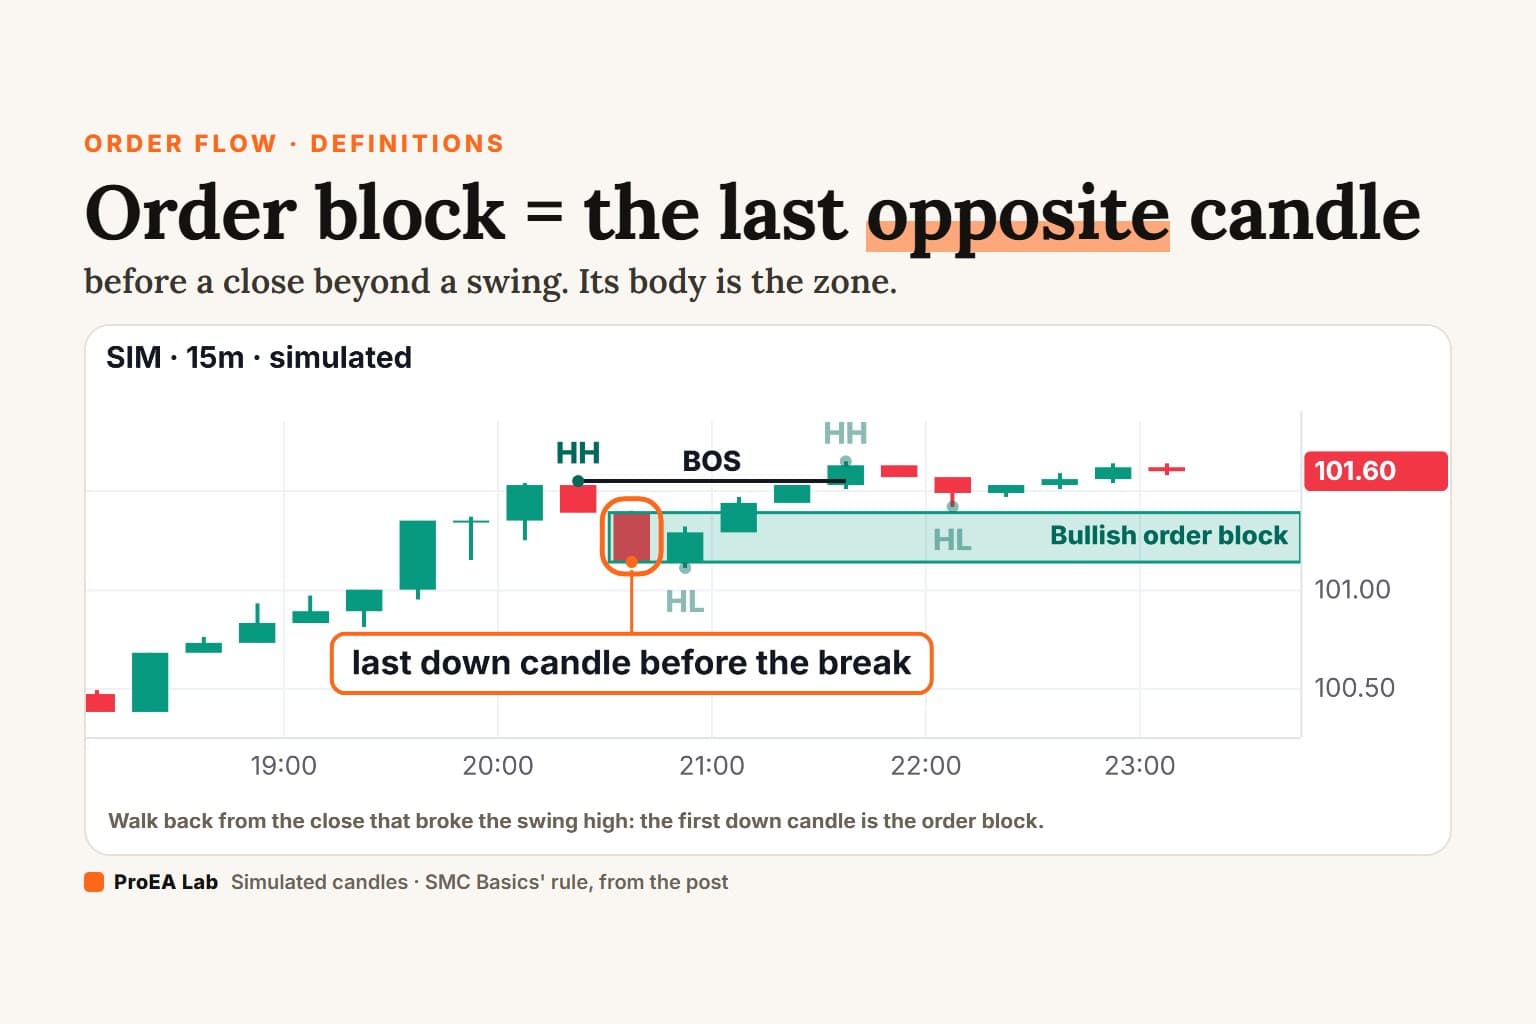
An order block is the last candle that closed against a move right before that move broke structure. Before a close above the last swing high, it's the last down candle: a bullish order block. Before a close below the last swing low, it's the last up candle: a bearish one. Its body, open to close, is the zone.
No break, no order block. That one rule separates it from every other candle on the chart.
Every chart below is a replay of simulated candles, read by that rule. If "break of structure" is new to you, start with BOS vs CHoCH. It's one step of our smart money concepts guide.
What is an order block?
Find the break first: a candle that closes beyond the last confirmed swing. Then walk back from the candle before it, one at a time, to the first candle that closed the other way. That candle is the order block. Its zone exists from the breaking candle's close on, never before.
Simulated 15-minute candles, not market data. Swings are confirmed by 3 candles on each side; zones follow SMC Basics' order-block rule.
Read as text
- The last confirmed swing high sits at 101.55; it is known 3 candles after it printed.
- A candle closes above 101.55: a break of structure (BOS).
- Walking back from the candle before the break, the first down candle is 4 candles back. That candle is the order block.
- Its body, 101.14 to 101.39, is the zone. It exists only from the close of the breaking candle on.
How this window was chosen: The first 15-minute window of the simulated market in which a close above a confirmed swing high, with structure already up (a BOS), creates an order block with a visible body at least 3 candles before the break, the breaking candle stays above the zone, and price stays out of the zone for the next 6 candles.
Use itFind the close beyond the swing first. Then walk back to the last opposite candle.
Watch outUntil the breaking candle closes, there is no order block. There's only a guess about one.
Body or wick: which part is the zone?
Pick one and keep it. The body, open to close, gives a tighter zone. It's what SMC Basics draws by default. The wicks, high to low, give a wider zone that price reaches more often. Same candle, two zones, and they can disagree about whether price came back.
Simulated 15-minute candles, not market data. Swings are confirmed by 3 candles on each side; zones follow SMC Basics' order-block rule. The dashed box is the other convention.
Read as text
- A close above the swing high at 183.35 breaks structure (a BOS); the last down candle before it is the order block.
- Drawn from its body (open to close), the zone is 181.81 to 182.58. Drawn from its wicks (low to high), it is 181.81 to 182.80.
- The first candle back reaches 182.64: inside the wick zone, above the body zone.
- With bodies, the zone is still untouched; it is first touched 1 candles later.
How this window was chosen: The first window in which the first candle to come back to a bullish order block (4 to 14 candles after it formed) trades into the zone drawn from the wicks but not into the zone drawn from the bodies, the order block's body and its upper wick are each at least 40% of an average candle, and no other break of structure comes in between. Each film's window starts after the windows of the films above it, so no two films share candles.
Use itWrite your convention down once: body or wick.
Watch outSwitch it trade by trade and every zone 'worked' in hindsight.
What is mitigation?
The first retest: the first time price trades back into the zone. Many traders call that mitigation. A retest fades the zone, but it doesn't end it. A candle that closes beyond the zone's far edge does: below a bullish zone, above a bearish one. From that close on, the zone is invalid. If structure then breaks the same way, some traders watch the zone from the other side: a breaker block.
A mitigation block is a different thing despite the name: the up candle at a lower high, once a drop from it fails to make a new low and price closes back above the high.
When the first pullback after the break stops short of the zone, its low is called the inducement. Price has to trade through it to get back to the zone.
Simulated 15-minute candles, not market data. Swings are confirmed by 3 candles on each side; zones follow SMC Basics' order-block rule. The price tag marks the zone's far edge.
Read as text
- A close above the swing high at 108.23 breaks structure (a CHoCH) and makes the last down candle an order block: 107.94 to 108.02 (body).
- 8 candles later price trades back into the zone for the first time: its first retest.
- That candle closes back above the zone. A touch fades the zone; it does not end it.
- No candle closes below the zone's far edge for the rest of the film, so the zone stays valid.
How this window was chosen: The first window in which a bullish order block with a visible body is first retested 4 to 14 candles after the break, with no other break of structure in between, the retest candle closes back above the zone, no candle closes through the zone in the next 8 candles (the rest of the film), and the film's price range is at most 6 times the zone's height, so the zone reads on a phone. Each film's window starts after the windows of the films above it, so no two films share candles.
Use itMark the far edge as soon as the zone exists. That's the line whose close ends it.
Watch outA wick through the far edge is not a close. A zone you keep after a close through it is a wish.
Order block or just a down candle?
Every rally starts after a down candle. Most of those candles are not order blocks, because the rally never closes beyond a swing. In the film, three up candles stop under the high: no break, so no order block. The real one comes later, from the last down candle before the close that breaks.
Simulated 15-minute candles, not market data. Swings are confirmed by 3 candles on each side; zones follow SMC Basics' order-block rule.
Read as text
- The last confirmed swing high sits at 69.20.
- A down candle is followed by three up closes, but none closes above 69.20. No break, so that down candle is not an order block.
- 4 candles later a candle closes above 69.20: a BOS.
- The last down candle before that break, 6 candles after the first one, is the order block (68.93 to 69.00).
How this window was chosen: The first window in which a down candle is followed by three up closes in a row that stay below the last confirmed swing high (no break), and a later close above that same swing high creates an order block with a visible body from a later down candle. Each film's window starts after the windows of the films above it, so no two films share candles.
Use itAsk one question of any candle: did a close beyond a swing follow it?
Watch outA strong rally that stops below the high is still not a break.
How to identify an order block, step by step
- Pick the timeframe and the swing length before you look.
- Mark the last confirmed swing high and swing low.
- Wait for a candle to close beyond one. That close is the break.
- Walk back from the candle before it, up to 20 candles, to the first one that closed the other way.
- Draw its body (or its wicks, if that's your rule) to the right.
- Fade it on the first retest. Delete it on a close beyond the far edge.
Where the zone sits in the range matters to many traders too: a bullish order block below the 50% line of the leg that broke structure is in discount. See premium and discount.
Same rule every time, so two traders draw the same box.Common mistakes
- Marking a candle with no break after it. No close beyond a swing, no order block.
- Picking the biggest opposite candle in the leg. It's the last one before the move, not the loudest.
- Drawing it before the break closes. Until then it's a guess, and guesses repaint.
- Switching between body and wick to fit the trade you want.
- Keeping a zone after a close through it. It's gone.
- Mixing timeframes. A 5-minute order block is not a 4-hour one.
Grading a zone and planning the trade is a separate job: order block trading strategy.
What did we measure?
Which tools draw order blocks?
Draw them on your own chart. SMC Basics is our TradingView indicator, in Pine Pro Library, that draws order blocks with this page's rule: the first close through a confirmed swing, then the last opposite candle within 20 candles, the body by default with a wick option. It fades a zone on the first touch and removes it when a candle closes through the far edge. Its swings use 10 candles a side by default.
The SMC AI-Scored Toolkit ($39 one-time, on its page) starts from the same rule on 15-candle swings. By default it draws the body and removes a zone on a close through its far edge. Then it scores every zone 0–100 at birth. On our gold test that score did no better than a shuffle (above). And up to v1.4.0, one of its five factors read the still-forming 4-hour bar live; v1.4.1 reads the last closed one (our repaint check).
Supply & Demand Desk, also in the library, draws a cousin: a zone from a down candle followed by an up candle, drawn from the wicks, kept only if the move away reaches 0.8 ATR. It needs no structure break, and a close back into the zone ends it.
Disclosure
We build SMC Basics and Supply & Demand Desk and sell both in Pine Pro Library; we also sell the SMC AI-Scored Toolkit. Nothing here is financial advice.
Use these animations on your site.