1. The OB retest
Mark a confirmed Order Block, then watch whether price returns. Describe what happens inside it and whether a close passes the far edge. A visit alone is not an entry.
SMC Basics · Free
See why a price area gets marked, what happens when price returns, and when the box disappears.
Automatic chart zones. No buy/sell signals.
A confirmed swing break or three-candle gap.
Fixed order blocks; gaps with their midpoint.
Fresh, touched, then removed when invalidated.
SMC Basics is a free TradingView indicator for order blocks, fair value gaps and gap midpoints. It draws zones from defined candle and swing rules, fades touched zones, and removes them after a confirmed close beyond the far edge. The visual guide explains when each box becomes known and what its boundaries mean.
The script first waits for a confirmed swing and a close beyond it, then selects an earlier opposite candle. The default swing needs ten later bars to confirm. The older box origin is not its detection time. Open How an Order Block is chosen
The creation candle can satisfy this script's touch rule, so a newly drawn gap may start faded. That does not prove a later revisit. Removal still requires a confirmed close strictly beyond the zone's far edge. Open Why a box fades or disappears
This version draws zones on the chart timeframe and has no alert conditions or automatic higher-timeframe zone feed. To compare timeframes, use the manual two-chart routine. It does not provide an entry ticket or setup grade. Open What this tool does not do
Price sometimes moves sharply, then returns to an earlier area. These ideas give you places to watch.
1 / 4
Its thin wick reaches $101. That is the highest price during this candle. There is no box yet.
SMC Basics finds these patterns for you. It also marks earlier candles as Order Blocks, explained next. “Smart Money Concepts” names these chart ideas; the boxes cannot tell you who traded or why.
A candle summarizes price during one time period. Its thick body joins the opening and closing prices. Its thin wicks reach the highest and lowest prices. Once the period ends, the candle closes. This tool checks its patterns at that point.
Use a box to choose an area to study. Watch price there, decide what would make your idea wrong, and plan your entry and exit. Across trades, gains must cover losses and costs. A box alone does not make a trade profitable.
Start with one pattern. Follow its story one candle at a time.
Press Play, or move one candle at a time.
Let a turning point form. Follow the candles. The tool needs a confirmed high before it can mark this upward pattern.
No. The halfway line helps you describe price’s location. Removal requires a confirmed close beyond the far edge: below an upward zone or above a downward zone.
Gold · 15-minute candles · OANDA. Look for the labels first, then the box edges.
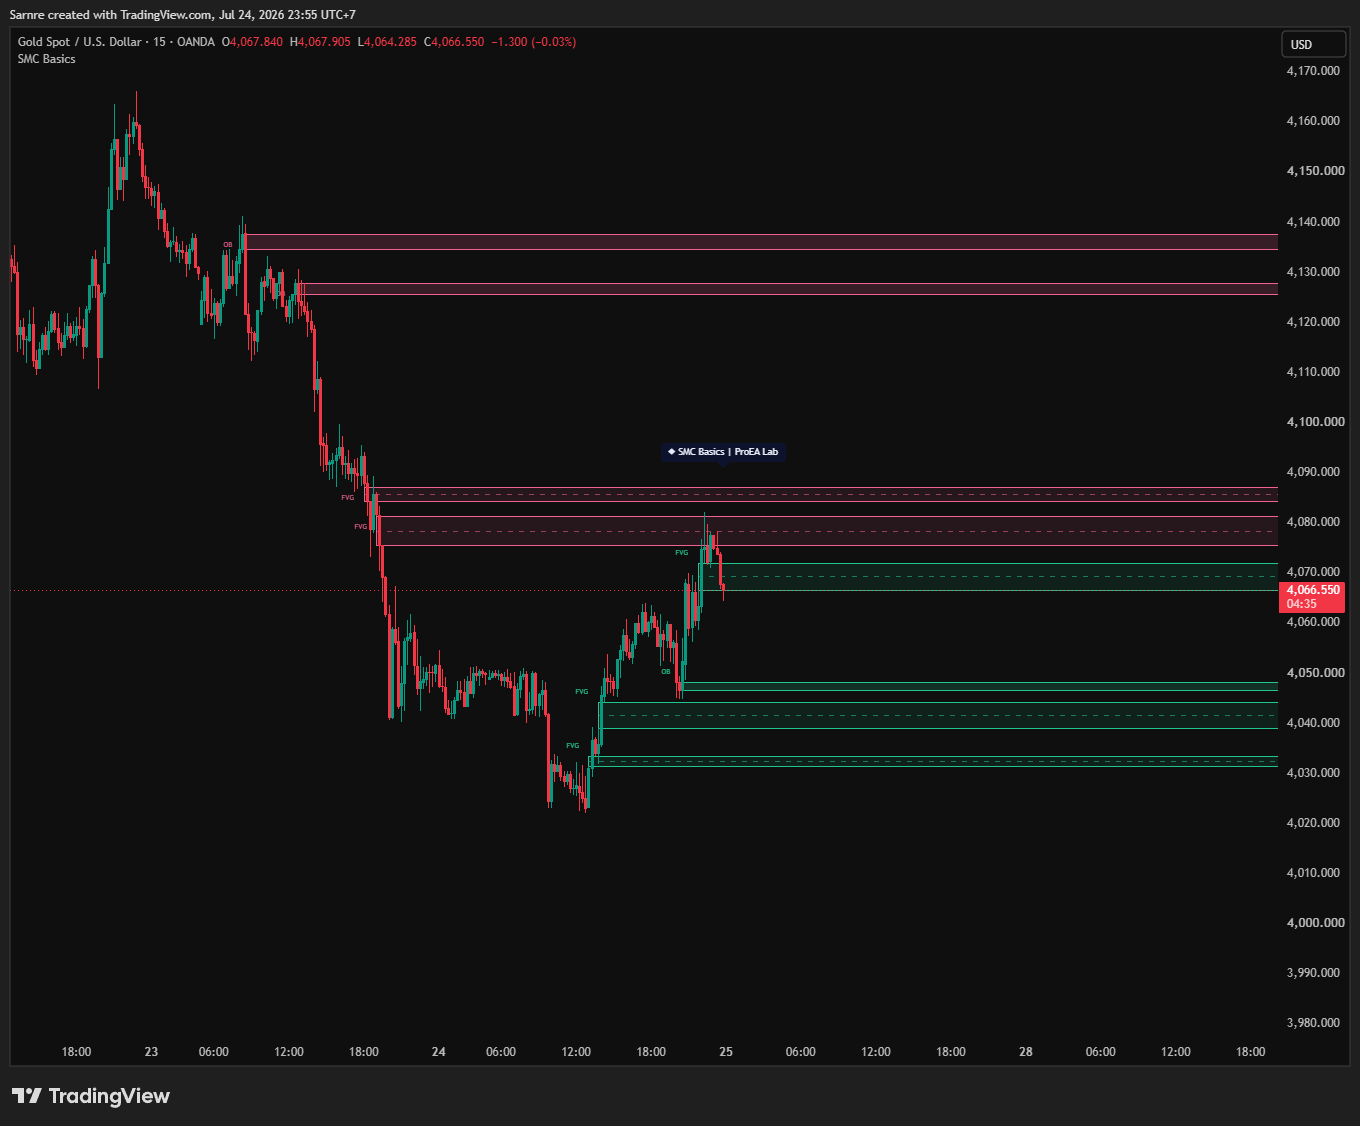
The upper pink box marks an earlier candle. Its top and bottom define the area. It has no halfway line.
The green box near the current price has a dashed halfway line. The indicator calls this the CE midline.
Color describes direction. Green marks an upward pattern; pink marks a downward pattern. Both OB and FVG can use either color. Read the label to tell them apart.
Free and open-source. Copy, paste, and keep it.
On a TradingView chart, use the Pine icon to open Pine Editor.
Copy the full code below. Paste it in place of the sample code.
Choose Add to chart, then save the script to keep it.
Copy the code as it is. No coding needed.
//@version=6
// ============================================================================
//  SMC Basics — ProEA Lab
// ----------------------------------------------------------------------------
//  Free, open-source Smart-Money-Concepts starter: auto-detected Order Blocks
//  and Fair Value Gaps with honest, non-repainting mechanics.
//
//  What it draws
//    · Order Blocks  — on a confirmed swing break (BOS), the last opposite
//      candle before the impulse. Geometry frozen at creation.
//    · Fair Value Gaps — 3-candle imbalances larger than an ATR-scaled minimum.
//    · Basic mitigation — zones fade once price trades into them and are
//      removed (or ghosted) once price CLOSES through the far edge.
//
//  Honest notes
//    · Swing points confirm `pivotLen` bars late by construction — that is what
//      makes them non-repainting. Nothing here predicts anything.
//    · This is the free sibling of the SMC AI-Scored Toolkit (scoring, sweeps,
//      regime, verdict, trade-plan ticket live there). This one stays simple
//      on purpose: the freshest zones only, drawn cleanly.
// ============================================================================
indicator("SMC Basics — ProEA Lab", "SMC Basics", overlay = true, max_boxes_count = 60, max_labels_count = 30, max_lines_count = 40)

// ===== 1 · INPUTS ===========================================================
G1 = "Structure"
pivotLen  = input.int(10, "Swing pivot length", minval = 3, maxval = 50, group = G1, tooltip = "Swing highs/lows confirm this many bars after they form — later, but honest.", display = display.none)

G2 = "Order Blocks"
showOB    = input.bool(true,  "Show Order Blocks", group = G2, display = display.none)
obUseWick = input.bool(false, "Use full wick (off = candle body)", group = G2, display = display.none)
obMax     = input.int(3, "Keep last … per side", minval = 1, maxval = 5, group = G2, display = display.none)

G3 = "Fair Value Gaps"
showFVG   = input.bool(true, "Show Fair Value Gaps", group = G3, display = display.none)
fvgMinAtr = input.float(0.3, "Min gap size (× ATR)", minval = 0.0, maxval = 2.0, step = 0.1, group = G3, display = display.none)
fvgMax    = input.int(3, "Keep last … per side", minval = 1, maxval = 5, group = G3, display = display.none)
showCE    = input.bool(true, "CE midline (50% of the gap)", group = G3, tooltip = "Consequent encroachment — the half-way line of an FVG. Pros judge a gap by how price behaves at this line.", display = display.none)

G4 = "Display"
showTags  = input.bool(true, "Zone tags (OB / FVG)", group = G4, display = display.none)
keepGhost = input.bool(false, "Keep mitigated zones as ghost outlines", group = G4, display = display.none)
showChip  = input.bool(true, "Header chip", group = G4, display = display.none)

// ===== 2 · PALETTE (fixed Aurora — matches the ProEA Lab family) ============
C_BULL  = color.new(#22c68c, 0)
C_BEAR  = color.new(#f06292, 0)
C_BULLF = color.new(#22c68c, 82)
C_BEARF = color.new(#f06292, 82)
C_BULLT = color.new(#22c68c, 90)   // touched (faded) fill
C_BEART = color.new(#f06292, 90)
C_GHOST = color.new(#8a93a6, 78)
C_CHIP  = color.new(#0e1430, 8)
C_TXT   = color.new(#e8ecf8, 0)

// ===== 3 · SHARED SERIES (all ta.* global) ==================================
atr14   = ta.atr(14)
phPrice = ta.pivothigh(high, pivotLen, pivotLen)
plPrice = ta.pivotlow(low,  pivotLen, pivotLen)
// the OB scan reads candles at a dynamic offset — size the buffers explicitly
max_bars_back(open, 60)
max_bars_back(high, 60)
max_bars_back(low, 60)
max_bars_back(close, 60)

// ===== 4 · TYPES + STATE ====================================================
// state: 0 = fresh · 1 = touched · 2 = mitigated
type Zone
    box    bx
    label  tg
    line   ce                // FVG only: the 50% (consequent encroachment) midline
    int    kind   = 0        // 0 = OB, 1 = FVG
    int    side   = 1        // 1 = bull, -1 = bear
    float  top    = na
    float  bottom = na
    int    state  = 0

var array<Zone> zones = array.new<Zone>()

// swing structure memory (committed on confirmed bars only)
var float lastSwingHi  = na
var float lastSwingLo  = na
var int   lastHiBar    = na
var int   lastLoBar    = na
var bool  brokeUpOnce  = false
var bool  brokeDnOnce  = false

// ===== 5 · HELPERS ==========================================================
zoneFill(int side, int state) =>
    state == 1 ? (side == 1 ? C_BULLT : C_BEART) : (side == 1 ? C_BULLF : C_BEARF)

// removes the oldest zones of one (kind, side) beyond the cap — keeps freshest
enforceCap(array<Zone> pool, int kind, int side, int cap) =>
    if array.size(pool) > 0
        count = 0
        for i = array.size(pool) - 1 to 0
            z = array.get(pool, i)
            if z.kind == kind and z.side == side and z.state != 2
                count += 1
                if count > cap
                    box.delete(z.bx)
                    label.delete(z.tg)
                    line.delete(z.ce)
                    zDrop = array.remove(pool, i)
                    true

// hard ceiling on the whole pool (ghosts included) so nothing grows unbounded
prunePool(array<Zone> pool) =>
    if array.size(pool) > 36
        z = array.get(pool, 0)
        box.delete(z.bx)
        label.delete(z.tg)
        line.delete(z.ce)
        zDrop = array.remove(pool, 0)
        true

registerZone(array<Zone> pool, int kind, int side, float zTop, float zBot, int leftBar, int cap) =>
    kindTxt = kind == 0 ? "OB" : "FVG"
    bx = box.new(leftBar, zTop, bar_index, zBot,
         border_color = side == 1 ? C_BULL : C_BEAR, border_width = 1,
         bgcolor = side == 1 ? C_BULLF : C_BEARF, extend = extend.right)
    label tg = na
    if showTags
        tg := label.new(leftBar, zTop, kindTxt,
             style = side == 1 ? label.style_label_lower_right : label.style_label_upper_right,
             color = color.new(color.black, 100), textcolor = side == 1 ? C_BULL : C_BEAR,
             size = size.tiny)
    line ceLn = na
    if kind == 1 and showCE
        mid = (zTop + zBot) / 2
        ceLn := line.new(leftBar, mid, bar_index, mid, extend = extend.right,
             color = side == 1 ? color.new(#22c68c, 45) : color.new(#f06292, 45),
             style = line.style_dashed, width = 1)
    z = Zone.new(bx, tg, ceLn, kind, side, zTop, zBot, 0)
    array.push(pool, z)
    enforceCap(pool, kind, side, cap)
    prunePool(pool)

// mitigation pass — runs on confirmed bars only; geometry never changes
updateZones(array<Zone> pool, float hi, float lo, float cl, bool ghost) =>
    if array.size(pool) > 0
        for i = array.size(pool) - 1 to 0
            z = array.get(pool, i)
            if z.state == 2
                continue
            mitigated = z.side == 1 ? cl < z.bottom : cl > z.top
            touched   = z.side == 1 ? lo <= z.top   : hi >= z.bottom
            if mitigated
                z.state := 2
                line.delete(z.ce)
                if ghost
                    box.set_bgcolor(z.bx, color.new(color.gray, 100))
                    box.set_border_color(z.bx, C_GHOST)
                    box.set_extend(z.bx, extend.none)
                    box.set_right(z.bx, bar_index)
                    label.delete(z.tg)
                    true
                else
                    box.delete(z.bx)
                    label.delete(z.tg)
                    zGone = array.remove(pool, i)
                    true
            else if touched and z.state == 0
                z.state := 1
                box.set_bgcolor(z.bx, zoneFill(z.side, 1))
                true

// ===== 6 · COMMIT (barstate.isconfirmed — nothing here repaints) ============
if barstate.isconfirmed
    // -- remember confirmed swings ------------------------------------------
    if not na(phPrice)
        lastSwingHi := phPrice
        lastHiBar   := bar_index - pivotLen
        brokeUpOnce := false
    if not na(plPrice)
        lastSwingLo := plPrice
        lastLoBar   := bar_index - pivotLen
        brokeDnOnce := false

    // -- Order Blocks: first close through a confirmed swing = the break ----
    if showOB and not na(lastSwingHi) and not brokeUpOnce and close > lastSwingHi
        brokeUpOnce := true
        // last bearish candle before the impulse = bullish OB
        obBar = -1
        for k = 1 to 20
            if close[k] < open[k]
                obBar := k
                break
        if obBar > 0
            zTop = obUseWick ? high[obBar] : math.max(open[obBar], close[obBar])
            zBot = obUseWick ? low[obBar]  : math.min(open[obBar], close[obBar])
            registerZone(zones, 0, 1, zTop, zBot, bar_index - obBar, obMax)
    if showOB and not na(lastSwingLo) and not brokeDnOnce and close < lastSwingLo
        brokeDnOnce := true
        obBar = -1
        for k = 1 to 20
            if close[k] > open[k]
                obBar := k
                break
        if obBar > 0
            zTop = obUseWick ? high[obBar] : math.max(open[obBar], close[obBar])
            zBot = obUseWick ? low[obBar]  : math.min(open[obBar], close[obBar])
            registerZone(zones, 0, -1, zTop, zBot, bar_index - obBar, obMax)

    // -- Fair Value Gaps: 3-candle imbalance ≥ ATR minimum ------------------
    if showFVG
        bullGap = low > high[2] and (low - high[2]) >= fvgMinAtr * atr14
        bearGap = high < low[2] and (low[2] - high) >= fvgMinAtr * atr14
        if bullGap
            registerZone(zones, 1, 1, low, high[2], bar_index - 2, fvgMax)
        if bearGap
            registerZone(zones, 1, -1, low[2], high, bar_index - 2, fvgMax)

    // -- basic mitigation ---------------------------------------------------
    updateZones(zones, high, low, close, keepGhost)

// ===== 7 · RENDER (barstate.islast — display only) ==========================
var label chip = na
if barstate.islast
    label.delete(chip)
    chip := na
    if showChip
        chip := label.new(bar_index, high + atr14 * 3, "◆ SMC Basics | ProEA Lab",
             style = label.style_label_down, color = C_CHIP, textcolor = C_TXT, size = size.small)
Pivot length 10 · 3 zones of each type per direction · halfway lines on. Give the chart enough candles to confirm its turning points.
Open the topic that answers your next question.
A swing high or low is a turning point with enough candles on both sides. With the default pivot length of 10, it is only confirmed 10 candles later.
The first closed candle beyond that confirmed high or low is the break. For an upward break, the tool searches the previous 20 candles for the nearest down candle. For a downward break, it looks for the nearest up candle. If none exists, it draws no Order Block.
The box uses that candle’s body by default; you can include its wicks. It appears after the break, even though its left edge points to an older candle. A doji, with equal open and close, does not count as an opposite candle.
This is a chart pattern rule. It does not prove institutional orders or that buying or selling was absorbed there. The simulator’s circle and break line are teaching guides; the indicator draws the zone and tag.
For an upward gap, candle 3’s low is above candle 1’s high. For a downward gap, candle 3’s high is below candle 1’s low. The space between those prices becomes the box. No swing break is required.
Candle 2 can trade through that space. A gap between the first and third wicks does not mean no trades happened there.
The default size filter is 0.3 × ATR(14). ATR measures recent price movement; this filter leaves out gaps smaller than that threshold. The lesson includes 14 earlier candles for this calculation.
CE means consequent encroachment. It is simply the halfway price: (top + bottom) ÷ 2. Crossing it does not automatically break a zone, change its state, or produce an alert.
Fresh: a new zone has not met the script’s touch rule. Touched: price reaches its near edge and the fill fades. Its price boundaries stay fixed.
Removed: a confirmed close passes the far edge—below the bottom of an upward zone, or above the top of a downward zone. A wick beyond that edge, or a close exactly on it, does not trigger removal.
The script checks touching on the same candle that creates a box. A new FVG already meets that rule, so it starts faded. The shade alone does not prove a later visit.
With ghost outlines enabled, a removed zone leaves a gray outline ending at that candle. Its label and halfway line disappear. Older active zones can also be removed by the per-side cap. A total pool limit of 36 includes ghosts, so this is not permanent history.
These are observation exercises. Use your own rules for entry, exit, trade size, and loss limits.
Mark a confirmed Order Block, then watch whether price returns. Describe what happens inside it and whether a close passes the far edge. A visit alone is not an entry.
Compare price with the middle and the edges. Record whether price moves away or continues through. The middle helps describe the move; it does not decide whether it will succeed.
An OB and FVG may overlap. That gives two pattern references near the same price, but does not establish a higher chance of profit.
Compare recent confirmed highs and lows with the zone. A box is only one part of the chart. Decide in advance what would make your trade idea wrong.
Let your plan decide which areas matter. An empty chart may reflect settings, confirmation delay, or the zone cap. It does not tell you to trade or stay out.
Start with the defaults. Change one setting at a time and compare the result.
The default caps allow up to 12 active zones: 3 in each type-and-direction group. More boxes or a larger pivot setting do not automatically mean better trades. There is no session filter.
Comparing timeframes is a manual workflow. This free tool does not automatically combine their zones or provide an entry plan.
It marks chart patterns—never what price will do next. There is no zone score, liquidity sweep detector, regime filter, trade ticket, or alert.
New zones and state changes are committed when candles close. Pivot confirmation takes time. Once a zone exists, its price boundaries stay fixed, but it may fade or be removed.
This is a chart-reading tool, not financial advice. Practise with virtual money and check whether your complete plan works after losses and costs.
What shipped and what changed in SMC Basics, newest first. Ask for the next change below; what gets built lands here with a date, and on the lab queue on the front page.
SMC Basics Shipped
Tracks price zones left by a move until they break.
A small friction or a big idea. Tell us what would make this tool work better for you.
Requests for a new tool go on the same queue: see what is asked for and what is being built.