Somewhere right now a trader with a real edge is going broke.
Not because the edge stopped working.
Because of a number he never computed.
Every trader can recite their win rate. Almost none can state their probability of ruin — the odds that normal, expected losing streaks drive the account below the point of no return while the edge is working exactly as designed.
Ruin isn't a strategy failure. It's a sizing property — and it has a number, which means you can compute it before the market computes it for you.So we computed it. Not with a textbook formula that assumes fixed bets — with the same seeded Monte-Carlo engine that powers our free risk-of-ruin calculator, across a grid of trader profiles, 20,000 simulations per cell, every number reproducible from one command at the bottom of this page. The shape of what came back should change how you size tomorrow.
Two requests before we start:
- Save this next to your position-size settings.
- Send it to one trader who says "2% rule" like it's a spell that always protects.
Skip this if you want the table
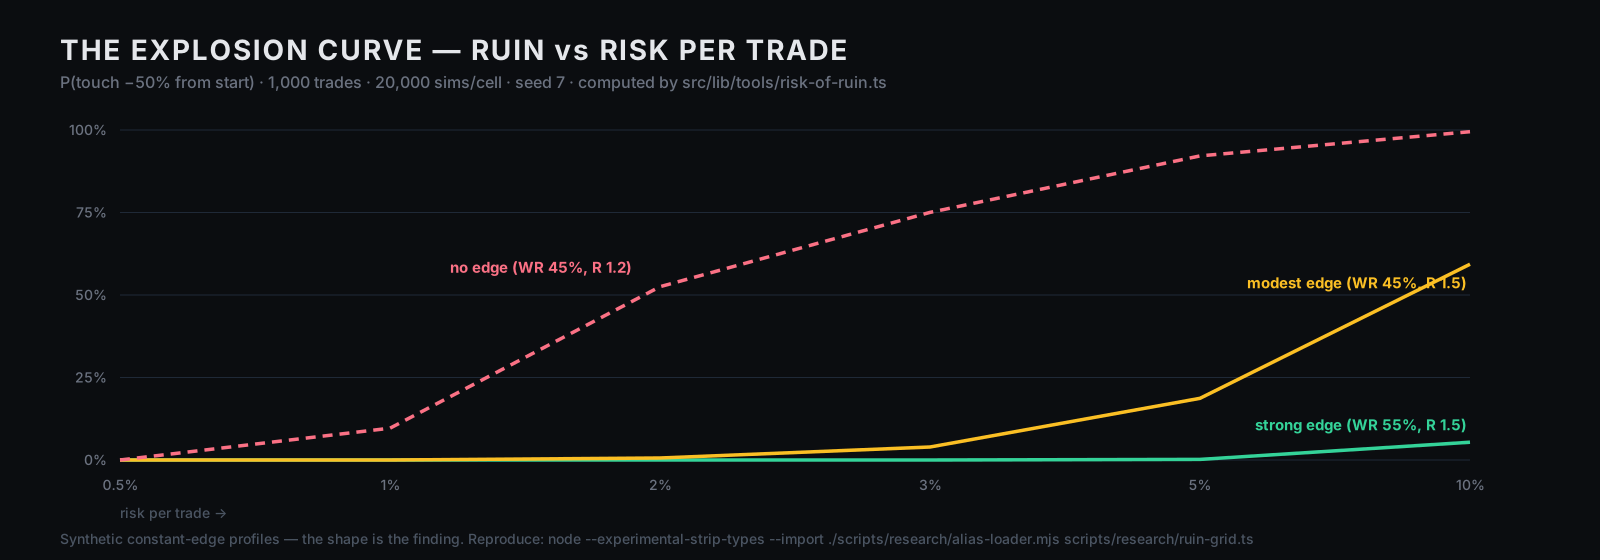
Sixty-second version: for a trader with a modest real edge (45% win rate, 1.5R reward — expectancy +0.125R per trade), the probability of touching −50% from starting equity within 1,000 trades, by risk-per-trade — computed, not guessed: 0.5% risk → 0.0% · 1% → 0.0% · 2% → 0.6% · 3% → 3.9% · 5% → 18.7% · 10% → 59.3%. The curve is not linear — from 2% to 5% risk, ruin multiplies ~31×. A strong edge (55% win rate) flattens the whole curve (0.2% ruin even at 5% risk); an almost-breakeven system (expectancy −0.010R — a rounding error from flat) turns 2% risk into a 52.5% coin flip. Two more findings the table hides: ruin is front-loaded in time (nearly all of it happens in the first few hundred trades — survive those and compounding carries you away from the fixed line), and ruin is defined by your line: the same good trader at 2% risk has a 0.6% chance of touching −50%… and a 43.0% chance of touching −10% — which is why traders with genuine edges keep failing prop challenges. All numbers: modelled, synthetic constant-edge profiles, seed 7, reproducible below.
| What traders assume | What the computed grid says |
|---|---|
| "I have an edge, so ruin isn't my problem" | A +0.125R edge at 5% risk was ruined in 18.7% of runs |
| "Risk scales linearly — 4% is twice as risky as 2%" | 2%→0.6%, 3%→3.9%, 5%→18.7% — it explodes, not scales |
| "The 2% rule is arbitrary" | At 2%, a modest edge's ruin ≈ 0.6%; at 5% it's 31× that |
| "More trades = more danger" | Ruin is front-loaded; the curve plateaus after ~500 trades |
| "Ruin means blowing to zero" | Your real ruin line is wherever you stop — for a prop account, −10%, and that universe is brutal |
The method — before the numbers
The engine. src/lib/tools/risk-of-ruin.ts — the exact code behind our public calculator. Deliberately a simulation, not a closed-form formula: classic ruin formulas assume one fixed bet size, but real fixed-fractional sizing compounds — each bet shrinks after losses and grows after wins, and the order outcomes arrive in changes the path. The engine plays the exact rule out and counts what happens.
The grid. Three synthetic profiles — modest edge (WR 45%, R 1.5), strong edge (WR 55%, R 1.5), almost-breakeven (WR 45%, R 1.2) — crossed with six risk-per-trade levels. Ruin = equity touching −50% from the starting balance at any point (start-relative, not running-peak — a deliberate distinction the engine's source documents). 1,000-trade horizon. 20,000 simulations per cell, mulberry32(7), fully deterministic.
What the question is. Not "will my system win" — the profiles assume the edge holds perfectly. The question is narrower and scarier: given an edge that works, what do normal losing streaks do to an account at each size?
I — The explosion curve
The centerpiece, computed. Probability of touching −50% within 1,000 trades, modest edge (WR 45%, R 1.5, expectancy +0.125R):
| Risk per trade | P(ruin) |
|---|---|
| 0.5% | 0.0% |
| 1% | 0.0% |
| 2% | 0.6% |
| 3% | 3.9% |
| 5% | 18.7% |
| 10% | 59.3% |
Read the middle of that table twice. From 2% to 3% — a change most traders would call cosmetic — ruin multiplies six and a half times. From 2% to 5%, thirty-one times. The relationship between risk-per-trade and ruin is not a slope; it's a cliff with a polite beginning. Doubling your risk doesn't double your ruin. It multiplies it — and the multiplier grows with every step.
II — What an edge buys you — and what almost-breakeven costs
Same grid, two more profiles.
The strong edge (WR 55%, R 1.5 — expectancy +0.375R) barely notices sizing sins: 0.0% ruin through 3% risk, 0.2% at 5%, and even a reckless 10% per trade ruins only 5.4% of runs. That's what edge actually buys: not immunity — headroom. The stronger the expectancy, the more sizing mistakes the distribution forgives.
The almost-breakeven system (WR 45%, R 1.2 — expectancy −0.010R, a rounding error from flat) is the horror row: 9.6% ruin at 1% risk. 52.5% at 2%. 92.2% at 5%. Sit with that: a system your spreadsheet can barely distinguish from breakeven, sized at the "safe" 2% rule, ruins more than half its accounts within 1,000 trades. This is the quantified version of something we keep writing from different angles: no sizing rule can rescue a missing edge — sizing decides how fast the distribution expresses itself, not which way it points.
Edge buys headroom. No edge means the sizing rule just picks your funeral date.III — Ruin is front-loaded — the finding we didn't expect
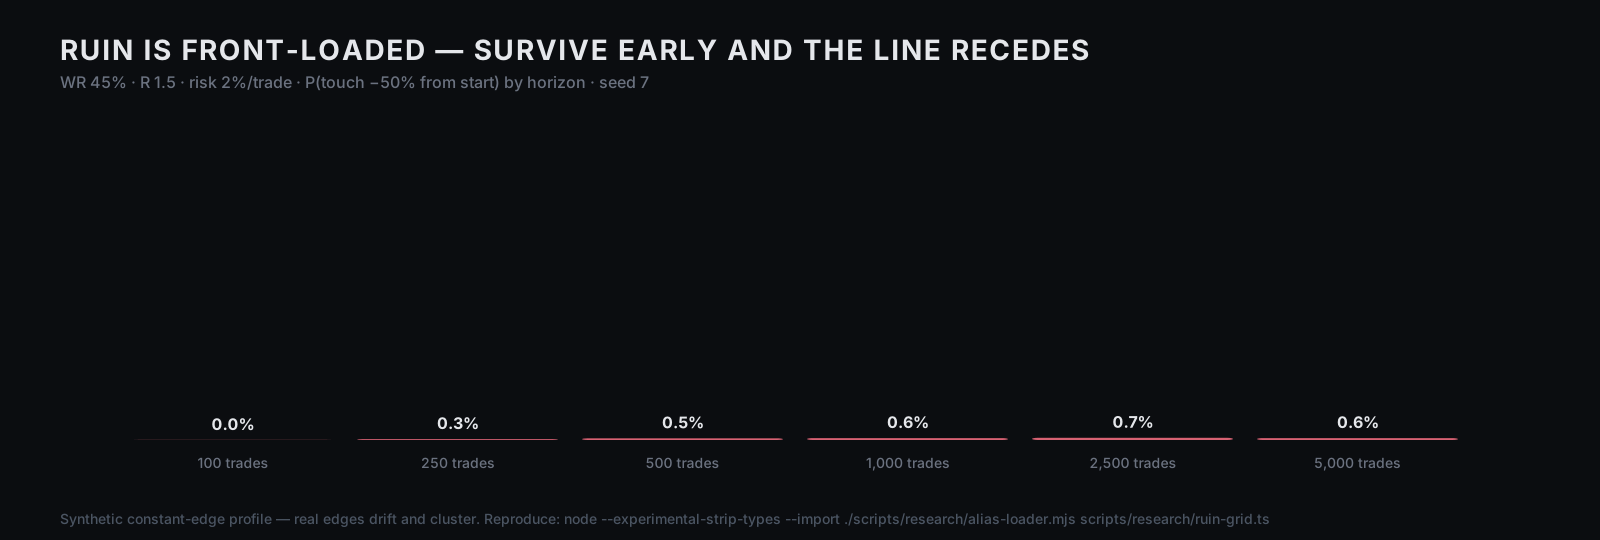
We assumed ruin would climb with horizon: more trades, more chances to die. The computed table disagreed, and the data wins:
| Horizon | P(ruin) — modest edge, 2% risk |
|---|---|
| 100 trades | 0.0% |
| 250 trades | 0.3% |
| 500 trades | 0.5% |
| 1,000 trades | 0.6% |
| 2,500 trades | 0.7% |
| 5,000 trades | 0.6% |
It plateaus. Almost all the ruin that will ever happen has happened by a few hundred trades — because the threshold is fixed at −50% from the start, and a surviving fixed-fractional account compounds away from that line. Every winning stretch moves the cliff further behind you.
The practical translation is worth framing: your account's mortal window is its first few hundred trades. That's when a normal losing streak and the ruin line are still neighbors. It's also the exact window when traders are most impatient — new system, fresh confidence, itching to size up. The math says the opposite: start smaller than feels necessary, survive the mortal window, and let compounding move the cliff away — then size up.
(One boundary on that comfort, before §IV makes it concrete: the receding-cliff effect belongs to fixed, start-relative lines. A ruin line that trails your equity peak never recedes — it follows you.)
IV — The −10% universe
Everything above defined ruin as −50% from start. But ruin isn't a law of nature — it's wherever your line is. A funded account fails at −10%. A spouse's patience might fail at −30%. Same trader, same 2% risk, same modest edge — only the line moves:
| "Ruin" defined as touching | P(hit) within 1,000 trades |
|---|---|
| −10% from start | 43.0% |
| −30% from start | 7.1% |
| −50% from start | 0.6% |
| −70% from start | 0.0% |
That first row explains a thousand angry forum threads. A trader with a genuine, working +0.125R edge, sized at the textbook 2%, will touch −10% at some point in 1,000 trades almost half the time — not through error, through ordinary variance. Under prop-firm rules, that touch isn't a drawdown; it's the exit. (And where that −10% trails your equity peak instead of sitting at the starting line — as many firms enforce — it's harsher still: the line ratchets up with your profits, so the front-loading reprieve from §III doesn't apply. Know which kind of line you're under before borrowing any comfort from these tables.) Which is why passing a −10%-line challenge with a real edge is largely a sizing-to-the-line problem — the consistency and drawdown arithmetic, not the strategy — and why "my edge is real but I keep failing challenges" is usually a true sentence with a computable cause.
The limits — before you ask
Synthetic profiles. Constant win rate, constant R, independent trades. Real edges drift, decay, and cluster losses (regimes exist); clustering makes real ruin worse than these tables, not better.
One threshold family. Start-relative lines, per the engine's spec. Running-peak drawdown is a different (and also important) statistic — the engine's source documents the distinction on purpose.
Not a forecast. These are properties of specified betting rules, not predictions for any real account — yours, ours, anyone's. The point is the shape: explosion in risk, headroom from edge, front-loading in time, and the tyranny of the line.
What this changes — three rules that fall out of the math
Size to your ruin line, not to a slogan. The 2% "rule" was computed for someone's line — find yours (−10% prop? −30% personal?) and size until the computed ruin at that line is a number you can say out loud. (The bet-sizing math picks the growth-optimal fraction; this study is the guardrail underneath it.)
Respect the mortal window. Half-size the first few hundred trades of any new account or system. The math literally rewards it: survive early, and the cliff recedes on its own.
Test the edge before trusting the size. The gap between +0.125R (0.6% ruin at 2%) and −0.010R (52.5%) is invisible in a month of screenshots — it's a measurement problem before it's a sizing one.
Where the calculator sits
No pitch needed, because the tool is the article: the risk-of-ruin calculator runs this exact engine — same code path, same seeded honesty, same start-relative threshold — free, client-side, no signup, your numbers never leave the browser. Put in your real win rate, your real R, your real line, and get the number this article says you should be able to state. The Monte-Carlo simulator shows the same math path-by-path if you'd rather see the streaks than the summary. Evidence, not prophecy — and this one you can hold in your hand.
Disclosure
Every number above is a computed property of a specified synthetic betting rule — modelled, labeled, reproducible — and none of it predicts any real account's outcome. The study's code, its engine (the same one shipped on the public calculator), and this article are in one commit. The question this page should leave you unable to un-ask: "What is my probability of ruin, at my size, against my line?" If you can't answer it, the market will — once, without showing its work.
Reproduce it
Every table in this article is printed by one committed analysis script that calls the public calculator's own riskOfRuin() engine across the full grid and regenerates both figures from the raw output. Change the fixed seed: the digits wobble, the cliff doesn't.
Your edge might be real.
Your discipline might be real.
The cliff is real too — and it was always computable.
Know your number before the market teaches it to you retail price.