There is a spreadsheet in your cloud drive named trading_journal_v2.
It has fourteen rows.
The last one is from months ago — the week you stopped, which was also the week you started losing.
That's not a coincidence, and it's not a discipline problem.
The journal died because it was built to die: it recorded how trades felt instead of what they proved, and feelings are the one thing you refuse to file on a losing day.
A trading journal isn't a diary. It's evidence — and evidence has a schema: five columns that convict, sixty seconds a trade, a twenty-minute autopsy every Sunday.Two requests before we start:
- Save this next to that dead spreadsheet — the contrast is the lesson.
- Send it to one trader who "journals" in screenshots and vibes.
Skip this if you want the template
Sixty-second version: journals die because they're diaries — unbounded prose, twenty fields, and an unspoken rule that losing days don't get filed. Build evidence instead. Log ten columns per trade, five of which do the real work: R (result as a multiple of what you risked — the only number that makes trades comparable), setup (one tag from a closed menu of 3–7, never freetext), session (when — leaks love a time zone), plan? (a binary: did you follow the written rule, yes or no), and why-before (one line, written before entry — the only honest version of your reasoning that will ever exist). Cap logging at about a minute a trade, because any journal that takes five minutes will be skipped exactly on the days that matter. Then review once a week, twenty minutes, looking for repeat offenders — a session that keeps paying, a pair that keeps charging, a rule-break cluster after losses. Template's in §III. Start in a spreadsheet tonight; graduate to software only when the capture friction or the math outgrows it.
| What the dead journal recorded | What evidence records |
|---|---|
| "Felt confident, market looked strong" | The one-line reason, written before entry |
| P&L in dollars, mood in adjectives | R — the risk-normalized result |
| Twenty fields, filled on winners only | Ten columns, filled in 60 seconds, every trade |
| "Need to be more disciplined" | plan? = no — a countable flag with a dollar cost |
| Reviewed "when I get time" | Twenty minutes, every Sunday, same questions |
I — Why trading journals die
Three failure modes, and they compound.
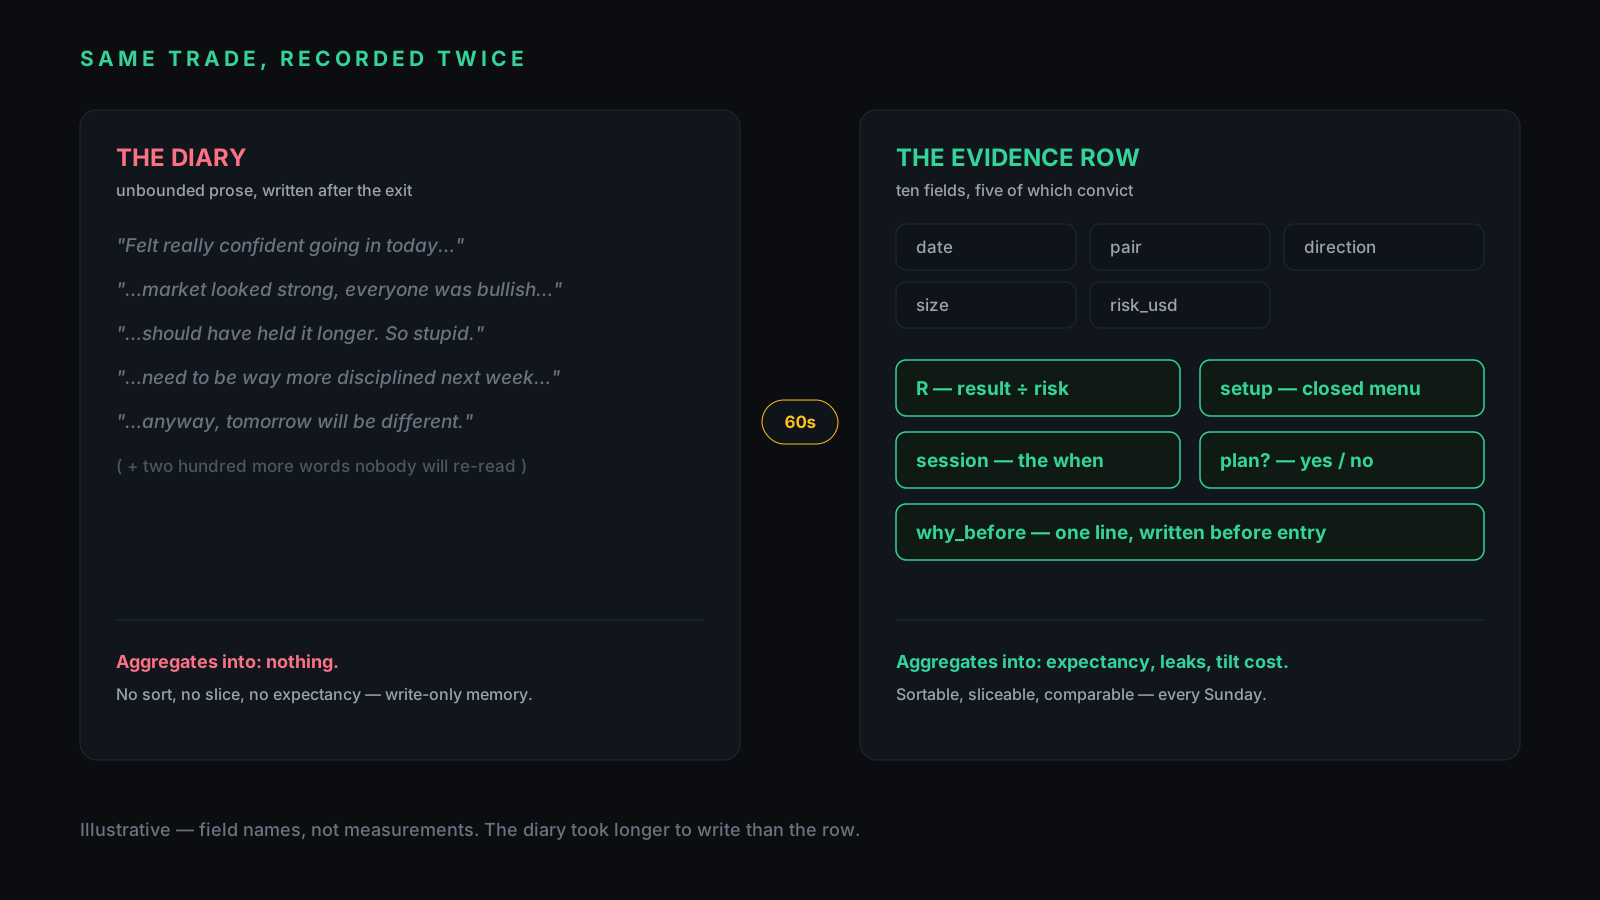
Diary-mode. Unstructured prose captures how the trade felt, which is precisely the information your future self can't compute anything with. Two hundred words of narrative per trade is write-only memory: nobody re-reads it, nothing aggregates, and the effort of producing it is why row fifteen never happened.
Field bloat. Ask how to journal forex trades and most answers hand you a template with twenty-three columns, built by someone who never had to fill it at 2 a.m. after a stop-out. Every field past the convicting ten adds friction, and friction is selective: it filters out exactly the ugly trades your dataset most needs. We wrote a whole piece on where logging friction actually gets solved — but the first fix is fewer fields, not better software.
Shame. The quiet rule of every dead journal: winners get filed, losers get "I'll log it later." A journal with survivorship bias isn't neutral — it's a highlight reel wearing a lab coat. The fix isn't willpower; it's cost: sixty seconds to file, zero self-criticism required. Losers are data. File them like data.
II — What a journal is actually for
A journal has exactly one job: feed the expectancy math with enough labeled rows that patterns stop being anecdotes.
That sentence decides every design question. Win rate alone is a vanity metric — a 45% system can print money and a 70% system can bleed out, because outcomes only mean something relative to what you risked. So the journal's atomic unit is not dollars; it's R, the result divided by the planned risk. A +$300 win that risked $100 is +3R. A +$300 win that risked $600 is +0.5R and a completely different fact. Dollars tell stories; R testifies.
Everything else in the schema exists to let you slice R by something: by setup, by session, by symbol, by discipline. If a column can't appear in a sentence like "my R per trade in the New York session is…", it's decoration.
If your journal can't compute your expectancy, it isn't a journal yet — it's a scrapbook with numbers in it.III — The five columns that convict
The full row is ten columns. Five are bookkeeping your platform already knows (date, pair, direction, size, risk in currency). Five do the convicting:
R. Covered above — the risk-normalized result, computed from the P&L your platform already reports: result divided by risk_usd. This is the column that makes a spreadsheet into a dataset.
Setup. One tag from a closed menu you write down in advance — 3 to 7 names, no more ("OB-retest", "FVG-fill", "news-fade"…). Freetext kills this column: if every trade gets its own creative description, nothing groups, and grouping is the entire point. Can't name the setup from your menu? That's a finding — you took a trade your system doesn't contain.
Session. Which session (or hour) the entry happened. Time is the most common hiding place for leaks — a strategy that's profitable overall and reliably bleeding in one specific window.
Plan? — plan_followed in the template. A single binary: did this trade follow your written rules — entry, size, stop — yes or no. No "mostly." This flag gets its own section (§V), because it quietly runs your whole P&L.
Why-before. One line, written before the entry fires. Not a paragraph. §IV explains why the timestamp matters more than the content.
That's the whole forex trading journal template — one header row. Paste it into a fresh sheet and you're operational:
date, pair, direction, size, risk_usd, R, setup, session, plan_followed, why_before
IV — Write the reason before, not after
The cheapest integrity upgrade in trading costs one sentence of typing before the entry.
Written after the trade, your reasoning passes through the outcome on its way to the page. Winners retro-acquire clean logic ("textbook retest"); losers retro-acquire excuses ("news spike, not my fault"). Nobody is lying, exactly — hindsight is a laundering service, and it works on honest people. The post-hoc journal always reads well and teaches nothing; every row in it agrees with itself.
Written before, the sentence is a prediction with a timestamp. "Long, OB-retest, London open, invalid under 1.0830" either describes what happened next or it doesn't — and when it doesn't, you've captured the most valuable object in trading: a documented gap between what you believed and what the market did. Thirty of those gaps, tagged and sliced, are a curriculum. Thirty post-hoc paragraphs are a novel.
One line. Before. Every time — especially the trades you're most sure about, because those produce the most instructive gaps. (And if you scalp at a pace where typing mid-session is fantasy, write the line once — before the session — and let plan_followed score every trade against it.)
V — The rule-break flag: your two P&Ls
Here's what the binary plan? column buys you, and why it embarrasses every twenty-three-column template that lacks it.
Filter your journal into two piles: trades where plan? = yes, and trades where plan? = no. You now have two P&Ls. The first is your system's track record — the thing you're actually testing, the thing a backtest can be compared against. The second is your tilt's track record: the oversized revenge entry, the stop dragged "just this once," the setup that wasn't on the menu.
Most traders have never seen these separated, so they debug the wrong component. If pile one is profitable and pile two is torching the account, your system is fine — the leak is behavioral: count the rule-breaks, notice they cluster after losing streaks, put a cooldown rule in writing. If pile one is bleeding too, no discipline fix will save it — the method needs work, or the market changed. One binary column, and "I need to be more disciplined" becomes a diagnosis with a location.
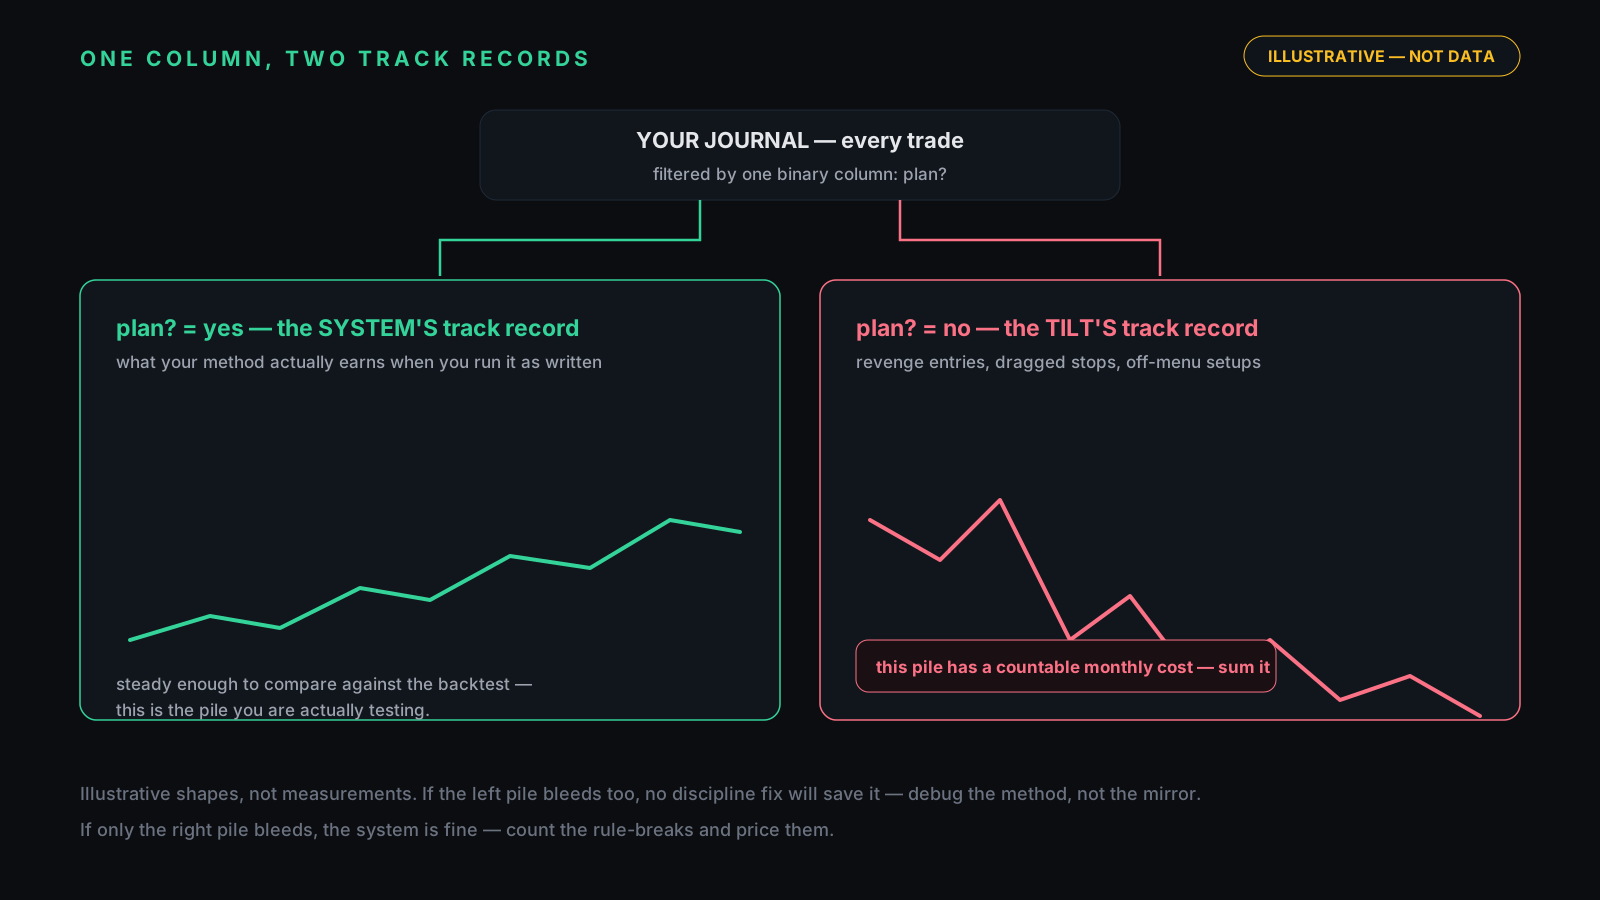
This is also the honest version of a number you'll want eventually: what rule-breaking costs you per month. Sum pile two — in R, or in dollars (R × risk_usd). Write it on a sticky note. It's usually the most motivating number a trader owns.
VI — The Sunday autopsy
Twenty minutes, once a week, same three questions. Consistency matters more than depth — the autopsy that happens beats the deep-dive that doesn't.
Minute 0–7: repeat offenders. Sort by setup, then by session. You're looking for the same name appearing on the same side of the ledger three-plus times: a setup that keeps paying, a session that keeps charging. Circle; don't act yet. (This by-hand hunt is exactly what we later taught an AI to run daily — catch one leak manually first and you'll know whether to believe the machine.)
Minute 7–14: the two piles. §V's filter. Count the rule-breaks. Note what preceded them — the answer is almost always "the losing trade right before."
Minute 14–20: one change, in writing. Not five changes. One sentence, dated, testable: "No entries in the first 15 minutes after red news," "Size down 50% after two consecutive losses." Next Sunday, the first question is whether last week's sentence held.
And the humility clause, because this is where journals turn into overconfidence machines: small samples lie. Thirty trades is a mood, not a verdict — losing streaks that feel diagnostic are routine variance at ordinary win rates, and we've published the simulation grids showing how routinely a genuinely profitable system visits ugly territory. Treat any pattern under ~30 occurrences (not 30 trades — 30 instances of that pattern) as a hypothesis to keep watching, not a rule to trade. The risk-of-ruin calculator will show you, on your own numbers, how much noise a real edge produces; let it calibrate how quickly you're allowed to conclude things.
VII — Paper, sheet, or app
The honest tooling ladder, cheapest first:
Paper works if you take one or two trades a day and review by hand. Its weakness isn't romance — it's that nothing aggregates; you can't sort paper by setup.
A spreadsheet is where everyone should start, and where plenty of profitable traders stay. The ten-column template above, one pivot table for R-by-setup and R-by-session, and you have 80% of the value at zero cost. If you never outgrow it, you never spend a baht.
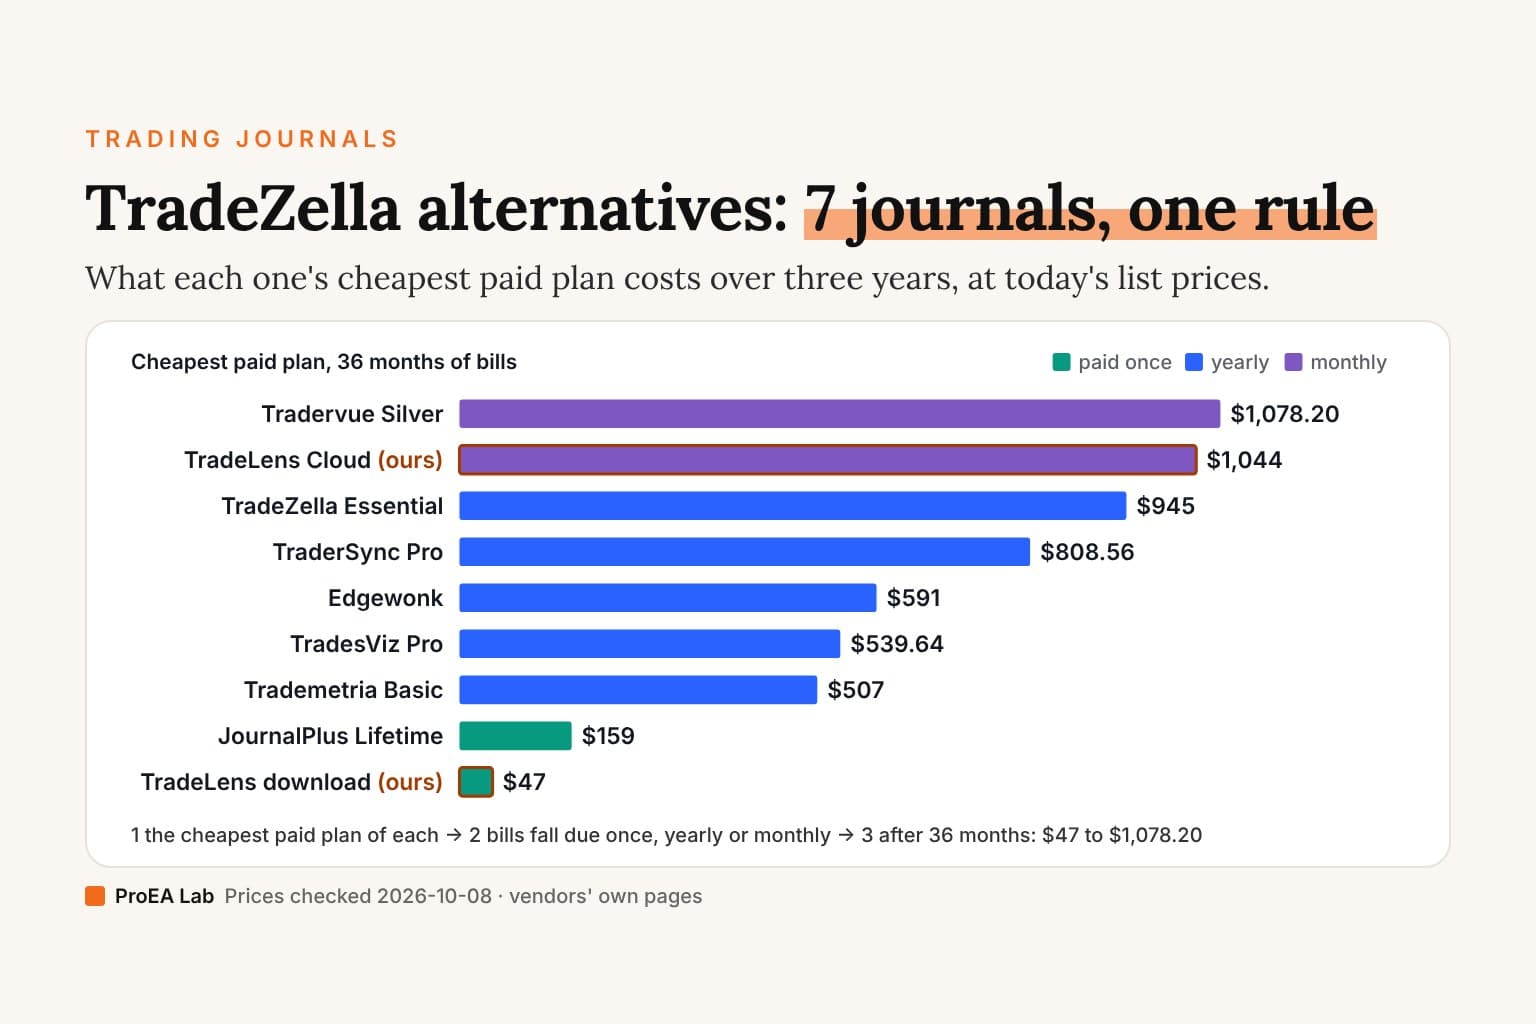
Software earns its place when one of two things breaks: capture (you take many trades and logging decays — the friction problem has its own article) or analysis (you want the slicing, streak math, and cross-account views done for you, every day, without building them). Whether to rent that software or own it outright is a separate decision we've argued in full — short version: subscriptions buy roadmaps, one-time purchases buy permanence, and the journal data itself should be exportable either way or you're renting your own history. Comparing apps? Our side-by-sides of TradeZella, Tradervue, TraderSync and Edgewonk quote each vendor's own prices and say where each one beats ours.
Notice the order. The app is the last rung, not the first — a journal habit that only exists inside a paid tool wasn't a habit, it was a subscription.
The 20-minute setup
Minutes 0–5: open a fresh sheet, paste the ten-column header from §III. Minutes 5–10: write your setup menu — 3 to 7 names, the only ones allowed in the setup column. Minutes 10–15: write the rules that define plan? = yes (entry condition, max size, stop placement — three sentences is enough). Minutes 15–20: backfill the last five trades from memory, honestly, including the one you'd rather skip. You're now journaling. The first Sunday autopsy is scheduled for — write it down — this Sunday.
The product ledger
Bias, priced: we sell TradeLens, a trade journal + AI coach, and this article is the manual version of what it automates. Against its live page, verbatim-checkable: it imports MT4/MT5/CSV, computes edge analysis (your best session, symbol, and setup), runs leak detection on losing time windows with the dollar amounts attached, and measures tilt cost — what rule-broken trades cost you per month — which is §V as a feature. The AI coach runs locally in the launch-priced $47 one-time Download edition (no monthly AI fees) or hosted in the $29/month Cloud edition, and the design rule underneath is the same one this article teaches: it never invents numbers — it only computes from the trades you imported. What it can't do, stated plainly: it can't make you log honestly, it can't rescue a system with no edge, and it isn't signals, a bot, or financial advice. The spreadsheet version of this method costs nothing and works. Start there; we'd rather you arrive as a journaler than a hopeful.
Disclosure
Product claims above are limited to what's published on the TradeLens page, checked July 2026; the journaling method itself owes nothing to the product — it's older than software. No statistics in this article are measurements: both figures are labeled illustrative, and the only quantitative claims link to our published, reproducible simulation work. If anything here drifts from what the product page says, email support@pulltrade.app and we'll correct whichever one is wrong.
Your first 20 minutes
You already read the setup — it's twenty minutes and a spreadsheet you already own. The only real decision is smaller: the next trade you take, write one line before you enter and one binary after you exit. That's the whole habit. Everything else in this article is just that habit, aggregated.
The dead journal recorded how trading felt.
The living one records what it proved.
Fourteen rows of feelings taught you nothing. Ten columns of evidence, kept for a quarter, will tell you exactly who you are as a trader — which is the one thing no one can sell you.