Every XAUUSD EA backtest from the last two years looks brilliant for the same reason: gold spent those years mostly going up. This is what regime dependence does to a backtest, why it fooled almost everyone at once — and the two checks that catch it.
December 2025.
Your gold EA just closed another week green.
Fourteen months. One curve. Up and to the right.
You remember the wobble in March that almost made you turn it off. You didn't. Discipline, you told yourself.
You sized up in November. Again in December. The screenshot was already cropped for the group chat.
You weren't gambling anymore. You were a systems person now.
The backtest agreed. The forward test agreed. The leaderboard agreed.
Then January happened.
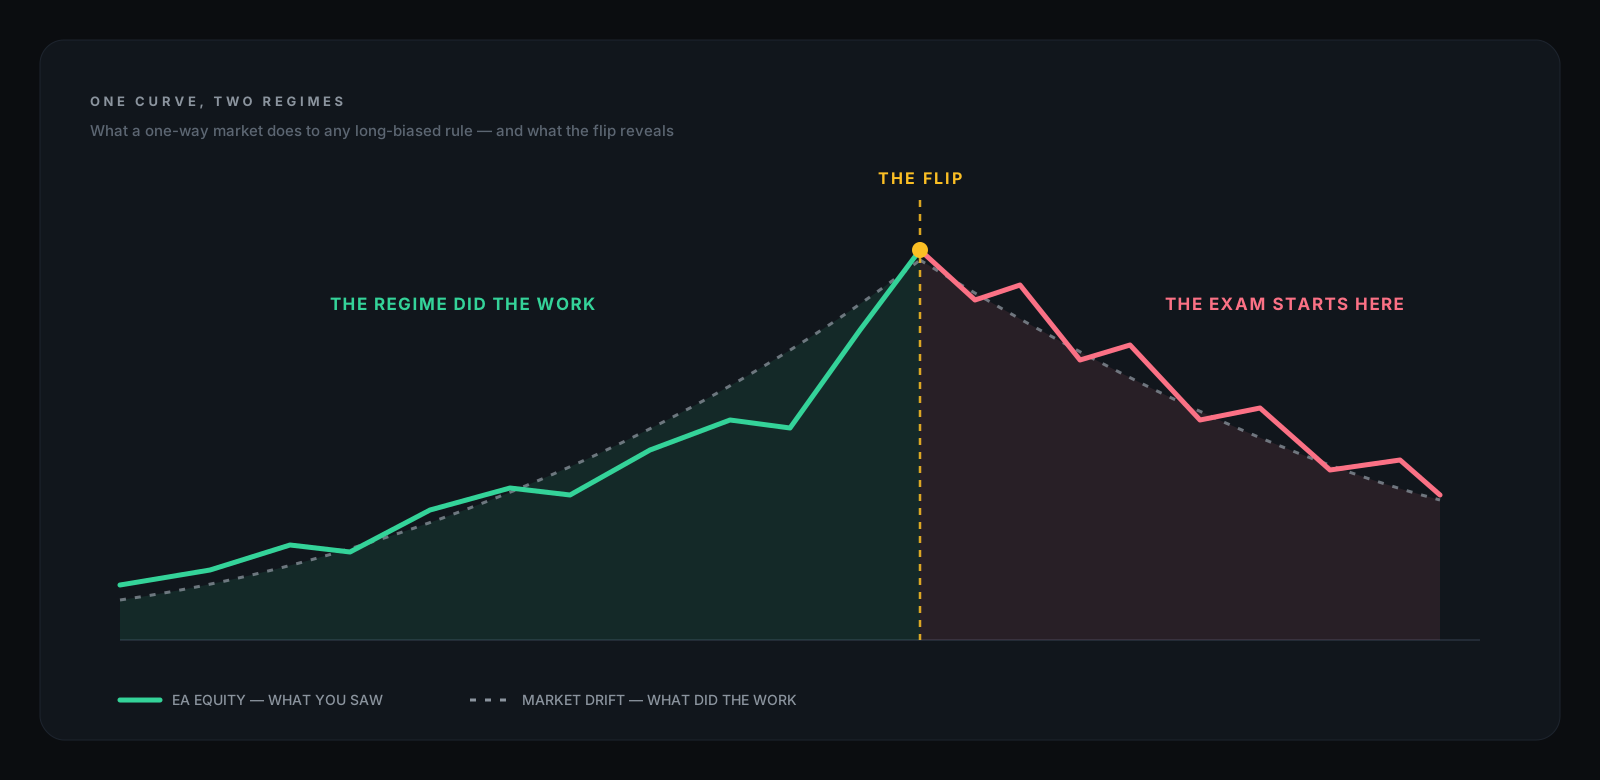
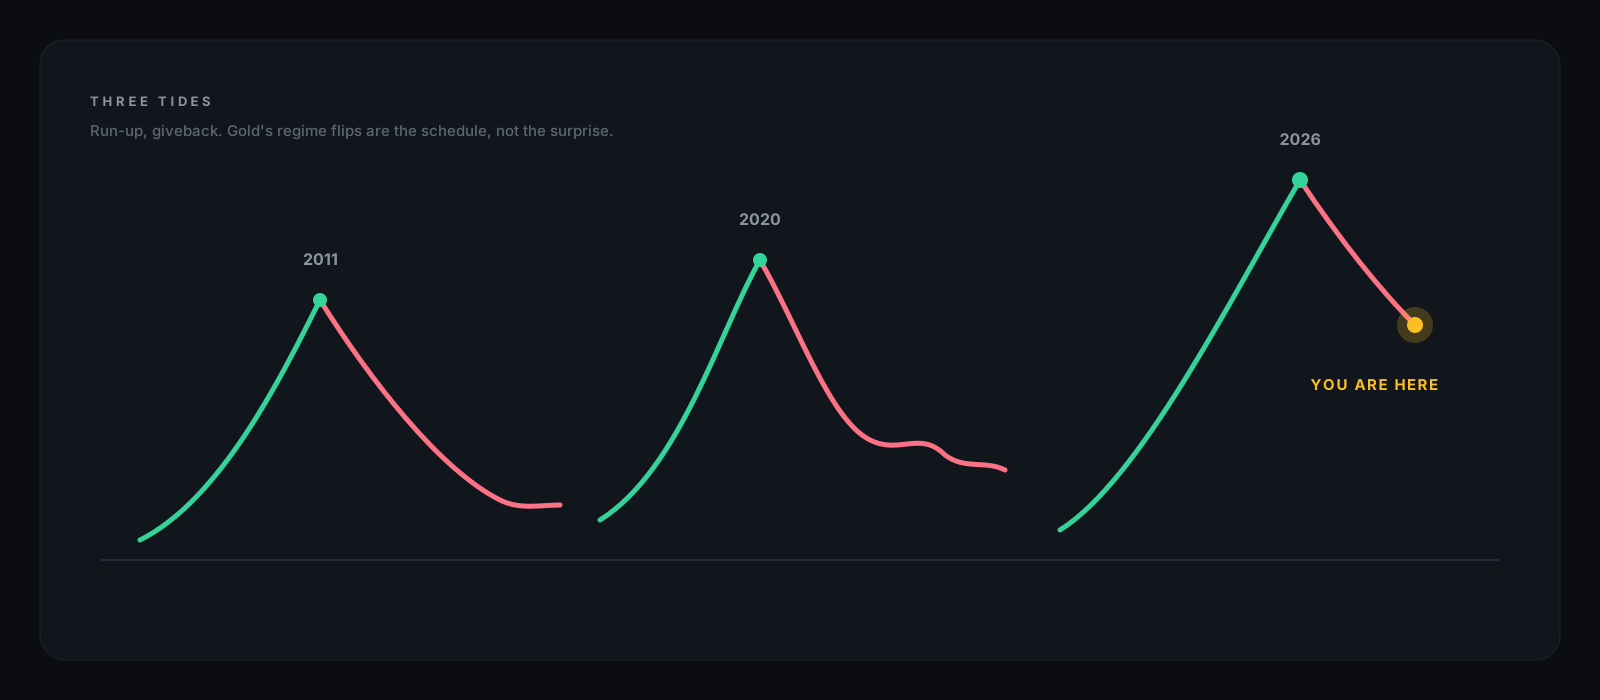
Gold printed an all-time high around $5,590 in late January — and turned around.
By June 10, spot gold was trading near $4,150.
Your EA didn't change. Not one line.
The market did.
Here is the sentence every gold-bot owner has been trying not to say since February:
The EA was never the genius. The tide was.Save this for the next time a gold backtest looks like destiny. Send it to the friend whose gold bot has been "consolidating" for four months — the one who says it just needs the market to normalize.
The market did normalize.
That's the problem.
gold's reported January 2026 all-time high. Venues and contracts differ slightly — which is exactly why we say 'around.'
Reuters / Metals Focus ↗the only audit that matters now: what did the system do after the January high?
The tide audit, belowThe 60-second version
A one-way market makes everyone look smart. From late 2024 into January 2026, gold was one of the cleanest one-way retail trades on earth — so the market minted thousands of profitable-looking gold EAs. Buy the dip. Breakout long. Grid recovery. AI gold bot. Trend filter. Trailing stop. Most of them worked for the same reason:
They were long, and gold went up.
That is not automatically alpha. That is beta. Beta means you made money because the market moved in your direction. Alpha means your decisions added something beyond that exposure. The January high split those two apart — because the melt-up only ever asked one question, can this EA ride a rising gold market?, and the giveback is asking a different one:
Can this EA survive when the rising market stops paying for bad logic?
That second question is the only one that matters now. Before you risk another position on any gold system — bought, rented, copied, or vibe-coded — run the tide audit below. Separate what the logic earned from what the market donated.
| What it felt like | What it may have been |
|---|---|
| "My EA reads gold perfectly." | Your EA was long and gold went up. |
| Fourteen months of proof. | Fourteen months of one regime. |
| A win rate worth bragging about. | A market that bailed out weak entries. |
| The leaderboard's best system. | The leaderboard's most exposed system. |
| A drawdown that always recovered. | A trend that always resumed — until it didn't. |
| "It's just a temporary dip." | A forecast being used as a risk model. |
I. The genius factory
A bull market is a genius factory with no entrance exam.Gold's run into January did something magical to every long-biased rule in existence. Buy the dip? Printed — every dip found buyers. Breakout long? Printed — breakouts kept following through. A grid that adds into drawdown? Printed beautifully — every add got rescued, which is the most dangerous kind of rescue there is. Hold-and-pray with a trailing stop? Printed. An AI bot trained on recent gold history? Printed — because recent gold history mostly said one thing: up.
That is how the factory works. It does not select for intelligence. It selects for exposure. The more long, the more aggressive, the more willing to add into weakness, the more brilliant the curve looked — right until the flip.
In a one-way market, the direction decision — the decision that separates a strategy from a coin toss — was made for you. Every day. For months.
So nobody who bought a long-biased gold EA in that window learned much about its logic, because the market refused to let weak logic look weak. The factory doesn't create geniuses. It hides the difference between skill and tide.
II. Beta in alpha's clothes
Quants use two boring words for a very expensive distinction. Beta is what you earn for being exposed to a market that moved. Alpha is what your decisions added beyond that exposure.
Your gold EA's melt-up statement is a blend of both, and the blend is the whole question — because beta is free. You can get gold beta with one buy ticket. No EA, no subscription, no vendor, no magic. What you actually paid for was alpha:
entry quality
exit quality
risk control
volatility adaptation
stand-aside logic
short-side competence
drawdown protocol
So the uncomfortable test is simple. Race your EA against a dumb constant-long position over the glory window. Same symbol, comparable exposure, realistic costs, no clever logic — just long.
If the dumb long looks like your EA, you didn't buy an edge. You bought beta with extra steps, and the extra steps charged spread. A one-way market turns beta into a costume called alpha.
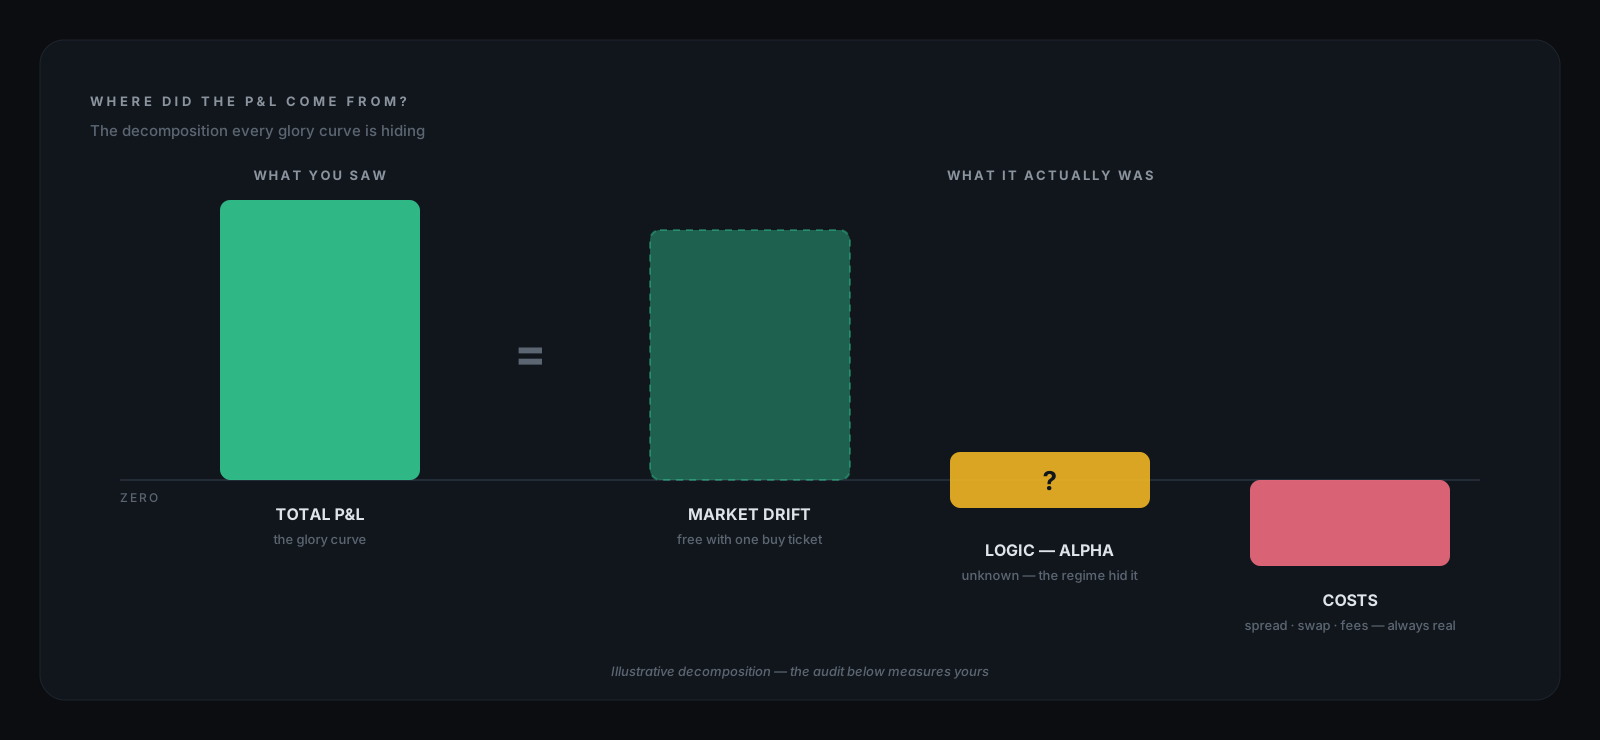
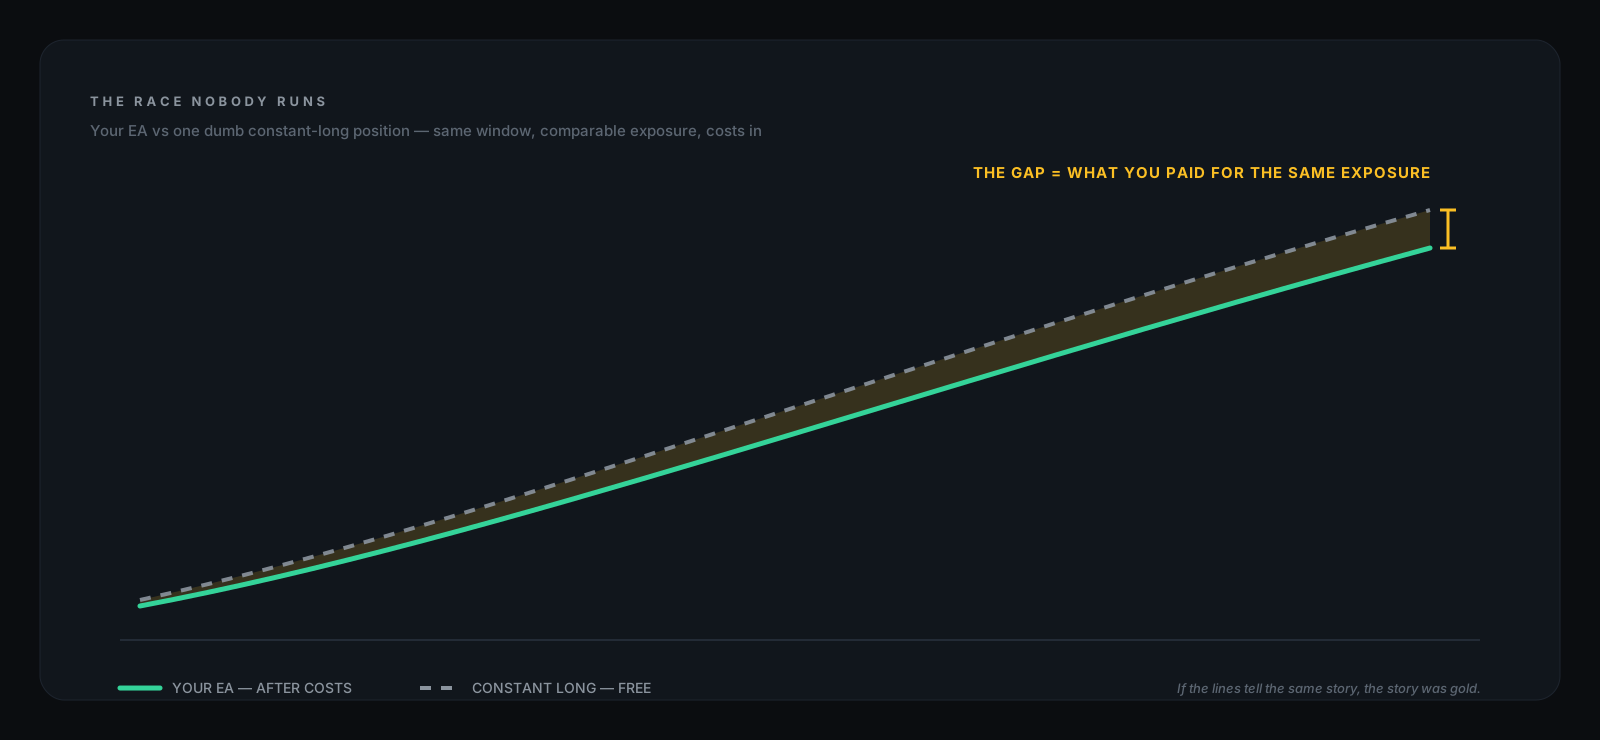
We are not saying your EA has no alpha. We are saying the melt-up made that impossible to know from the curve alone. A one-regime backtest doesn't prove decision quality; it proves the market paid the dominant direction.
The tide lifts every boat. The invoice for the boat was real either way.
III. The census your EA is failing
You don't need a quant degree for the first test. You need two columns.
Open the trade history of any gold EA that "crushed it" into January. Count longs. Count shorts. Then split the P&L the same way:
long count
short count
long P&L
short P&L
If 85–95% of the trades were long and almost all of the profit came from the long column, you are not looking at a balanced gold engine. You are looking at directional beta. And if the short trades exist but are flat or negative, that tells you even more: the EA didn't read both sides of gold. It learned one side of one regime.
The long bias usually hides inside neutral-looking logic. A trend filter in a fourteen-month uptrend is not a sophisticated filter — it's a permanent permission slip. A dip-buying module that never shorts is not a market reader — it's a long-only machine with better language. And a short path in the code doesn't count if it never fired when it needed to.
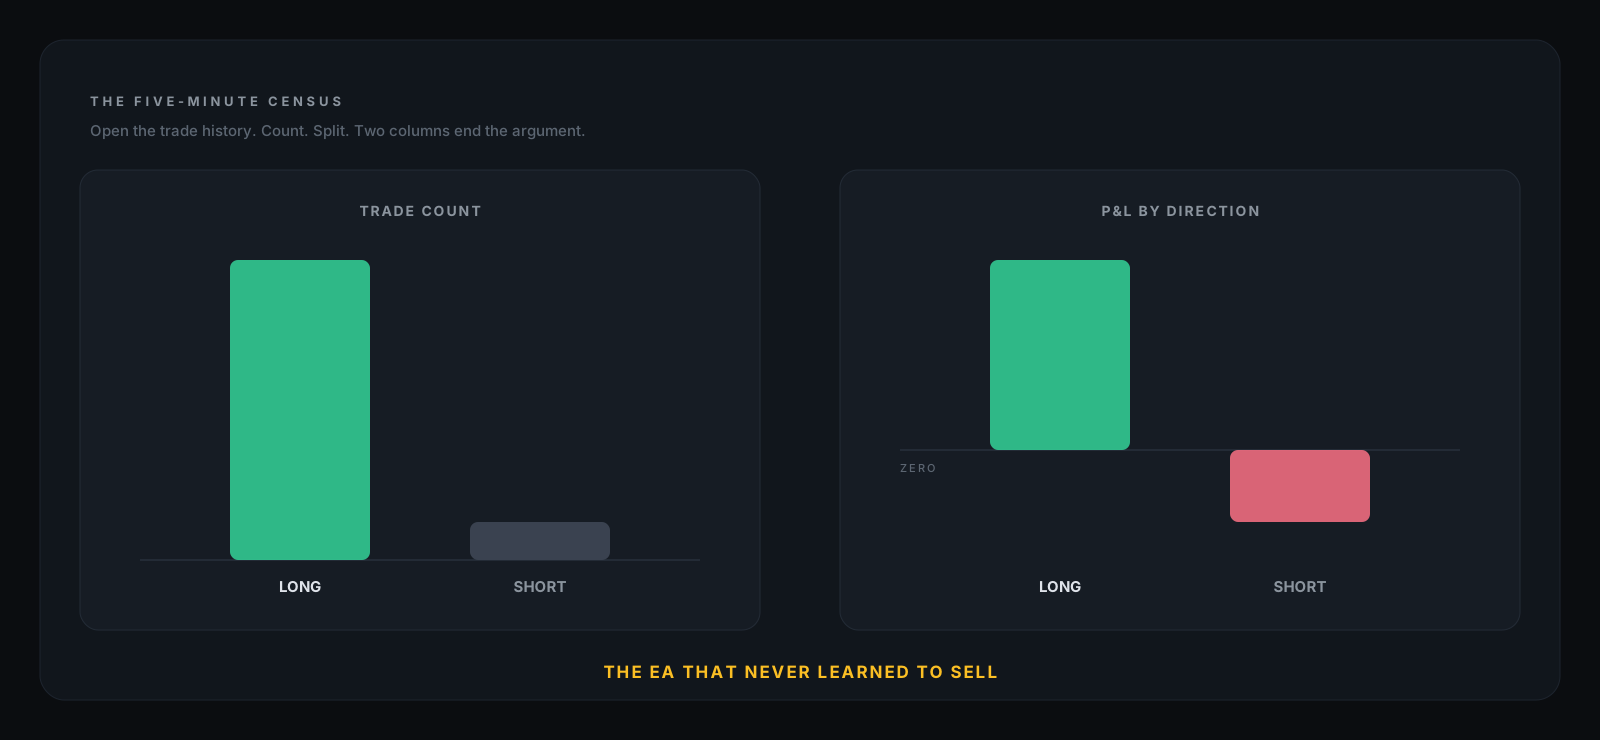
The census takes five minutes, and most owners never run it, because the answer threatens the most expensive belief in trading:
my system is smart
A system that can only say buy is not making a decision. It is making a bet. Yours — with better branding.
IV. Your backtest asked one question
Every backtest is an answer. The window decides the question.Test any long-leaning gold system on 2024-to-January-2026 data, and the question your backtest actually asked was: did gold go up? The answer was yes. The equity curve you fell in love with was that yes, replotted in your account currency.
This failure mode is meaner than ordinary overfitting, because the backtest can be completely clean — no look-ahead, realistic spread, no future leak, no repainting — and still be weak evidence. One regime in the window means the direction decision was never seriously tested. The drawdown logic was never seriously tested; the market kept rescuing positions before pain became structural. The sizing model was never seriously tested; volatility stayed inside the band the parameters were built for. (We wrote the general autopsy in Backtest Isn't Reality — this is the regime-shaped hole in even an honest one.)
Then the regime left. February through June arrived as free out-of-sample data — not theoretical, not simulated. Live, ugly, and useful. It asks the question the sales page skipped:
What does the logic do when the tide is not paying?
That is the cheapest honesty available in gold trading right now. Almost nobody runs it on a system they already own.
Because the test might answer.
V. The leaderboard ranked exposure, not skill
Now zoom out to the marketplace. Think about any gold-EA leaderboard at the end of 2025 — marketplace bestsellers, signal rankings, Myfxbook walls of green. The systems at the top shared one trait, and it wasn't intelligence. It was maximum participation in the melt-up: highest net-long exposure, most aggressive adds, tightest coupling to the one trade that was working.
That doesn't mean the leaderboards were fake. It means a leaderboard inside a one-way regime ranks exposure, not skill. The "best" gold EA of the melt-up may simply have been the one taking the most regime risk — which means the top of the December table was, in expectation, the most fragile name on the June table.
This is survivorship's uglier cousin. It's not just that losers disappear — the ranking mechanism itself promotes the systems most exposed to the tide.
That is why a sales page ending near the January high is not evidence. It's a crop. If a vendor shows you a green curve into January and nothing after it, you are not looking at a track record. You are looking at a cliff with the second half removed.
VI. January changed the reaction function
The details matter, because they explain why so many gold systems failed at once. Gold didn't just fall. The market changed what it rewarded.
In the old regime, geopolitical risk, inflation fear, rate-cut hopes, and debasement narratives all reinforced the same trade:
long gold
Then the macro chain flipped. By June, Reuters was describing gold as under pressure since the start of the Iran war, as surging oil prices fueled inflation and higher-rate fears — and higher rates weigh on non-yielding gold. Read that twice, because it is the important sentence: war did not automatically mean gold up. The second-order effect won — oil shock, then inflation fear, then rate expectations, then a stronger dollar, then pressure on gold.
That is a reaction-function change. The same kind of headline that was bullish in one regime became bearish in the next. No retail EA understands "reaction function." It understands candles.
And the candles became hostile. Ranges expanded and spreads widened at exactly the moments systems were forced to act — traders on MQL5's own blogs documented gold moving more in 48 hours than it normally moves in a month, with spreads at multiples of what any backtest assumed. (Community observation, not exchange data — but it's the community your EA trades in.) Stops tuned to the old volatility became too tight or too expensive. Grid steps calibrated to the melt-up became ladders into a decline. Fixed lots quietly became bigger risk than intended, because volatility changed underneath them.
A system can survive a price-direction change. It may not survive a behavior change.
Gold did not die. The one-way regime died. Those are different events, and only one of them is fatal to a long-only machine. Honesty cuts both ways here: gold was still up roughly a third year-over-year heading into June. This is not a gold-is-dead post. It's a one-way-regime-is-dead post.
VII. "It comes back" is not a risk model
Right now, the most dangerous sentence in gold trading is: the banks still think gold goes higher.
They might! Plenty of forecasters are still bullish: Metals Focus expects the bull run could resume in the second half of 2026 under the right conditions, J.P. Morgan's public outlook remains constructive, and others have floated even higher year-end targets.
Here is what none of those forecasts contain:
your margin
A forecast is a destination. Your account is a clock. Gold can return to $5,000 and still liquidate a leveraged grid long before the target date. The bank can be right about the destination, and you can still not survive the road.
This is the specific mechanism by which "it comes back" destroys accounts: a forecast with no path gets used as a substitute for a stop. The EA averages down because averaging down worked all through the melt-up — every prior dip was temporary, and every rescue taught the wrong lesson. Then one dip stops being a dip. It becomes a regime.
If your gold system's real risk plan is a bank price target, you don't have a system. You have a hope with an API.
VIII. What skill in gold actually looks like
After seven sections of demolition, you're owed the standard. A gold system that earns its fee should show all of this in inspectable fact — not in marketing, not in screenshots. In logic you can read.
1. A direction decision
Somewhere in the code there is a line that decides long, short, or flat. Skill means that line exists, has conditions, and can be inspected. If nobody can show it to you, the melt-up may have been the strategy.
2. A short path with evidence
Not "the EA supports shorts." Trades. History. P&L. A system that never shorted through a multi-month gold decline wasn't balanced — it was biased, and the regime was covering for it.
3. Volatility-aware sizing
Gold's range regime changed. A fixed-lot, fixed-grid machine calibrated to the old range isn't conservative — it's mis-sized by exactly the amount the world changed. Skill scales risk down when range expands.
4. Cost assumptions that survive ugly gold
Gold is the most spread-sensitive instrument most retail traders touch, and the spread is worst precisely when the system most wants to act. A backtest priced at one calm spread is not enough — we wrote the full cost autopsy here.
5. A drawdown protocol written before the drawdown
What happens at −10%? At −20%? At the daily loss limit? Where is the kill switch? If the answer is:
it recovers
go back to Section VII.
6. Published losses
The bad months matter. The changelog matters. The post-January window matters most of all. The systems that deleted their evidence after the flip — vanished Myfxbooks, silent v2 releases — told you exactly what the evidence was worth.
That's the spec. Notice every line of it is inspectable. None of it requires trusting a screenshot.
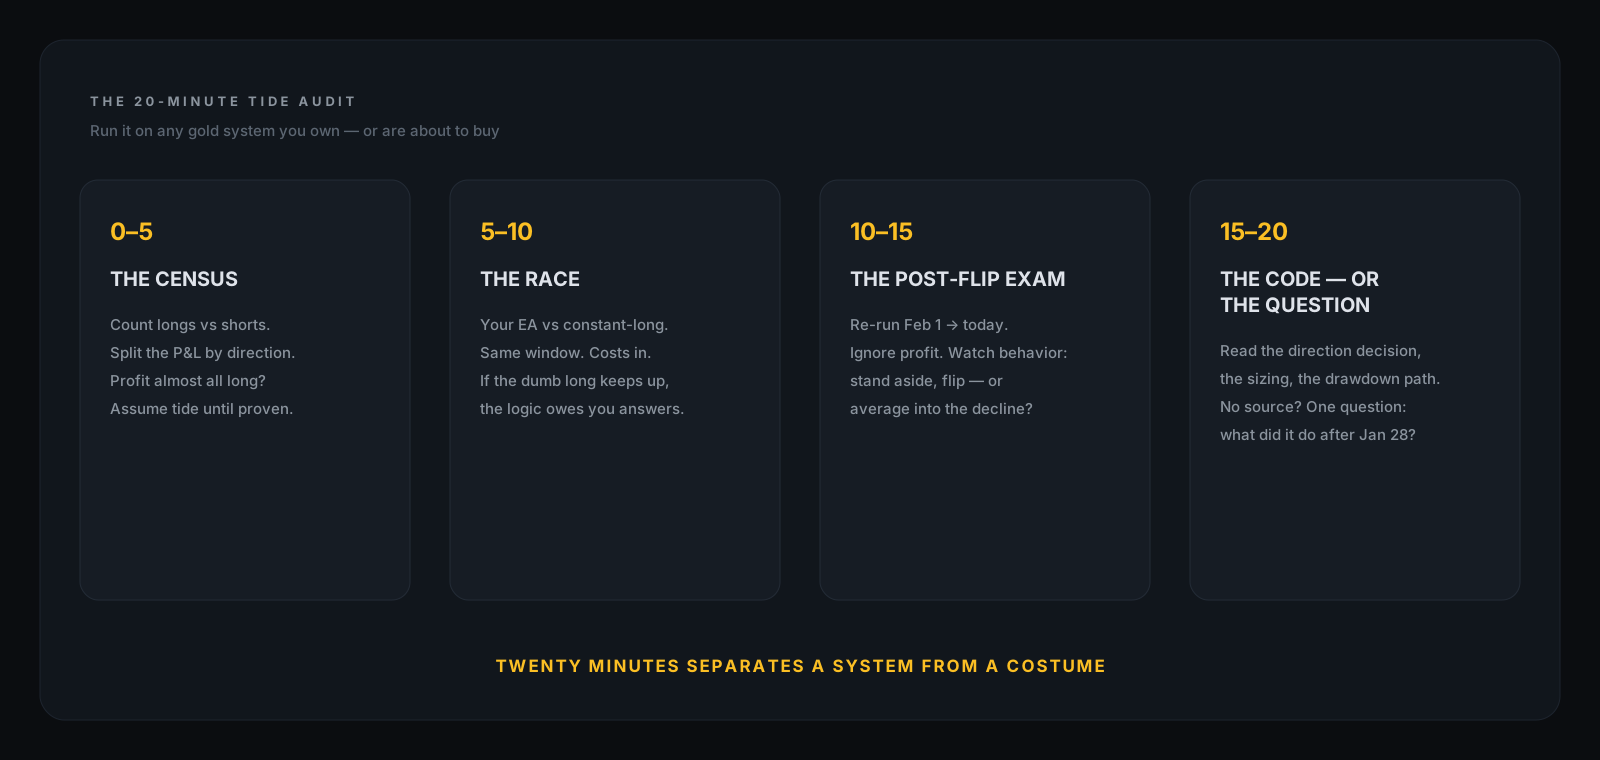
The 20-minute tide audit
Run this on any gold system you own or are about to buy. You need the trade history, a tester if you have one, and the willingness to learn something expensive before the market teaches it.
Minutes 0–5 — The census
Export the trade history and fill four lines:
long trades
short trades
long P&L
short P&L
Write down the long share of profit. If it's above ~90%, assume beta until proven otherwise — not because that number is magic, but because the burden of proof just shifted.
Minutes 5–10 — The race
Compare the EA's glory window to a constant-long position. Same symbol, comparable exposure, costs included. If buy-and-hold matches or beats the EA, the strategy may have delivered negative alpha after fees, spread, swap, and complexity. You paid for logic. Check whether the logic beat being long.
Minutes 10–15 — The post-flip exam
Re-run the test from February 1, 2026 to today. You are not looking for profit — four hostile months don't prove everything. You are looking for behavior:
Did it stand aside?
Did it flip short?
Did it keep buying dips?
Did size shrink as volatility expanded?
Did drawdown rules fire?
Did grid logic ladder into the decline?
That behavior tells you more than the old green curve ever did.
Minutes 15–20 — The code, or the question
If you have source: find the direction decision. Find the sizing function. Find every line that references equity, drawdown, or max loss — and read what happens on the worst Tuesday. If you don't have source, you get one question, and in June 2026 it's the only one that matters:
Show me what it does after January 28.
A seller whose evidence ends in January has answered it.
Where this meets MTR
Time to point the weapon at ourselves. MTR trades XAUUSD — which makes this essay an attack on our own product category, on purpose.
So, plainly:
we do not know where gold is going
Nobody selling you software does, and the ones who claim to just failed Section VII. Gold near $4,150 might be the dip the bulls are waiting for. It might be the next leg of a larger unwind. It might chop sideways for months. A system's job is not to know — it's to behave correctly while finding out.
What we sell is the ability to inspect the implementation. The public inventory describes MTR's modules; the source download is part of the purchase. You can then read the direction decisions, sizing and basket behavior in code. This article does not establish what MTR will do in a future falling market:
go read the decision yourself
The backtest evidence states its window and its assumptions. The changelog is public. The audit standard is the same one we just handed you — hold us to Minutes 15–20 like anyone else. MTR can lose. Any system can lose. But a system you can read gives you the right to ask the only question that matters after January: what did the logic actually do?
Evidence, not prophecy. That is the only thing for sale here.
Disclosure
Nothing on this page is a prediction, a signal, or a promise of returns. Gold prices and macro references are public-record snapshots as of June 10, 2026, linked to their sources — and different venues and contracts print slightly different highs and lows, which is exactly why this article says "around." MTR is software whose logic and assumptions you can inspect; what we publish is what it does, never what you will make. Backtests are simulations of the past, not promises about the future. And the point is not that gold is dead — gold can rally again. The point is that a one-way market can make weak logic look strong, and the giveback is where you learn whether you bought logic or luck.
Your first 20 minutes with a system you can read
If you do end up with source — MTR's or anyone's — run this tonight.
Find the direction decision and read what makes it long, short, or flat. You're checking whether the melt-up was the strategy.
Find the sizing function and trace what happens when volatility doubles. Does risk scale down — or does lot size stand still while the market gets wider?
Find every line that touches drawdown or equity, and read the worst Tuesday in advance.
Then run the tester from February 1, 2026 to today, and watch the behavior with your own eyes. Not the seller's crop.
Twenty minutes. That's the difference between owning a system and renting a costume.
The close
Buffett said you find out who's been swimming naked when the tide goes out.
In gold, the tide went out after January.
The EAs are still on the beach, insisting the water is coming back. Maybe it is — some forecasters think so. But "the water will return" has never once put a swimsuit on anybody.
The melt-up made everyone money. The giveback is the bill deciding whose money it really was.
You can wait for the market to run that audit on you. Or you can run it tonight, in twenty minutes, on your own terms.
The tide already turned. The only question left is what you actually bought — the logic, or the luck.