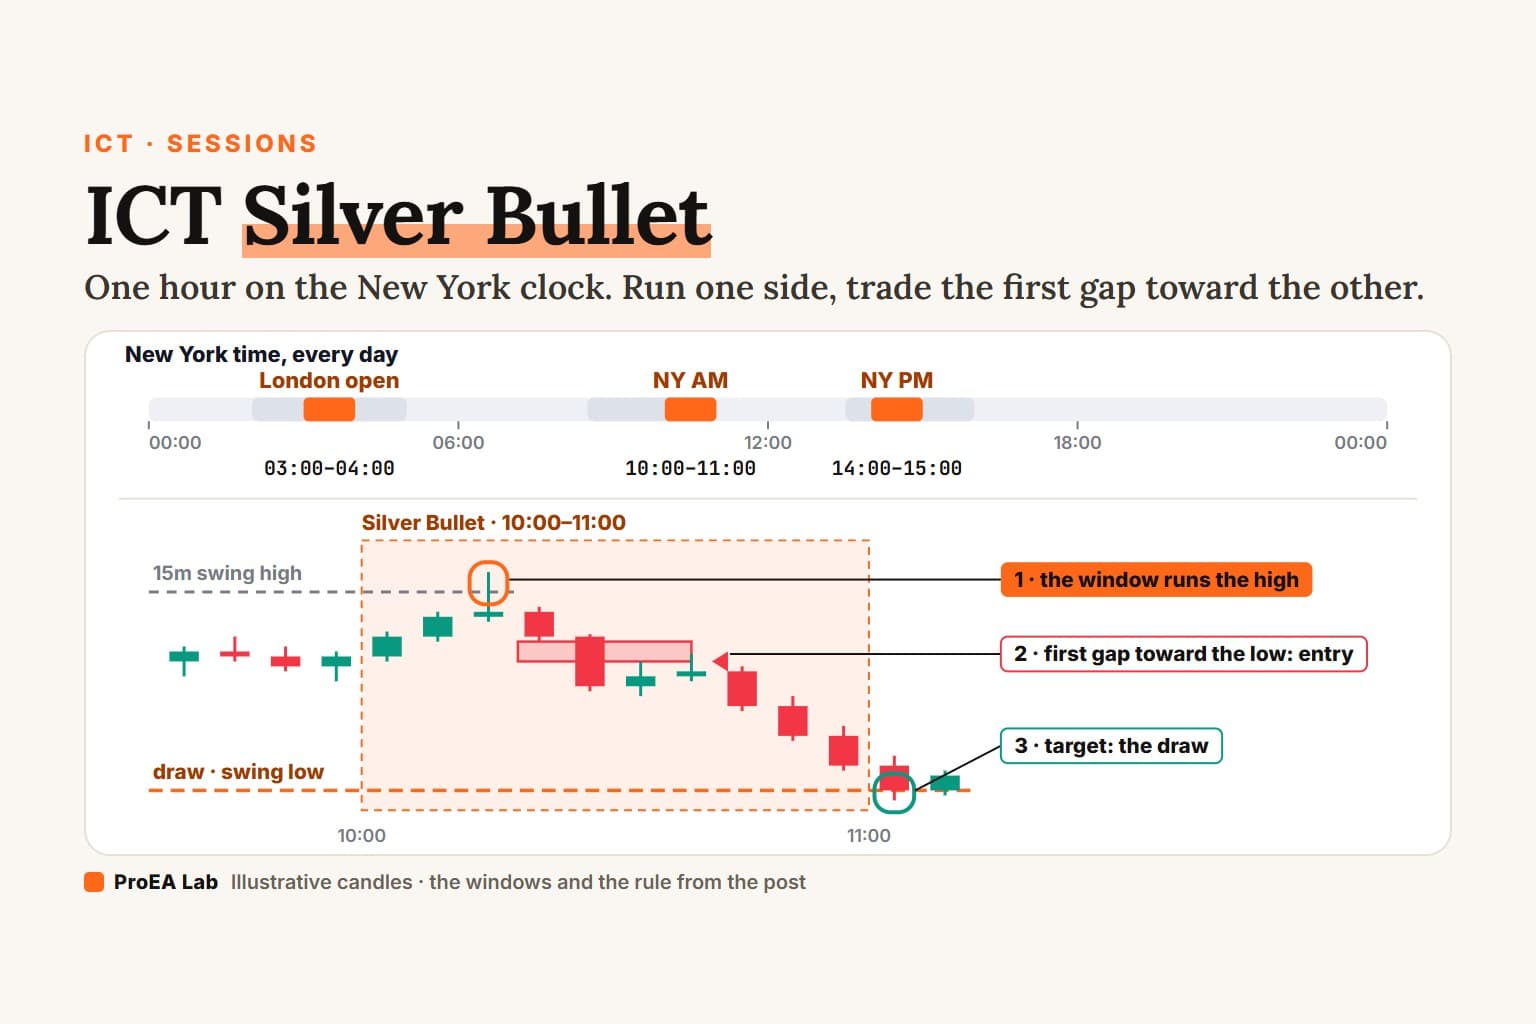
The ICT Silver Bullet is a one-hour window on the New York clock, 03:00–04:00, 10:00–11:00 or 14:00–15:00, in which you trade the first fair value gap that points at a draw on liquidity, entering when price comes back into it. Every guide we checked gives the same three hours. They split on the draw, the entry and the stop, so this page writes one rule down and replays it.
Every chart below is a replay of simulated candles. The clock is the one from ICT killzones: America/New_York, daylight saving time included.
What is the ICT Silver Bullet?
A time-based setup taught by ICT, the Inner Circle Trader. Three parts: a one-hour window, a draw on liquidity (the high or low price is expected to reach), and the first fair value gap inside the window that points at it.
Simulated candles, not market data. The simulated market is busier in London's and New York's office hours, read on each city's own clock: a choice of the simulation, not a measurement. The strip's coloured band shows the killzones; the orange marks are the Silver Bullet hours. Its UTC and "You" rows are computed for today's date in your browser's time zone.
Read as text
- One simulated day on 15-minute candles, from 00:00 to 16:00 New York time. Each Silver Bullet window is one hour, shaded from its first candle to its last.
- London open: 03:00–04:00 New York time.
- New York AM: 10:00–11:00 New York time.
- New York PM: 14:00–15:00 New York time.
- The windows are fixed on the New York clock. In UTC they are 08:00–09:00, 15:00–16:00, 19:00–20:00 while New York is on standard time, each an hour earlier while it's on daylight saving time.
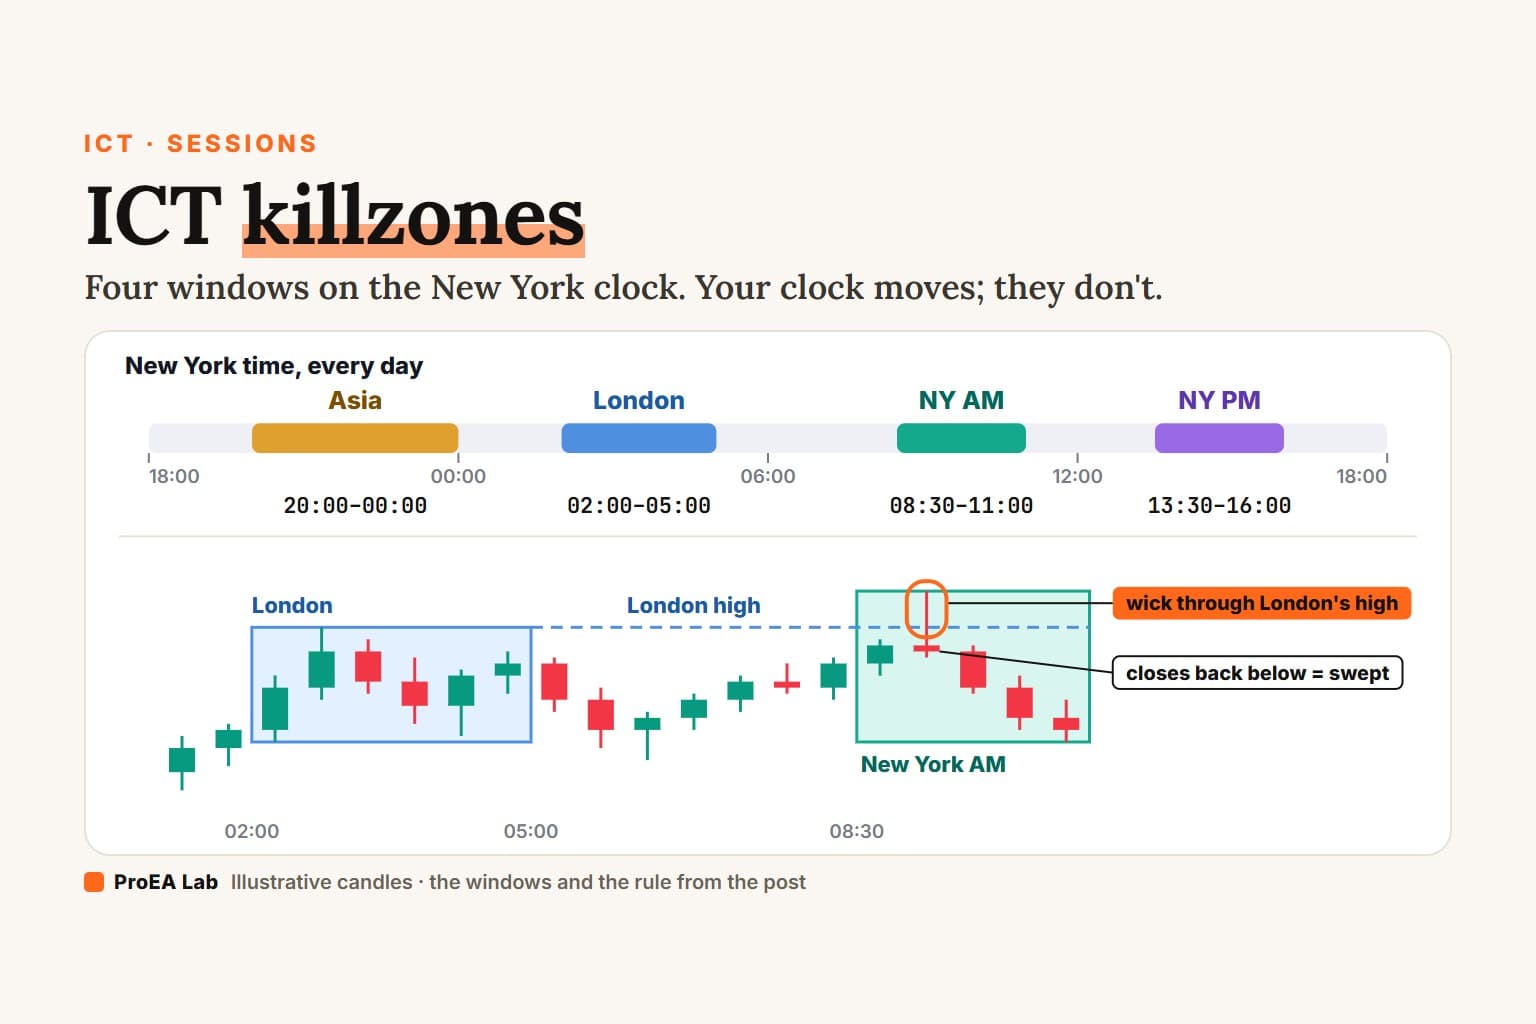
- Each one sits inside a killzone: 03:00 in London's 02:00 to 05:00, 10:00 in New York AM's 08:30 to 11:00, 14:00 in New York PM's 13:30 to 16:00.
How this window was chosen: The first full simulated Tuesday, 00:00 to 16:00 New York time, on 15-minute candles. No other condition: every day has the same three windows.
Use itPut your chart on New York time, or give your tool America/New_York, and shade the hour you trade.
Watch outA UTC table is right for only part of the year. TradingFinder's lists 07:00–08:00 UTC for the 03:00 window: right while New York is on daylight saving time, an hour early the rest of the year.
What time is the ICT Silver Bullet?
Three windows, every day, in New York time:
| Window | New York | UTC, Nov to Mar | UTC, Mar to Nov | Inside the killzone |
|---|---|---|---|---|
| London open | 03:00–04:00 | 08:00–09:00 | 07:00–08:00 | London, 02:00–05:00 |
| New York AM | 10:00–11:00 | 15:00–16:00 | 14:00–15:00 | New York AM, 08:30–11:00 |
| New York PM | 14:00–15:00 | 19:00–20:00 | 18:00–19:00 | New York PM, 13:30–16:00 |
New York is on standard time from the first Sunday of November to the second Sunday of March. The strip under the first film shows today's times on your own clock. The killzones are the set from ICT killzones.
Here the guides agree. All in New York time, checked 2026-10-04:
- innercircletrader.net (updated 3 May 2026): 03:00–04:00, 10:00–11:00 and 14:00–15:00, "New York local time".
- TradingFinder (modified 23 Sep 2025): the same three hours, with a UTC column (07:00–08:00, 14:00–15:00, 18:00–19:00) that only matches New York's daylight saving months.
- ictkillzone.com (updated Sep 2026): the same hours, written "EST"; it calls 10:00–11:00 "the highest-probability window."
- LuxAlgo's ICT Silver Bullet indicator (4 Jul 2023): "London Open (3–4 AM), the AM session (10–11 AM) and the PM session (2–3 PM)", in New York time.
We haven't measured which window is best, so we don't rank them. The films use 10:00, the one most guides lead with.
Where do the guides disagree?
On everything after the clock:
- The draw. innercircletrader.net marks liquidity on the 15-minute chart, then waits for "a Market Structure Shift in the direction of the next draw on liquidity." ictkillzone.com waits for a sweep first: "After a liquidity sweep at the NY open, the Silver Bullet waits for an MSS and the 1st Presented FVG during the 10 AM macro window."
- The entry. innercircletrader.net enters "on the FVG tap". TradingFinder, when price returns into the gap. ictkillzone.com: "Place a limit order at the 50% level (mean threshold) of the FVG."
- The stop. Beyond the candle that created the gap (innercircletrader.net, TradingFinder), or "beyond the wick that created the sweep" (ictkillzone.com).
- The target. "the next liquidity pool — typically a 1:3 risk-reward target" (innercircletrader.net). ictkillzone.com wants a "Minimum 1:2 R:R to first target before entering". LuxAlgo's indicator has a "Minimum Trade Framework" of "40 ticks on futures and indices, 15 pips on forex pairs."
The rule
Silver Bullet rule
1. Clock: New York time, America/New_York, daylight saving
   time included. A candle belongs to a window if it opens in it.
2. Windows: 03:00-04:00, 10:00-11:00, 14:00-15:00.
3. Liquidity: when the window opens, the nearest 15-minute swing
   high above price and swing low below it that no candle has
   traded through. A swing has 3 candles on each side.
4. Draw: the first candle in the window that trades through one
   of them has run that side. The other one is the draw.
5. Setup: the first fair value gap pointing at the draw, at least
   0.3 x ATR(14), whose three candles open inside the window,
   the first of them no earlier than the run's candle.
6. Entry: a limit at the gap's near edge, filled before the
   window ends. Stop: beyond the gap's three candles.
   Target: the draw, at least 2R away, else skip the setup.
7. Cancel: no fill by the window's end, or the draw trades
   before the fill. One setup per window.
Each step comes from a guide above; the combination is ours. The swing is the one from BOS vs CHoCH, the gap the one from fair value gap. A run that closes back inside is what liquidity sweep calls a sweep; this rule doesn't wait for the close. The films use 3-minute candles, one of the two timeframes innercircletrader.net enters on.
How does a Silver Bullet setup play out?
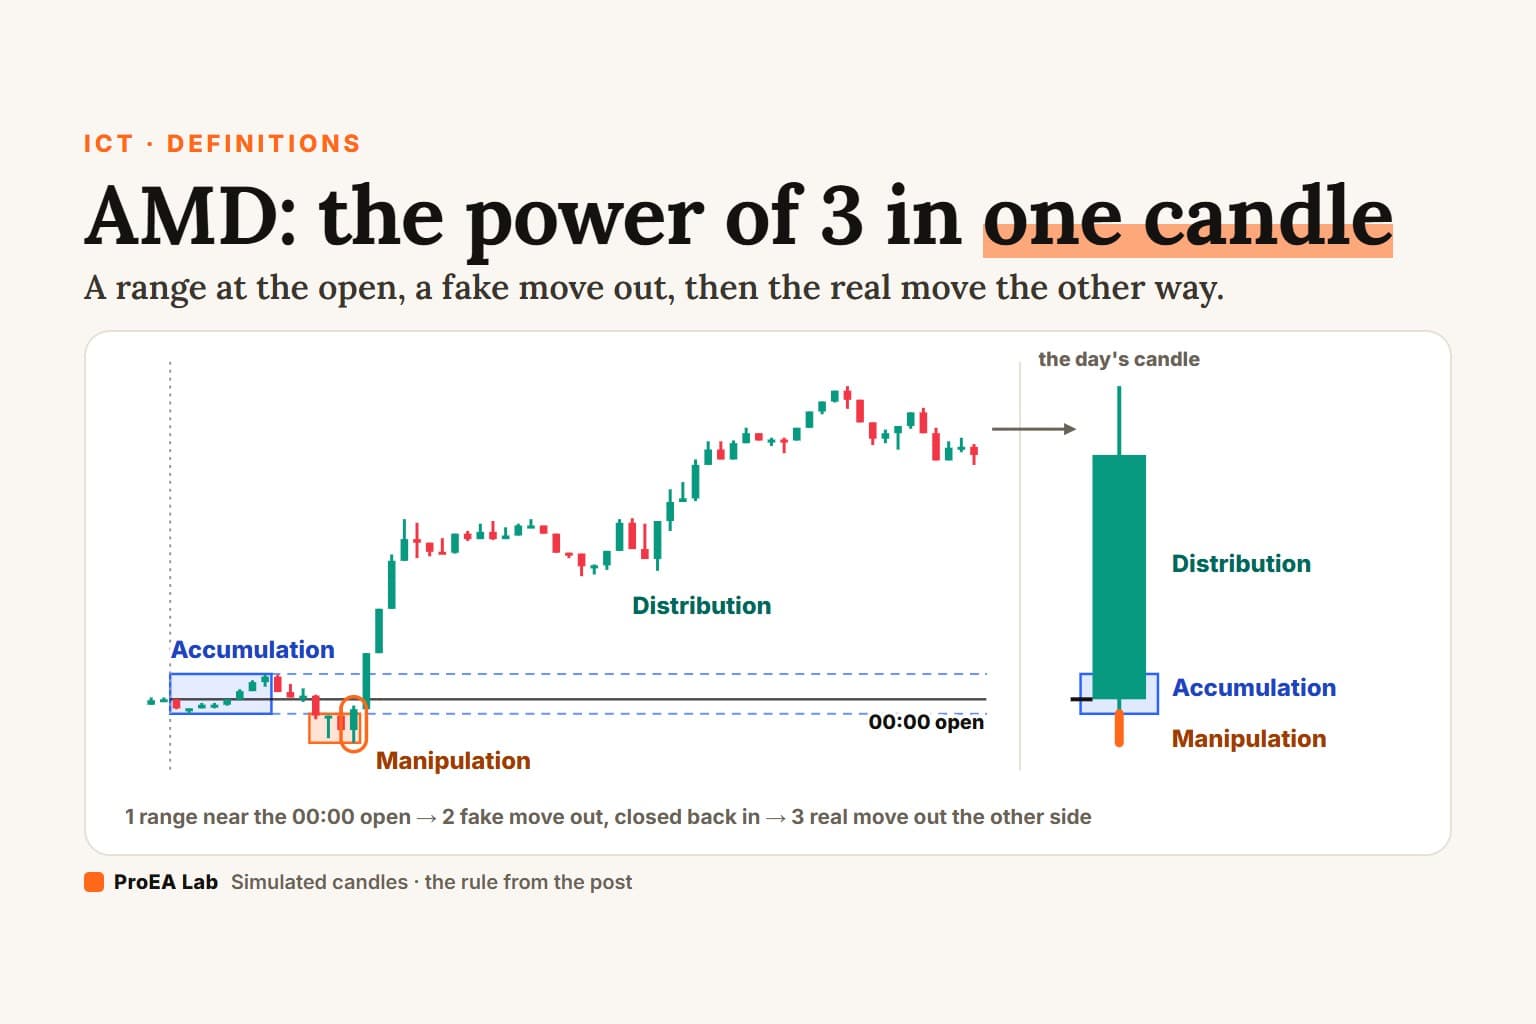
The window runs one side. The first gap toward the other side is the setup. It's the same shape, a run of one side and then a move toward the other, that AMD (power of 3) reads across a whole day.
Simulated candles, not market data. The simulated market is busier in London's and New York's office hours, read on each city's own clock: a choice of the simulation, not a measurement. Times are New York time. The levels are 15-minute swings (3 candles on each side) that no candle had traded through when the window opened; the gaps follow SMC Basics' rule (at least 0.3 × ATR(14)).
Read as text
- Simulated 3-minute candles from 09:00 New York time.
- At 10:00 the window opens. The nearest 15-minute swing high above price is at 74.72, the nearest swing low below it at 73.69.
- At 10:21 a candle trades above the swing high. That side has been run, so the draw is the other one: the swing low at 73.69, and only shorts count.
- The three candles from 10:27 to 10:33 leave the first bearish fair value gap after that candle, inside the window: 74.71 to 74.76. Its near edge, 74.71, is the entry. The stop is above its three candles, at 74.84. The draw is 7.8 times the risk away, more than the 2 the rule needs.
- At 10:39 price trades back into the gap before 11:00: the entry fills at 74.71.
- At 11:12 price reaches the draw at 73.69 before the stop: the target.
- The film ends 4 candles later, wherever price is.
How this window was chosen: The first simulated weekday whose 10:00–11:00 window gives a setup that fills and then reaches the draw before its stop. The film runs from 09:00 New York to 4 candles after the target, or to 11:06 if that is later.
Use itAt 10:00, mark the nearest 15-minute swing high and low. Wait for the window to run one, then for the first gap toward the other.
Watch outThe Stopped out tab is the same rule on another day. A setup is a plan with a stop, not a result.
Does a gap before 10:00 count?
No. All three of the gap's candles must open inside the window. A gap at 09:45 is a fair value gap, not a Silver Bullet. So is one that starts at 11:00.
Simulated candles, not market data. The simulated market is busier in London's and New York's office hours, read on each city's own clock: a choice of the simulation, not a measurement. Times are New York time. The levels are 15-minute swings (3 candles on each side) that no candle had traded through when the window opened; the gaps follow SMC Basics' rule (at least 0.3 × ATR(14)).
Read as text
- Simulated 3-minute candles from 09:00 New York time. The three candles from 09:45 to 09:51 leave a bearish fair value gap, 85.35 to 85.40. It forms before the window opens, so the rule ignores it.
- At 10:00 the window opens. The nearest 15-minute swing high above price is at 85.76, the nearest swing low below it at 85.12.
- At 10:15 a candle trades above the swing high. That side has been run, so the draw is the other one: the swing low at 85.12, and only shorts count.
- The three candles from 10:27 to 10:33 leave the first bearish fair value gap after that candle, inside the window: 85.58 to 85.70. Its near edge, 85.58, is the entry. The stop is above its three candles, at 85.80. The draw is 2.1 times the risk away, more than the 2 the rule needs.
- At 10:36 price trades back into the gap before 11:00: the entry fills at 85.58.
- At 10:54 price reaches the draw at 85.12 before the stop: the target.
- The film ends 3 candles later, wherever price is.
How this window was chosen: The first simulated weekday on which a gap pointing the same way as the setup's forms in the half hour before 10:00 (its third candle opening from 09:30 on) and the 10:00–11:00 window then gives a setup that fills, whatever happens next. The film runs from 09:00 New York to 4 candles after the setup's exit.
Use itStart looking at 10:00. Gaps from before the window are context, not the setup.
Watch outOn 3-minute candles the last gap that counts runs 10:51 to 10:57. A gap whose third candle opens at 11:00 is out.
Does daylight saving time change the Silver Bullet?
On the New York clock, no: 10:00 is 10:00 all year. In UTC, every window is an hour earlier from the second Sunday of March to the first Sunday of November.
And the London open window isn't always London's open. 03:00 New York is 08:00 in London most of the year, but 07:00 from 8 to 28 March and from 25 to 31 October 2026, when New York has changed its clocks and London hasn't yet. The ICT killzones page replays those weeks.
What timeframe is the Silver Bullet traded on?
innercircletrader.net: "I use the 15-minute chart as the parent chart to identify liquidity and bias. For the actual entry, I drop to the 1-minute or 3-minute." This rule reads the same on either. A lower timeframe gives more, smaller gaps, and smaller stops, which costs eat faster.
What's the difference between the Silver Bullet and a killzone?
A killzone is a window of two and a half to four hours. A Silver Bullet window is one hour inside one of them, plus a setup: the draw and the first gap toward it.
How to trade the Silver Bullet, step by step
- Put the chart, or your tool's time zone setting, on America/New_York.
- Before 10:00, mark the nearest 15-minute swing high above price and swing low below it.
- From 10:00, wait for a candle to trade through one of them. The other one is the draw.
- Mark the first gap toward the draw whose three candles open inside the window.
- Check the draw is at least 2R from the gap's near edge. Set the limit there, the stop beyond the three candles, the target at the draw.
- No fill by 11:00, or the draw trades first: cancel. That window is done.
Common mistakes
- Typing the hours in UTC or your local time. They drift an hour against New York twice a year.
- Taking the first gap of the day instead of the first gap inside the window.
- Naming the draw after the move. Write the levels down at 10:00.
- Taking a gap that points away from the draw.
- A second setup after a stop. One per window.
- A stop so tight that costs eat it. The smaller the stop, the bigger the share spread and commission take.
Does the ICT Silver Bullet work?
The test that matters is cheap: run the same rule one hour later. If 11:00–12:00 does as well as 10:00–11:00, the hour isn't doing the work.
Which tools draw the ICT Silver Bullet?
One of ours draws the whole setup; three free ones draw parts of it. We checked each one's Pine source.
The whole setup. Pine Strategy Foundation ($39 one-time) ships an ICT Silver Bullet worked example: a strategy that shades 10:00 to 11:00 New York, draws the draw level as a dotted line and the gap as a box, and marks each entry. Its "Killzone start hour (ET)" input moves the window, so the one-hour-later test above is one setting. Its rule isn't this page's: the draw is the high or low printed between 00:00 and 10:00 New York, whichever side the first gap points at, while price hasn't traded through it; it enters at the close of the gap's third candle without waiting for a retrace; the stop sits 0.1 ATR beyond the gap's far edge, at least 0.4 ATR from the entry; the target is 2R, and it's flat by 11:30. Its own file marks it untested.
ICT Levels Desk, free, doesn't shade the Silver Bullet hour. It draws the New York AM killzone box (08:30–11:00) around it, the macros either side of 10:00 and 11:00 (09:50–10:10, 10:50–11:10), and the first gap after the 09:30 open. That last one is a different anchor: the first gap after 09:30, either direction, any size by default.
SMC Basics, free, draws fair value gaps with this page's gap rule (at least 0.3 × ATR(14)) at any hour; it doesn't know the window. IFVG Desk, free, gates its entries to a New York session, 09:30 to 11:00 by default; typed as 1000-1100, it only enters in the Silver Bullet hour. Its setup is the inverted gap, not this one.
The SMC AI-Scored Toolkit (v1.4.2) scores every gap, and part of the score is time: 1.0 for a zone born inside 07:00–10:00 or 12:00–15:00, 0.25 outside. Those windows have no time zone, so Pine reads them in your chart's exchange time zone. On a chart that keeps UTC, 10:00–11:00 New York is 15:00–16:00 in winter (0.25) and 14:00–15:00 in summer (1.0).
More concepts, each with one rule and its own replays: SMC & order flow.
Disclosure
We build ICT Levels Desk, SMC Basics and IFVG Desk and give them away; we sell Pine Strategy Foundation and the SMC AI-Scored Toolkit. We have no relationship with innercircletrader.net, TradingFinder, ictkillzone.com or LuxAlgo. Nothing here is financial advice.
Use these animations on your site.