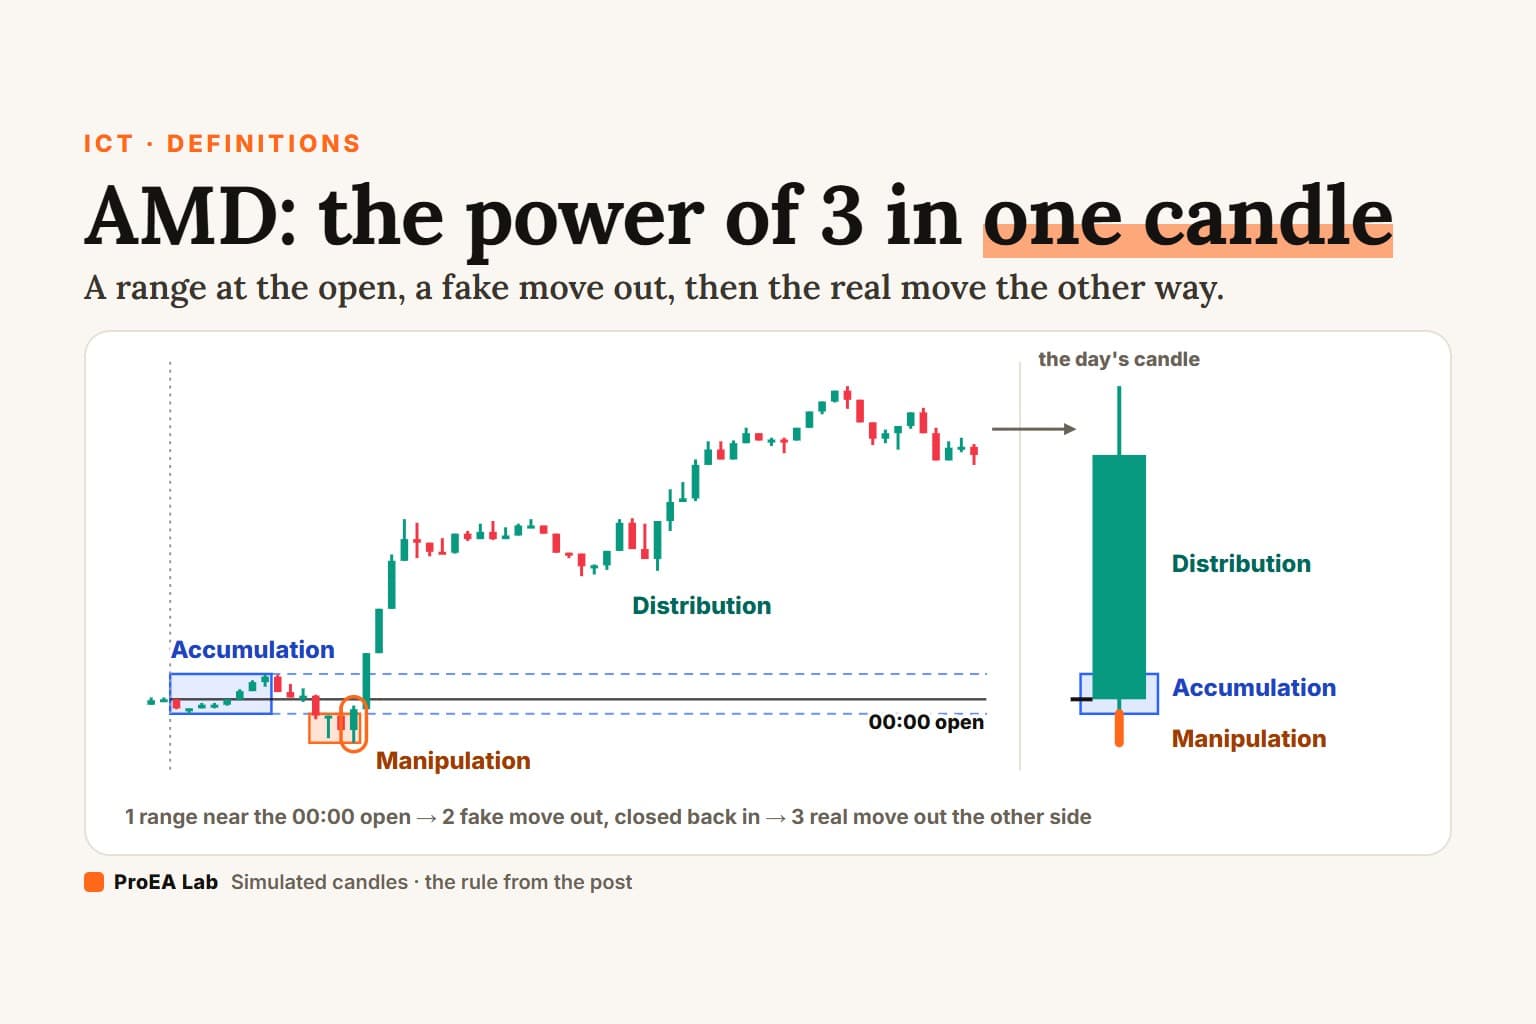
AMD (accumulation, manipulation, distribution) is ICT's power of 3: one trading day read in three steps. Price ranges near the open (accumulation), makes a fake move out of one side of that range (manipulation, a liquidity sweep), then runs out of the other side (distribution). A bullish AMD day fakes down first. On the daily chart, the fake move is the candle's lower wick and the real move is its body.
You can only call a day AMD once it has closed. So this page writes the rule down, and every chart below is a replay of simulated candles read by it. It builds on the liquidity sweep.
What is AMD in trading?
Three steps of one day, named for a story about smart money: it builds positions, runs stops the other way, then pushes price where it wanted to go. A chart can't show intent. It shows a shape: a range, a fake move, a real one.
Simulated 15-minute candles, not market data. Times are New York. The accumulation range is 00:00 to 02:00; a sweep has to close back inside within the hour; the day closes at 16:00.
Read as text
- Simulated 15-minute candles, New York time. The day opens at 00:00 at 109.06.
- From 00:00 to 02:00 price stays between 108.90 and 109.34: the accumulation range.
- At 02:45 price trades below it, to 108.58, and the 03:45 close is back inside: the manipulation, a sweep of the range's low.
- The 04:00 close is above 109.34, the range's other side: the distribution starts.
- At 16:00 the day closes at 111.76. Its candle: open 109.06, high 112.52, low 108.58, close 111.76. The lower wick below the open is the manipulation; the body up from the open is the distribution; the accumulation sits around the open.
How this window was chosen: The first simulated day that prints bullish AMD by this page's rule with every part visible: an accumulation range at least 1.5 average candles tall, a manipulation that trades at least half an average candle below it, and a lower wick on the day's candle at least a tenth of the day's range.
Use itRead the day's candle as three parts: the range around the open, the wick on the fake-move side, the body the other way.
Watch outA daily candle can't show which came first. A lower wick on a bullish candle is AMD only if the low came before the run up.
What is the power of 3 candle?
The same day, folded into one candle. In a bullish day the open sits inside the early range, the fake move becomes a lower wick below the open, and the run up becomes the body. A bearish day mirrors it.
innercircletrader.net puts it in one line: "The bullish day prints a wick below the open (the manipulation low), runs to the high of the day to clear external liquidity, and closes near the high of the daily range." (ICT Power of 3, checked 2026-10-04.)
The AMD rule, written down
No source we read says how long accumulation lasts, so we fixed it. Every film uses this rule:
AMD on one day
New York time, 15-minute candles.
1. Open: the 00:00 price.
2. Accumulation: the high and low from 00:00 to 02:00.
3. Manipulation: after 02:00, price trades beyond one side
   of that range, and a candle closes back inside it within
   the hour (4 candles). Only the first move out counts.
   A close beyond that same side again cancels it.
4. Distribution: a later close beyond the other side.
5. AMD: the 16:00 close is beyond that other side, and the
   manipulation's extreme is still the day's extreme.
   A sweep of the low = bullish AMD. Of the high = bearish.
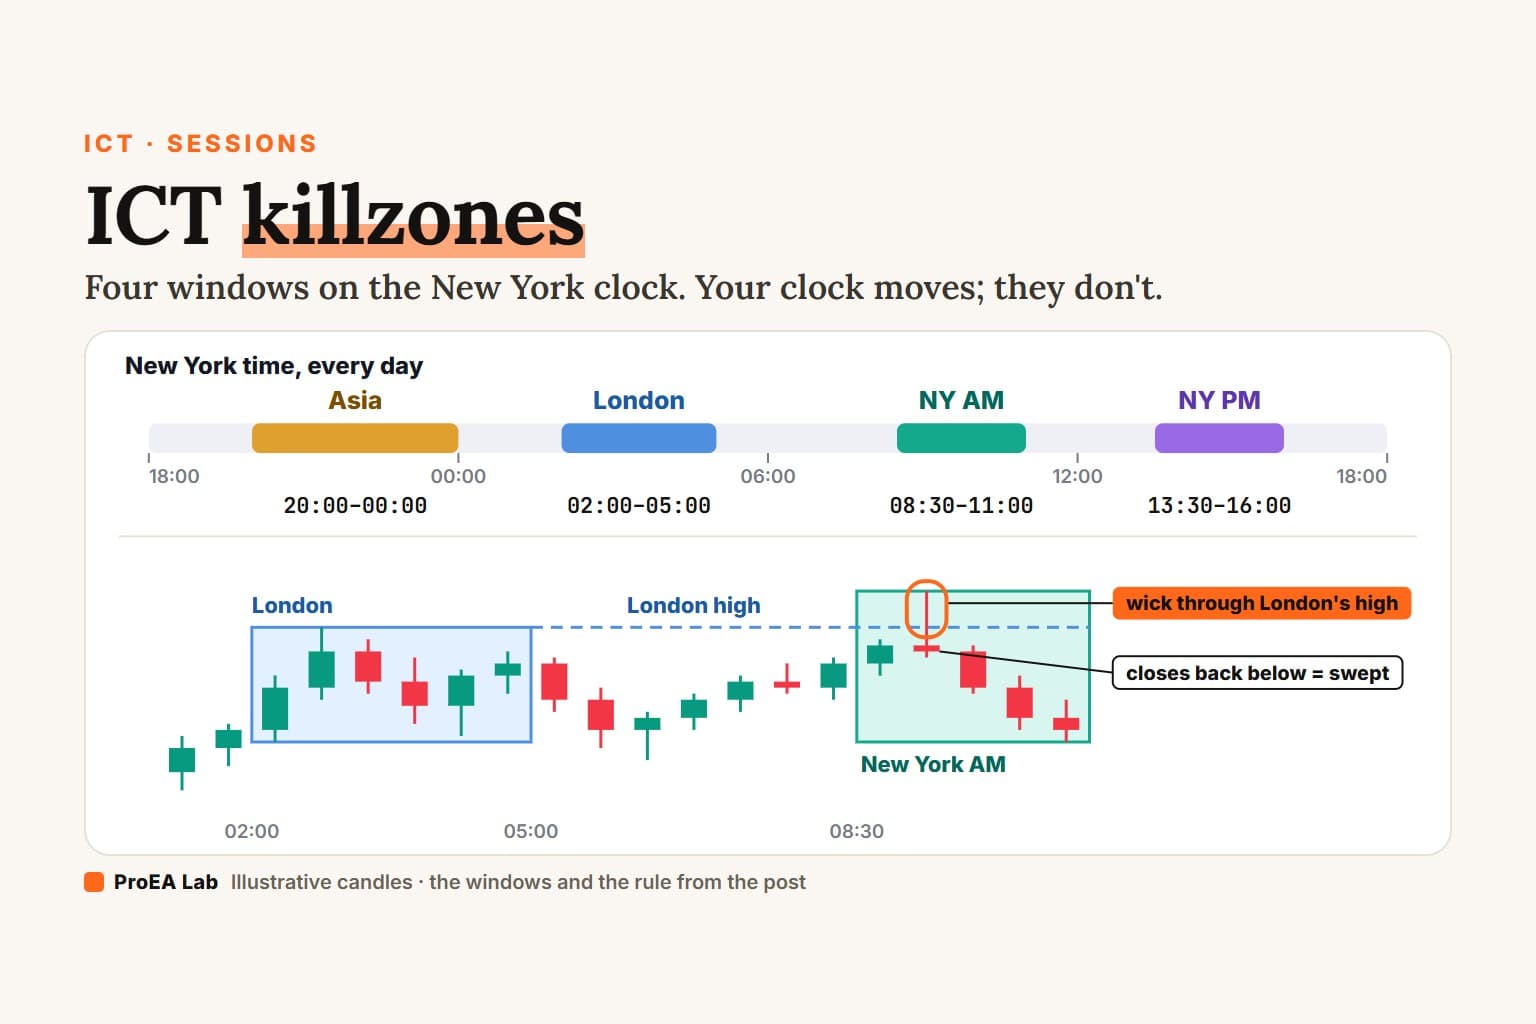
Why 02:00? It's when the London window of the ICT killzones opens, in New York time, as in ICT Levels Desk and Sweep Desk. Why an hour? A deadline, as in our liquidity sweep rule. Without one, every breakout that fails later turns into a manipulation in hindsight.
Change the window and you change the answer.Can you see AMD while it happens?
Not the whole thing. When price first leaves the range, a fake move and the start of the real move look the same. The close back inside makes it a sweep. The close through the other side starts the distribution. Only the 16:00 close makes it AMD.
Simulated 15-minute candles, not market data. Times are New York. The accumulation range is 00:00 to 02:00; a sweep has to close back inside within the hour; the day closes at 16:00.
Read as text
- Simulated 15-minute candles, New York time. The 00:00 open is 105.85; by 02:00 the accumulation range is 105.15 to 105.85.
- At 02:00 price trades below the range. On that candle nobody can know yet whether it is the fake move or the start of the real one.
- The 02:30 close is back inside the range, 2 candles after price left it (the rule allows 4, one hour): a sweep. Now it reads as manipulation.
- The 04:30 close is above the range's other side: distribution.
- At 16:00 the day closes at 108.14, above the range, and the sweep's low of 104.95 is still the day's low. Only now has the day printed AMD.
How this window was chosen: The second simulated day that prints bullish AMD under the same visibility rule as the first film (that film shows the first).
Use itWait for the close back inside. Before it, the move out of the range is just a move.
Watch outThe rule says AMD at 16:00, when the day is over. Every step before that can still fail.
Bullish vs bearish AMD
| Bullish AMD | Bearish AMD | |
|---|---|---|
| Fake move | down, below the range | up, above the range |
| Swept | the range's low | the range's high |
| Distribution | a close above the range | a close below the range |
| Daily candle | lower wick below the open, body up | upper wick above the open, body down |
| Day's extreme | the low, made by the fake move | the high, made by the fake move |
Does every day follow AMD?
No. Here are three ways a day falls short, by the same rule.
Simulated 15-minute candles, not market data. Times are New York. The accumulation range is 00:00 to 02:00; a sweep has to close back inside within the hour; the day closes at 16:00.
Read as text
- Simulated 15-minute candles, New York time. The 00:00 open is 105.98; by 02:00 the accumulation range is 105.98 to 106.37.
- At 02:00 price trades above the range, exactly as a manipulation would start.
- But no close comes back inside within the hour. By the rule there is no sweep, so no manipulation.
- The day closes at 110.15, above the range. The move out of the range was the day's real move.
How this window was chosen: The first simulated day whose price leaves the accumulation range, doesn't close back inside within the hour, and closes the day beyond that side, with a range at least 1.5 average candles tall.
The third one is the trap. Its daily candle has the power of 3 shape: a long lower wick and a close at the high. The 15-minute path shows the first fake move went up, not down.
Use itWrite down what ends the idea before it starts: no close back within the hour, a close beyond the swept side, or a trade through the sweep's extreme.
Watch outA daily candle with a long wick isn't proof of AMD. It hides which side went first.
Does AMD show up in random prices?
Yes. Our simulated market has no orders, no stops and nobody behind it: seeded random candles with a quiet night and busier London and New York hours. By this rule, 30 of its 363 days printed AMD (20 bullish, 10 bearish). On 191, the first move out of the range kept going. On 106, the sweep was cancelled. On 36, the expansion failed.
So the shape alone can't prove that anyone manipulated anything. And these counts say nothing about how often real markets print AMD. They depend on how we built the simulation.
AMD vs the Judas swing
Close cousins. The Judas swing is ICT's name for the early false move of a session, which is the manipulation step here. Asked if the two are the same, innercircletrader.net's author answers: "Yes these are almost same. But AMD can happen many times in a day". The manipulation itself is a liquidity sweep: a wick through a level, then a close back.
Where sources differ
- Which open. innercircletrader.net: "Mark the daily opening price at midnight New York time." Your chart's daily candle usually opens elsewhere: ICT Levels Desk's default day-open time for futures and most CFDs is 18:00 New York. That candle isn't the one ICT reads.
- How long accumulation lasts. No source we read gives a number. Some use the Asian session instead: 20:00 to 00:00 New York in ICT Levels Desk and Gold Sweep Desk.
- How often. Once a day, as a daily candle, or "many times in a day" (the innercircletrader.net author).
- Which candle. We use the day. On a 4-hour candle, the same rule needs shorter windows.
How to read AMD, step by step
- Mark the 00:00 New York open.
- At 02:00, mark the range's high and low. Don't move them later.
- Price leaves the range: do nothing yet.
- A close back inside within the hour is a sweep. Note its extreme.
- A close beyond the swept side again ends the idea.
- A close through the other side is the distribution. That's the earliest the rule names a direction.
- Pick your entry before the day starts: a fair value gap, a CHoCH (BOS vs CHoCH), a close. Stop beyond the sweep's extreme.
Common mistakes
- Calling it after the close. Any day with a wick can be drawn as AMD once it's over.
- Moving the range. A different window gives a different range, and a different answer.
- Entering on the first move out. That's the moment a fake and a real move look the same.
- Reading the daily candle alone. It can't show which side went first.
- Using your broker's daily candle. It often opens at 18:00 New York, not at midnight.
- Expecting AMD every day. The rule said no on 333 of the 363 simulated days.
Does AMD trading work?
Which tools draw AMD?
None of ours labels a day AMD. Four free ones draw its parts; we read the Pine source of each.
The parts of AMD on your own chart, free. ICT Levels Desk draws the 00:00 open as a solid line and boxes the Asia (20:00 to 00:00 New York), London, New York AM and PM sessions. When a session ends, its high and low stay as lines, and the first candle that trades through one and closes back gets a ⚡ swept mark. Opening Range Desk draws the range of any window you set (09:30 to 09:45 New York by default; set 0000-0200 for this page's range) and marks a ✕ fake-out when a candle wicks out of the range and closes back inside, before any close beyond it. Its "trade the failure" switch, off by default, enters the other way after a close back inside. Sweep Desk marks sweeps of the levels it tracks (swings, equal highs and lows, killzone and previous-day highs and lows), then waits for a flipped gap or a structure shift. It doesn't track a 00:00 to 02:00 range.
On gold, Gold Sweep Desk boxes the Asia and London ranges, marks their sweeps in the London and New York windows, and then waits for the flip: the run the other way.
The SMC AI-Scored Toolkit (v1.4.2) doesn't draw AMD. It scores order blocks and fair value gaps.
More concepts, each with one rule and its own replays: SMC & order flow.
Disclosure
We build ICT Levels Desk, Opening Range Desk, Sweep Desk and Gold Sweep Desk and give them away; we sell other indicators, including the SMC AI-Scored Toolkit. We have no relationship with innercircletrader.net. Nothing here is financial advice.
Use these animations on your site.