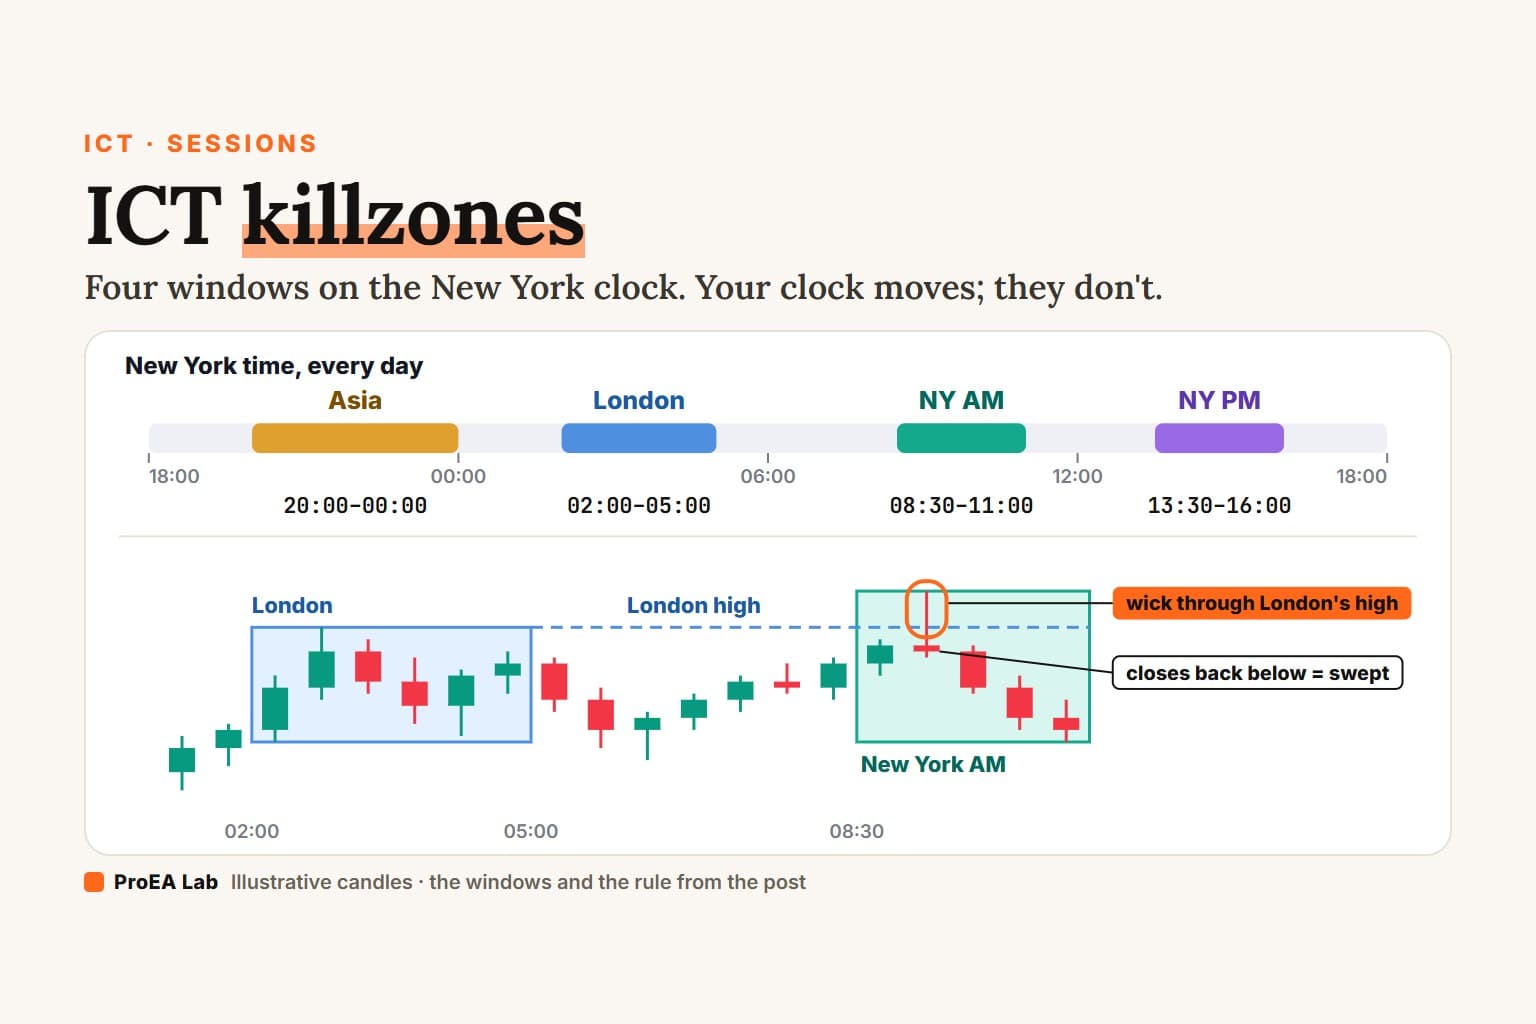
ICT killzones are fixed windows on the New York clock: Asia 20:00–00:00, London 02:00–05:00, New York AM 08:30–11:00 and New York PM 13:30–16:00. They follow New York's daylight saving time, so on UTC and most other clocks they shift by an hour for part of the year. Sources disagree on the edges. This page uses one written set: the one ICT Levels Desk draws.
Every chart below is a replay of simulated candles. The levels the windows leave behind are read with the close, as in liquidity sweep.
What are ICT killzones?
A few hours of each day, named after the market that's busiest in them. Guides that teach them call killzones the hours of high volume and volatility (innercircletrader.net, checked 2026-10-04). We haven't measured that. On a chart, each window is a box from the high to the low of its candles.
Simulated candles, not market data. The simulated market is busier in London's and New York's office hours, read on each city's own clock: a choice of the simulation, not a measurement. The strip's UTC and "You" rows are computed for today's date in your browser's time zone.
Read as text
- One simulated day on 30-minute candles, from 18:00 to 18:00 New York time. Each window draws a box from the high to the low of its candles, growing as they close.
- Asia, 20:00–00:00 (the evening before): the box runs from 103.30 to 103.90.
- London, 02:00–05:00: the box runs from 103.22 to 103.86.
- New York AM, 08:30–11:00: the box runs from 103.21 to 104.45.
- New York PM, 13:30–16:00: the box runs from 104.16 to 104.76.
- The windows are fixed on the New York clock. In UTC they are Asia 01:00–05:00, London 07:00–10:00, NY AM 13:30–16:00, NY PM 18:30–21:00 while New York is on standard time, each an hour earlier while it's on daylight saving time.
How this window was chosen: The first full simulated day, Monday 18:00 to Tuesday 18:00 New York time, on 30-minute candles. No other condition: every day has the same four windows.
Use itPut your chart or your tool on New York time (America/New_York) and read the windows straight off it.
Watch outA window typed in UTC or your local time is right for only part of the year. See the daylight saving section.
What time are the ICT killzones?
In New York time, every day:
| Killzone | New York | UTC, Nov to Mar | UTC, Mar to Nov |
|---|---|---|---|
| Asia | 20:00–00:00 | 01:00–05:00 | 00:00–04:00 |
| London | 02:00–05:00 | 07:00–10:00 | 06:00–09:00 |
| New York AM | 08:30–11:00 | 13:30–16:00 | 12:30–15:00 |
| New York PM | 13:30–16:00 | 18:30–21:00 | 17:30–20:00 |
New York is on standard time from the first Sunday of November to the second Sunday of March. The strip under the first film shows today's times on your own clock.
Why do sources give different killzone times?
Because there's no official table. Three popular guides and our own tool, all in New York time, checked 2026-10-04:
- innercircletrader.net (updated 15 Jun 2026): Asia 19:00–22:00, London 02:00–05:00, New York 07:00–09:00 in its table and 07:00–10:00 in its FAQ.
- TradingFinder (modified 12 Nov 2025): Asia 20:00–22:00, London 02:00–05:00, New York AM 08:00–11:00 in its table and 07:00–10:00 in its FAQ, New York PM 13:00–15:00.
- ictkillzone.com (updated Sep 2026): Asia 19:00–22:00, London 02:00–05:00, New York 07:00–09:00.
- ICT Levels Desk (ours, defaults): Asia 20:00–00:00, London 02:00–05:00, New York AM 08:30–11:00, New York PM 13:30–16:00.
innercircletrader.net and ictkillzone.com also list a London close window, 10:00–12:00. Everyone agrees on London. New York starts at 07:00, 08:00 or 08:30, and two of the three guides give two different New York windows on the same page.
Pick one set, write it down, and keep it.This page uses ICT Levels Desk's set, so the boxes here are the boxes the free tool draws on your chart.
The rule
Killzone rule
1. Clock: New York time, the IANA zone America/New_York,
   daylight saving time included. Never a fixed UTC offset.
2. Windows: Asia 20:00-00:00, London 02:00-05:00,
   New York AM 08:30-11:00, New York PM 13:30-16:00.
3. A candle belongs to a window if it opens inside it.
4. The window's high and low are the highest high and the
   lowest low of its candles, final when the window ends.
5. After that, the first candle that trades beyond one of them
   decides: a close back inside = swept, a close beyond = broken.
Step 5 is ICT Levels Desk's own rule for a session's high and low. A sweep that needs a minimum depth, or gives the close a few candles, is a different rule: liquidity sweep covers those.
How does New York sweep London's high or low?
London sets a high and a low. New York AM trades through one of them. That's the picture the guides describe: "Asian high/low for the London killzone, London high/low for the New York killzone" (innercircletrader.net).
The wick through the level looks the same either way. The close decides.
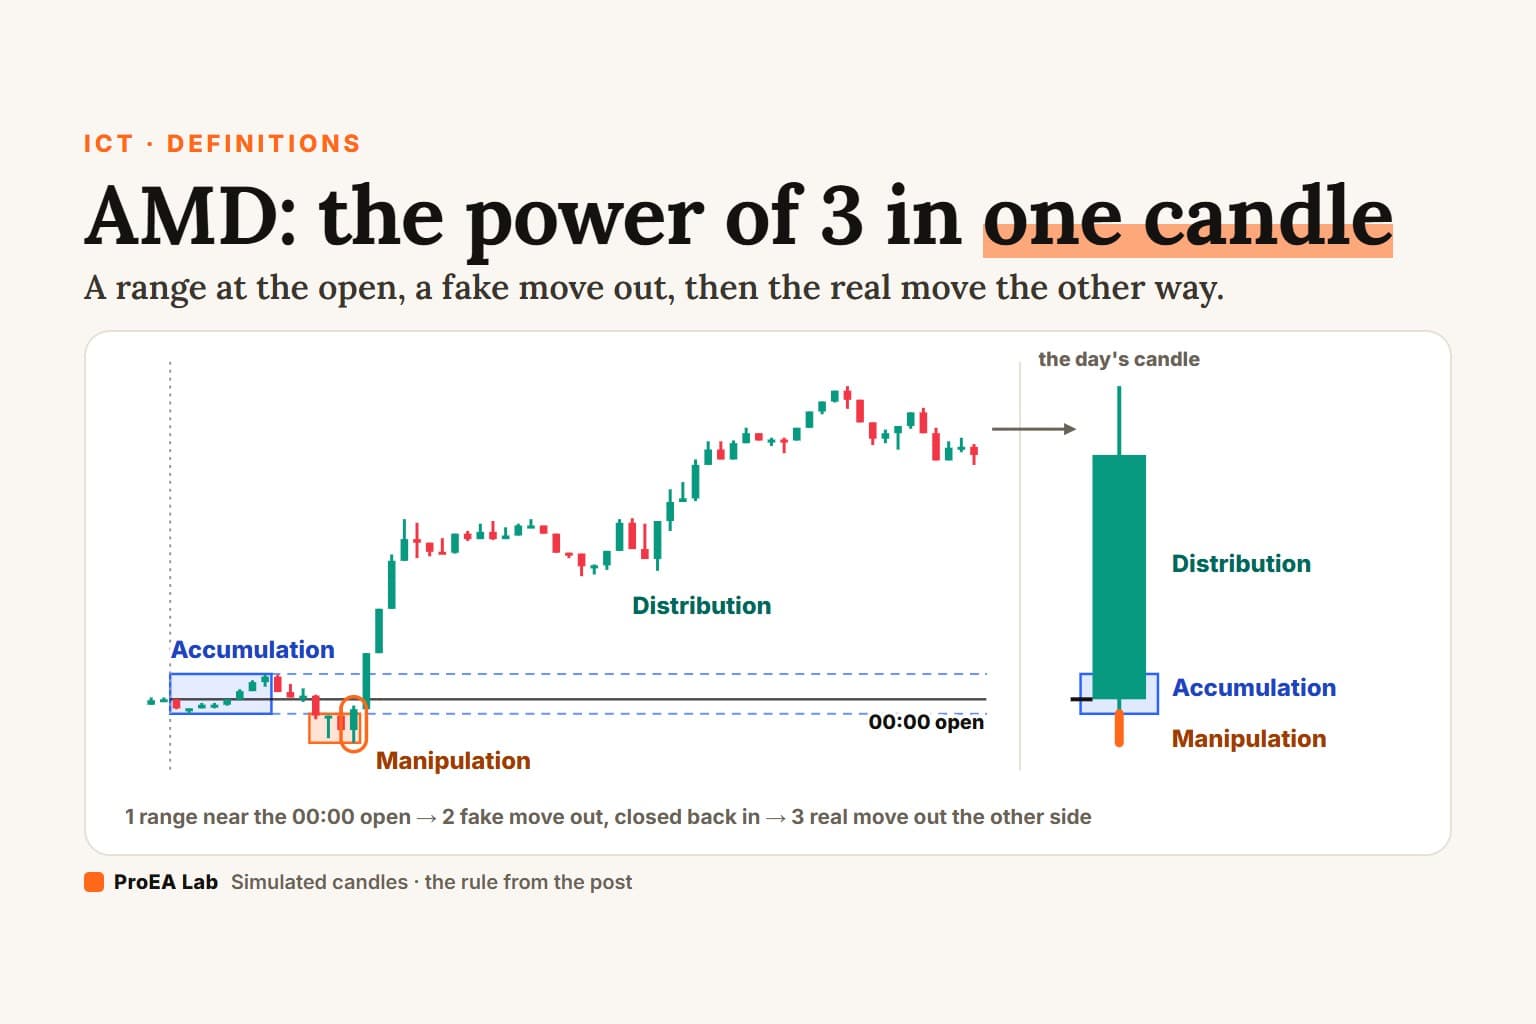
Read across a whole day, a sweep of the night's range is the middle step of AMD (power of 3), and the run the other way is the last.
Simulated candles, not market data. The simulated market is busier in London's and New York's office hours, read on each city's own clock: a choice of the simulation, not a measurement. Times are New York time.
Read as text
- Simulated 15-minute candles from 00:00 New York time. From 02:00 to 05:00 the London window's candles draw a box: its high is 100.60, its low 98.82.
- When the window ends, its high and low become levels. Nothing trades beyond either of them before New York AM opens at 08:30.
- At 10:30 a candle trades below London's low at 98.82, to 98.80, and closes back inside at 98.98. The first candle beyond the level closed back inside: London's low was swept.
- At 10:45 a later candle closes below the level, at 98.66. A close beyond still breaks a swept level: London's low is now broken.
- The film ends 8 candles after the first candle beyond, wherever price is.
How this window was chosen: The first simulated weekday on which the first candle after the London window to trade beyond London's high or low opens inside the New York AM window, trades beyond only one of them, and closes back inside London's range. The film ends 8 candles after that candle, whatever they do. No two films share candles: the sweep and break days come after the day film's day and are never one of the clock film's three dates.
Use itMark London's high and low at 05:00 New York time. In New York AM, wait for the first candle beyond one of them to close.
Watch outA close beyond the level is a break, not a sweep. And a swept level still breaks at a later close beyond it, as in the Swept replay.
Do killzone times change with daylight saving time?
On the New York clock, no. On every other clock, yes. New York changes its clocks on the second Sunday of March and the first Sunday of November. London changes on the last Sunday of March and the last Sunday of October. In between, for about three weeks in March and one week at the end of October, London is 4 hours ahead of New York instead of 5.
The London killzone, 02:00–05:00 New York time, in 2026:
- To 7 Mar and from 1 Nov, both on standard time: 07:00–10:00 in London and in UTC. London's 08:00 is 03:00 in New York.
- 8 to 28 Mar and 25 to 31 Oct, New York on daylight time, London not: 06:00–09:00 in London and in UTC. London's 08:00 is 04:00 in New York.
- 29 Mar to 24 Oct, both on daylight time: 07:00–10:00 in London, 06:00–09:00 in UTC. London's 08:00 is 03:00 in New York.
Simulated candles, not market data. The simulated market is busier in London's and New York's office hours, read on each city's own clock: a choice of the simulation, not a measurement. The dates set the clocks only.
Read as text
- Tuesday 17 March 2026, New York on daylight saving time, London not yet. Simulated 15-minute candles from 00:00 to 07:00 New York time.
- The London window is 02:00 to 05:00 on the New York clock, as on every date. Tonight that's 06:00 to 09:00 in London and 06:00 to 09:00 in UTC.
- 08:00 in London is 04:00 New York time, an hour later than in January and July, because London hasn't moved its clocks yet.
- A window set at 07:00 to 10:00 UTC covers 03:00 to 06:00 New York time tonight: it starts an hour after the London killzone does.
How this window was chosen: Three fixed Tuesdays of 2026, one per clock arrangement: 13 January (New York and London both on standard time), 17 March (New York on daylight saving time, London not yet) and 14 July (both on daylight saving time). The candles are whatever the simulation printed on those nights. No two films share candles: the sweep and break days come after the day film's day and are never one of the clock film's three dates.
Use itGive every session time a time zone: America/New_York. In Pine, that's the third argument of time().
Watch outPine reads a session with no time zone in the exchange's time zone, so the same string lands at different hours on different charts.
That last one is in the Pine manual (checked 2026-10-04): time() "use[s] the time zone of the exchange by default, unless a timezone argument is specified."
What's the difference between a killzone and a session?
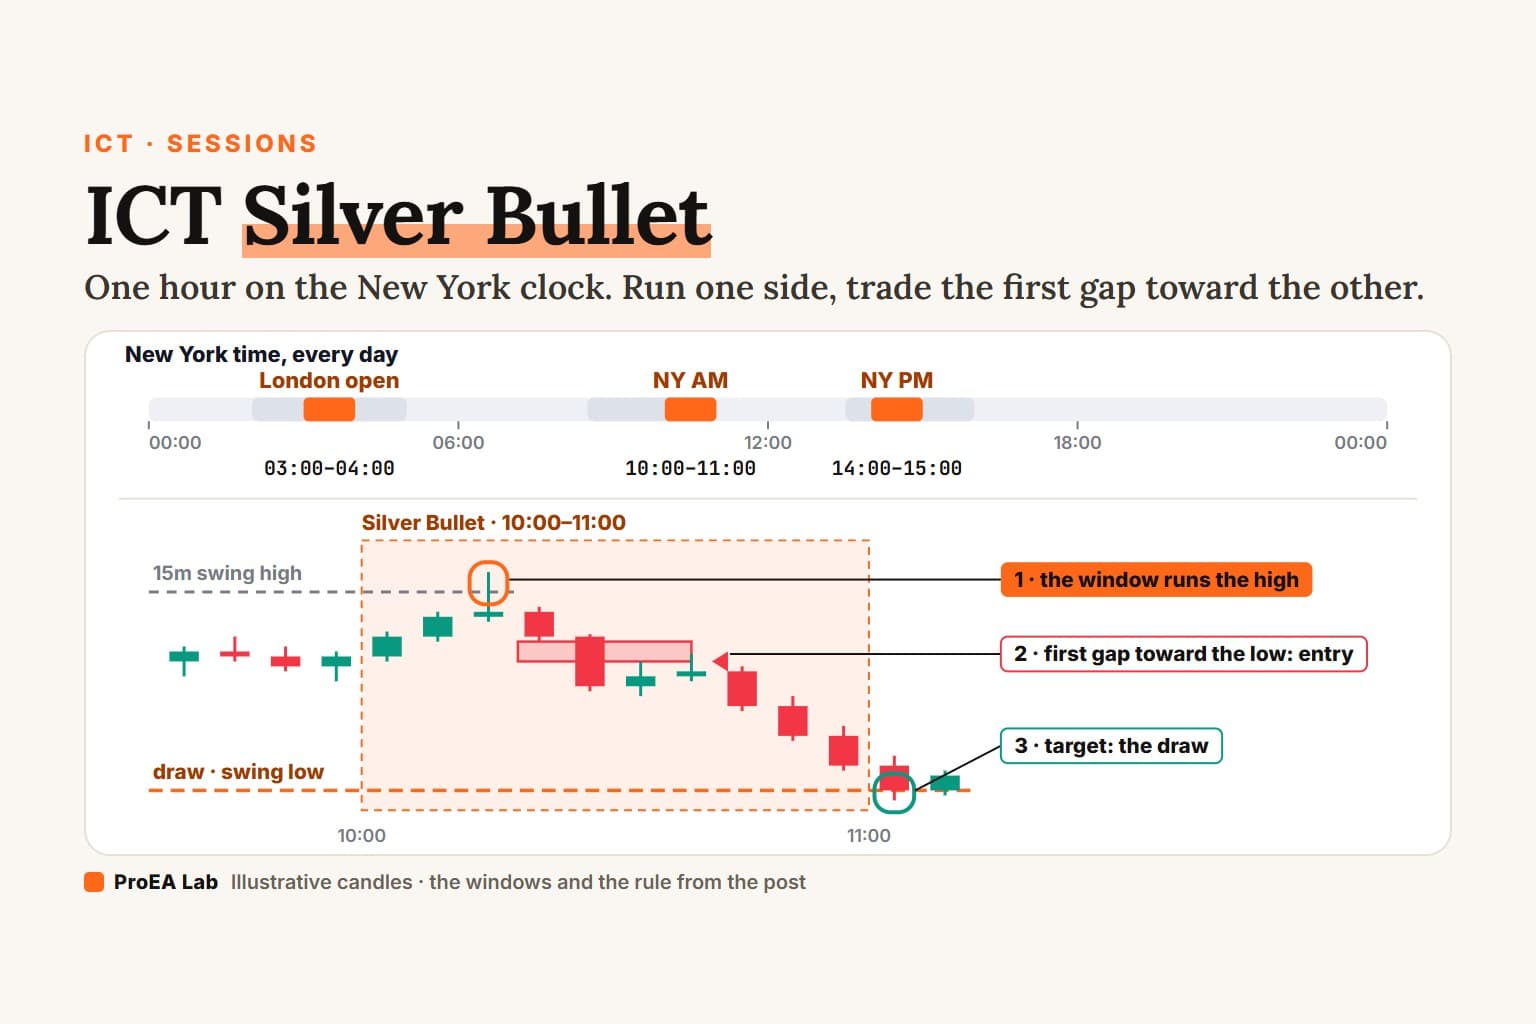
A session is a market's whole trading day. A killzone is a few hours inside it. London's session runs all morning and afternoon in London; its killzone is three hours around the open. The ICT Silver Bullet narrows it once more: one hour inside London, New York AM and New York PM.
Which killzone is best?
We haven't compared them, so we can't name one. Guides tie each window to markets, like EUR/USD and GBP/USD for London, and US indices and gold for New York (innercircletrader.net). The rule above is the same on every chart.
How to use killzones, step by step
- Put the chart, or your tool's time zone setting, on America/New_York.
- Pick one set of windows and write it down.
- When a window ends, mark its high and low. Asia's before London, London's before New York.
- In the next window, wait for the first candle beyond a level to close: swept or broken.
- Then look for your entry, like a fair value gap left on the way back, and check where price sits in premium and discount.
Common mistakes
- Typing the windows in UTC or your local time. They drift an hour against New York twice a year.
- Mixing sets. A 07:00 New York window from one guide and an 08:30 one from a tool aren't the same window.
- Calling a wick a sweep before the candle closes.
- Trusting a tool with no time zone setting. It reads the exchange's time zone, whatever that is for your symbol.
- Trading because the window is open. A killzone is a time, not a setup.
Do ICT killzones work?
Which tools draw ICT killzones?
Two of ours, free, plus one that reads them. We checked each one's Pine source.
Killzones on your own chart, free. ICT Levels Desk draws this page's four windows as boxes, on by default, on the New York clock (its "Timezone (IANA)" input). When a window ends, its high and low become lines that stay until swept or broken, with a "Session high / low swept" alert. It keeps 2 days of sessions by default. Sweep Desk turns the London, New York AM and New York PM highs and lows into liquidity pools by default, and shades the windows in its Full view.
Opening Range Desk is a different session tool: it boxes 09:30 to 09:45 New York time, inside the New York AM window, and reads the breakout of that box on closes.
The SMC AI-Scored Toolkit (v1.4.2) doesn't draw killzones. It uses them in its score: a zone born inside 07:00–10:00 or 12:00–15:00 gets the full time score (1.0), and one born outside gets 0.25. Those two windows have no time zone, so Pine reads them in your chart's exchange time zone. On a chart that keeps UTC, they're 02:00–05:00 and 07:00–10:00 New York time in winter, an hour later in summer. Type them in your chart's exchange time zone.
More concepts, each with one rule and its own replays: SMC & order flow.
Disclosure
We build ICT Levels Desk, Sweep Desk, Gold Sweep Desk and Opening Range Desk and give them away; we sell other indicators, including the SMC AI-Scored Toolkit. We have no relationship with innercircletrader.net, TradingFinder or ictkillzone.com. Nothing here is financial advice.
Use these animations on your site.