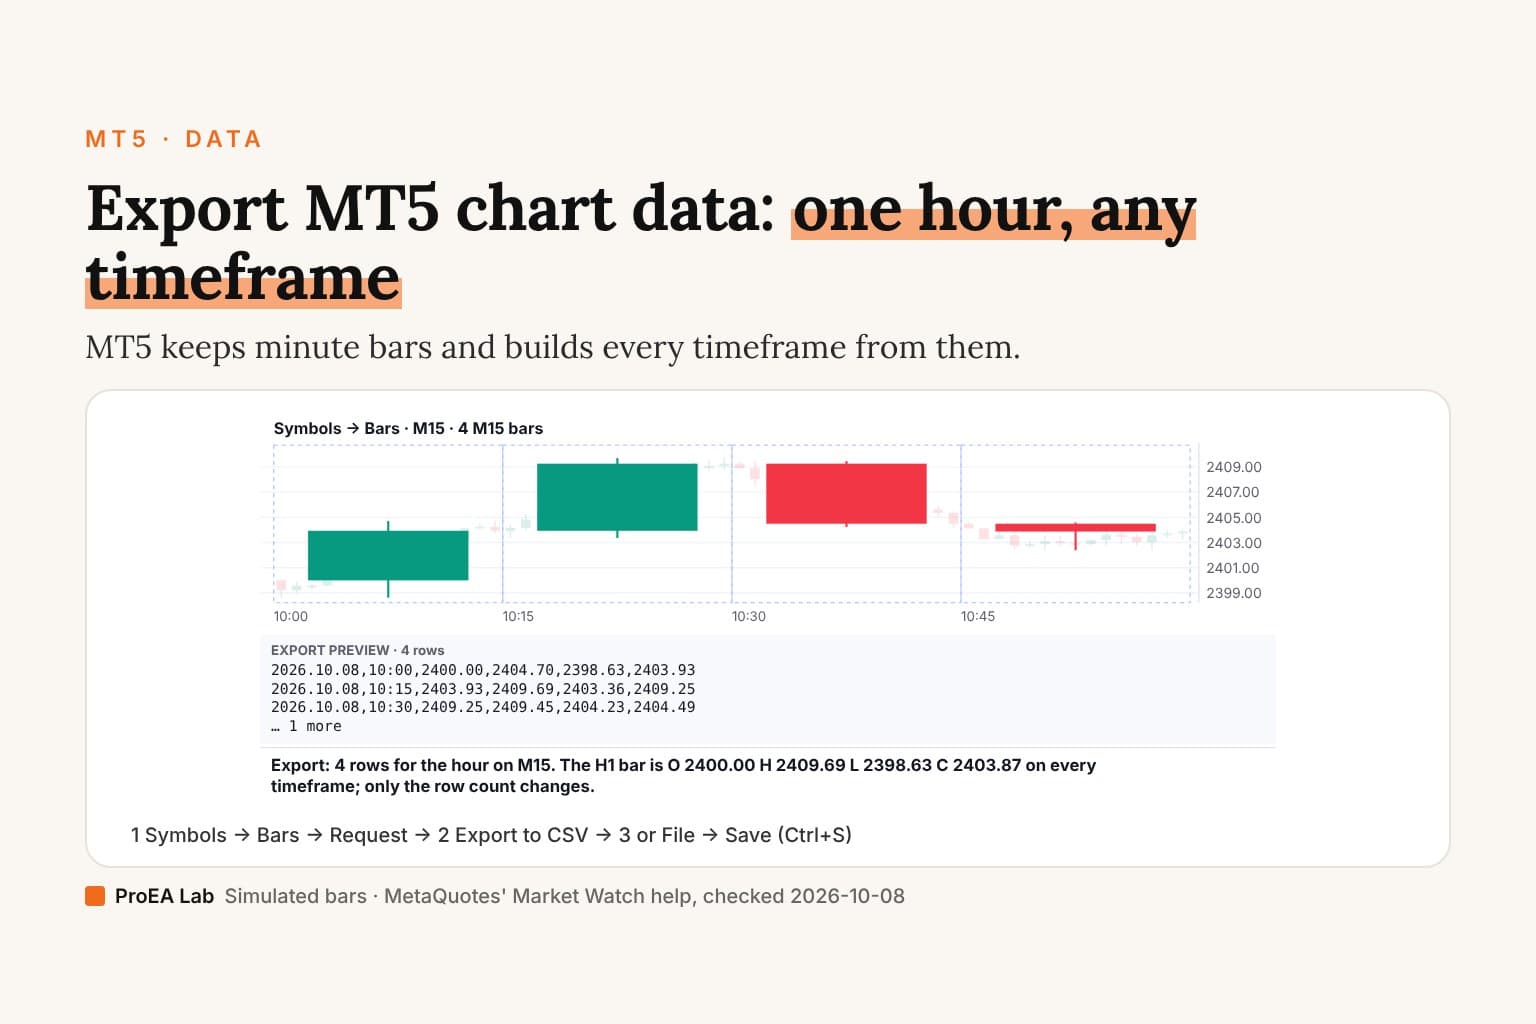
Getting trades into a journal is a one-time setup decision, and it decides whether your statistics mean anything for years. There are exactly three routes. Pick by how you trade, then run the honesty checks at the end no matter which you chose.
For a quick check before choosing a journal, use the free browser-local MT5 report analyzer. It reads supported statement tables and explicit CSV postings, separates deposits from trading results, and shows diagnostics before you rely on a calculation. Its posting statistics are not a completed-trade win rate or a floating-equity history.
Route 1 — a supported report file
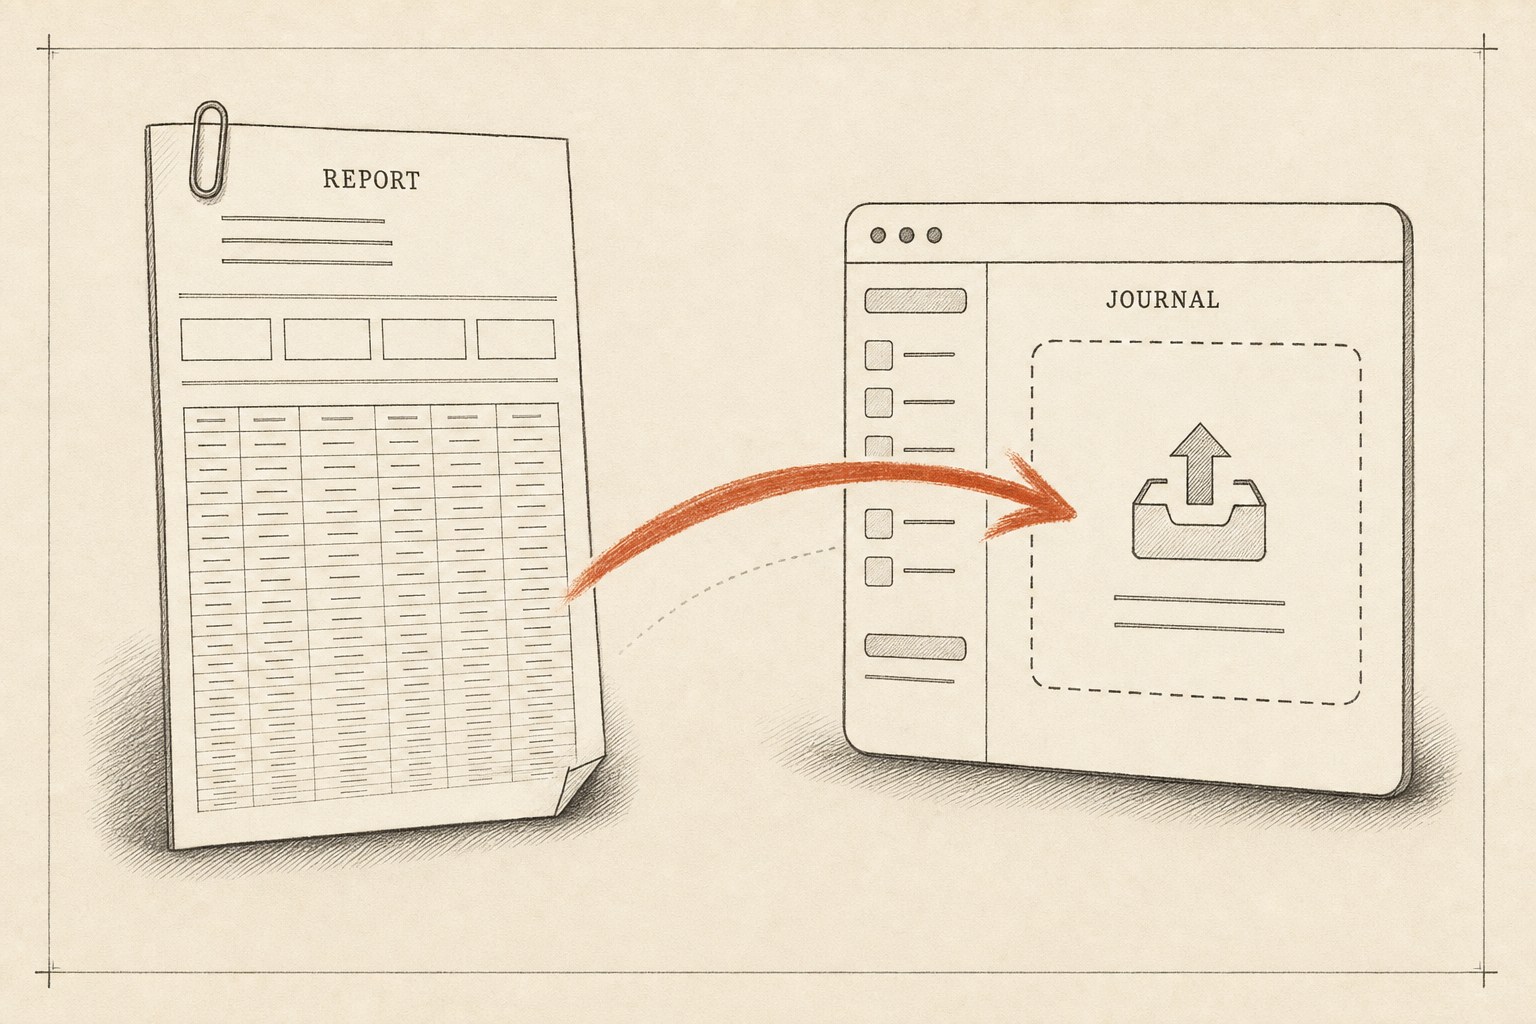
Export the HTML statement from your platform — the full export walkthrough is here — and check that the journal supports that particular layout. MT5 Deals and Positions tables represent different records; a visual Overview/PDF is a separate export. Field availability varies, and a statement does not automatically contain your later journal notes, setup tags or attachments. Tradervue, for example, documents its MT5 import as exactly this route: save the History report as HTML, then upload it (our Tradervue comparison covers the rest).
This route is the most reliable because the file is the broker's own accounting. Its one weakness is cadence: the journal only knows what you've exported, so pair it with a habit — end of week, export the week, import, done. Two minutes.
Route 2 — CSV (for everything else)
If your data lives anywhere non-MetaTrader — a prop platform's dashboard, an old spreadsheet, another journal you're leaving — CSV is the bridge. A journal importer needs, at minimum: symbol, direction, volume, open time, open price, close time, close price, profit. Stops, commission and swap make the stats sharper but aren't required to start.
The route's failure mode is mapping: importers guess which column is which, and a swapped open/close or a European decimal comma corrupts everything downstream silently. Import ten trades first, check them against the platform, then do the rest.

Route 3 — auto-sync via the investor password
MetaTrader's investor password grants read-only access (no trading, no withdrawals), and sync-capable journals use it to pull trades automatically. Setup is one form: server, login, investor password. From there closed trades appear on their own.
Honesty first, since we sell one of these: TradeLens Cloud syncs closed trades only through this route, and the $47 download edition has no live connection at all — it imports Routes 1 and 2. Some competitors sync open positions too; we've said plainly where theirs is stronger. Whatever tool you use: supply the investor password, never the master, and rotate it if you ever stop using the service.
The four checks that keep imported data honest
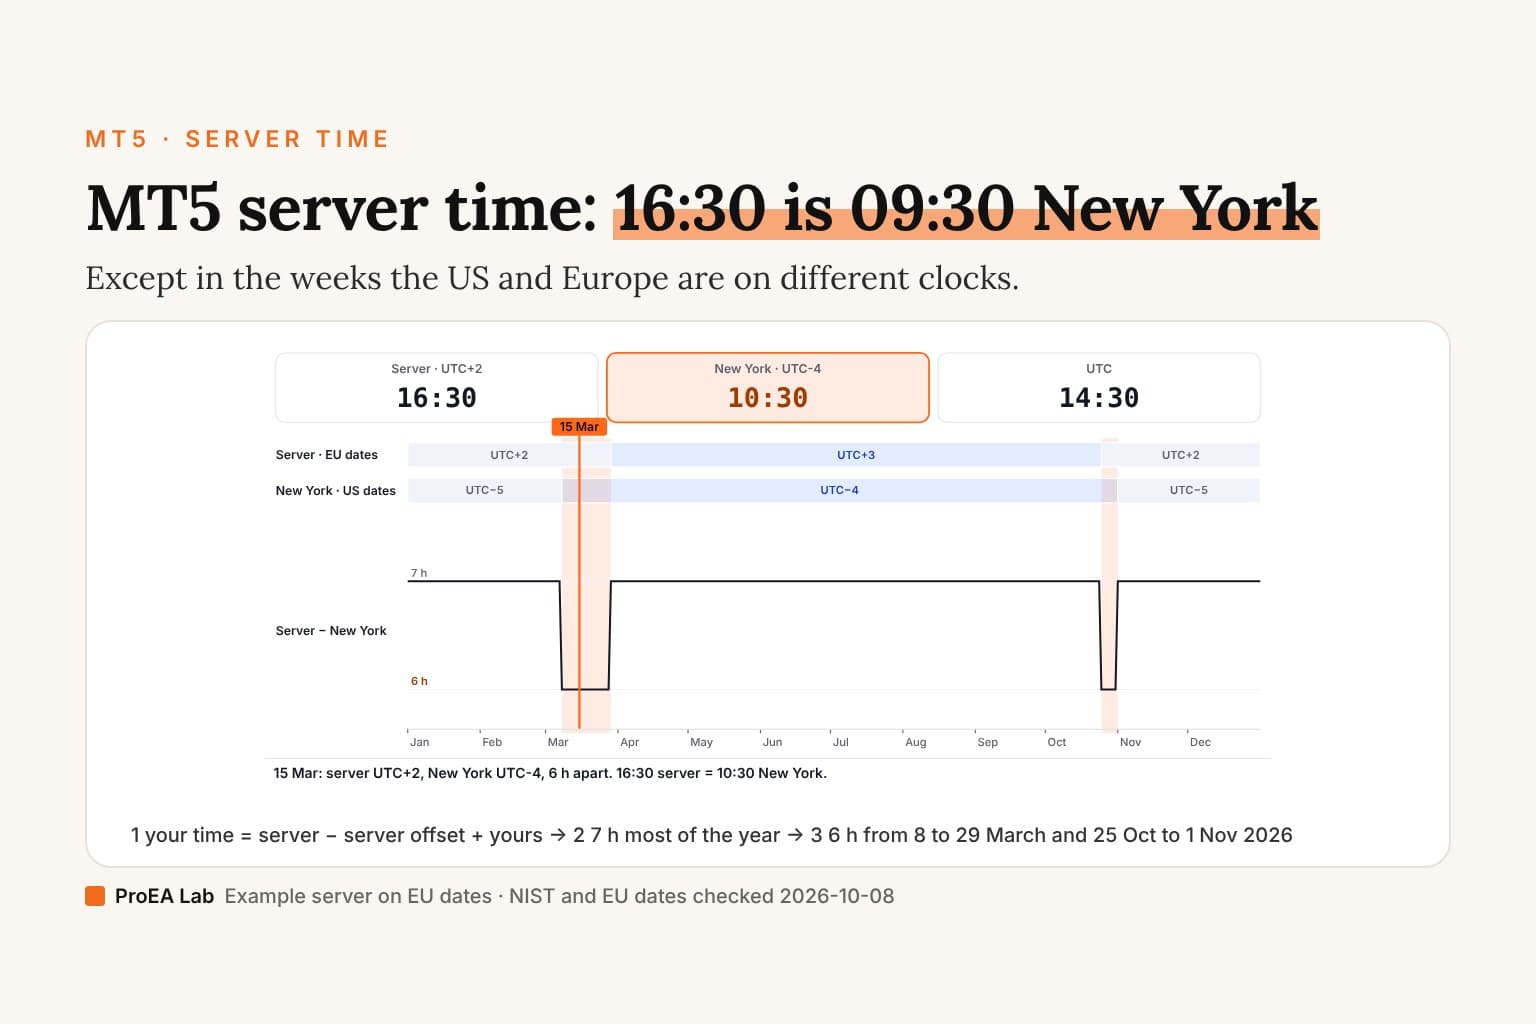
Timezone. MetaTrader stamps trades in server time, which is rarely your wall clock. If your journal's session stats look shifted — London wins appearing as Asia wins — the import's timezone offset is wrong. Fix it before reading any time-of-day statistic (how to find your server's offset).
Partial closes. One position closed in three pieces arrives as three rows. Decide once whether your journal should merge them into one trade or count three, and confirm the importer did what you chose — it's the difference between a 40% and a 55% win rate on the same trading.
Non-trade rows. Statements include deposits, withdrawals and balance adjustments. A good importer skips them; a naive one books your $500 deposit as a winning trade. Scan the first import for rows with no symbol.
Duplicates. Re-importing an overlapping period should update, not double. Import the same file twice as a test — if your trade count doubles, the tool has no dedupe and every future import needs exact, non-overlapping ranges.
Check what survives the export
Before committing a full history, run the journal portability acceptance kit in an empty test workspace. It includes three fabricated trade rows, two declared position groups, a separate cash ledger and a notes/attachment sidecar. The ownership guide records our own field-level check, including known losses and untested operations.
- Import the UTC-normalized fixture, or map the original offset timestamps if supported. The first opening is 23:55 at +02:00, which is 21:55 UTC. Changing the clock display may be valid; changing the instant is not. Never strip an offset without converting it.
- Reconcile the expected figures: three trade rows, USD −2 net trading P/L after recorded costs, separate cash net USD 75, and USD 1,073 ending balance from USD 1,000. Do not import deposits as winning trades or assume the two partial exits were grouped automatically.
- Where the product supports it, add the note, planned risk, tags and attachment reference from the manifest. Record fields you cannot add. This sidecar is a checklist, not a supported analyzer or vendor import format.
- Export the complete test scope, restore it into a second empty workspace and compare each field. Also test a duplicate import in the same disposable workspace. Use the acceptance worksheet; mark untested steps instead of filling them with assumptions.
The free MT5 report analyzer handles supported postings, with a different CSV schema. It does not ingest this journal fixture's notes, attachments or grouping metadata. Keep original reports and separate annotation exports even when financial rows reconcile.
Then make the data earn its keep
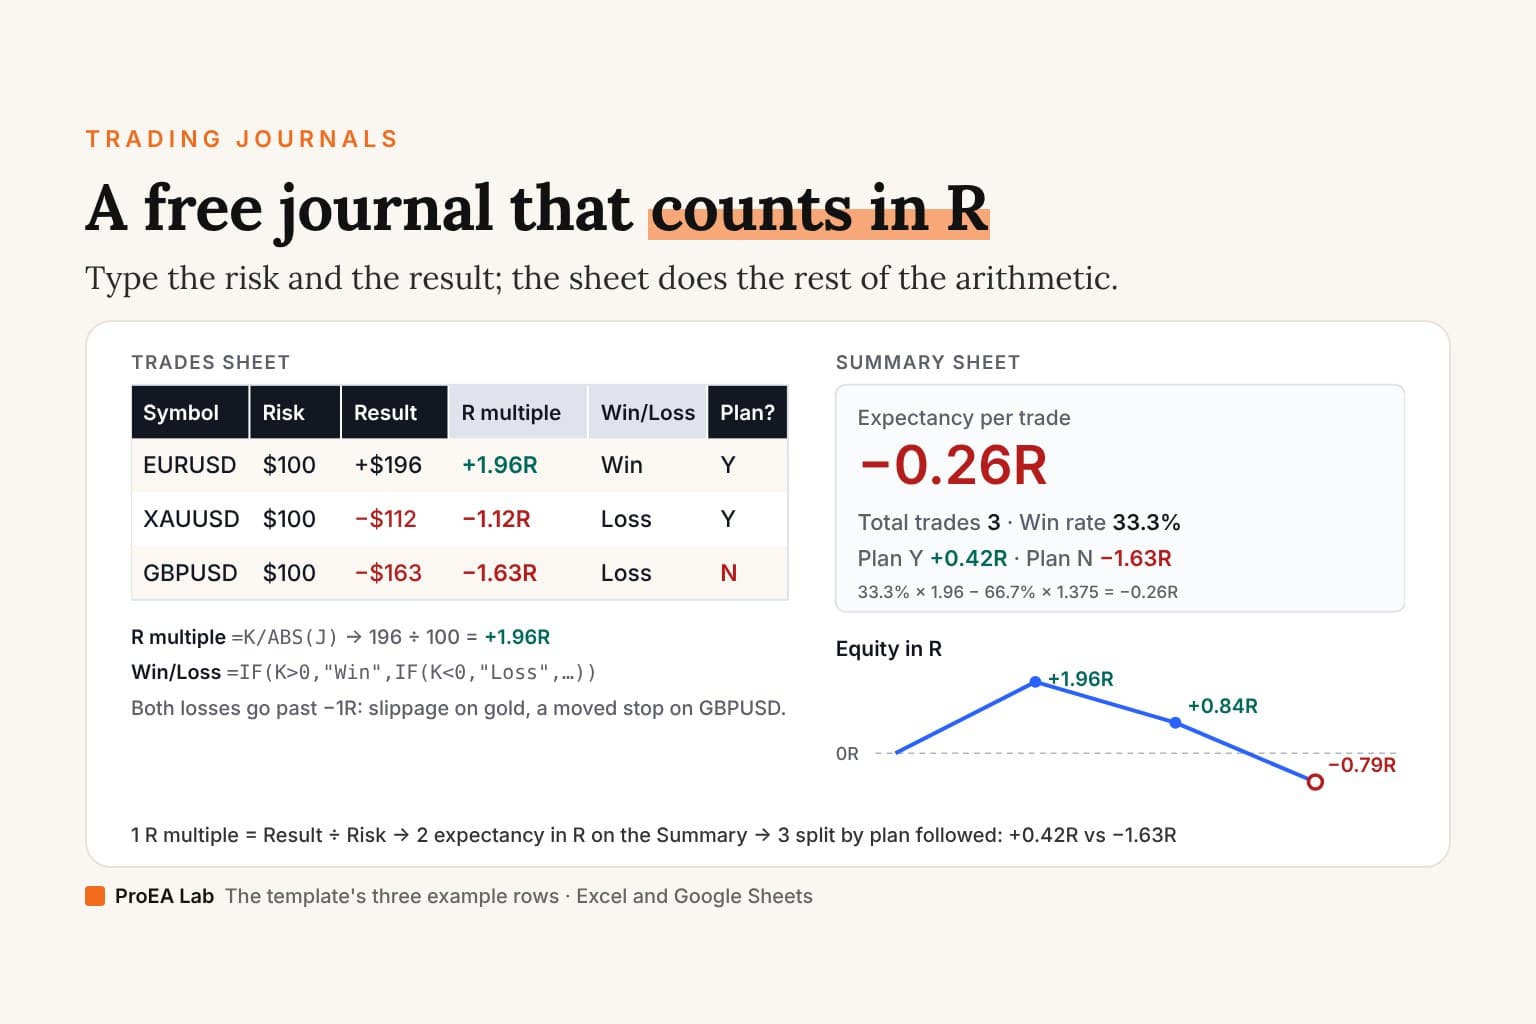
Import is plumbing. The return comes from what the journal computes once the rows are in: R multiples instead of dollars, session and setup breakdowns, the leaks that memory smooths over. Run the four checks once, set the cadence, and the dataset stays honest for as long as you trade.
A journal is only as truthful as its import. Verify ten trades once, and every statistic after that inherits the trust.