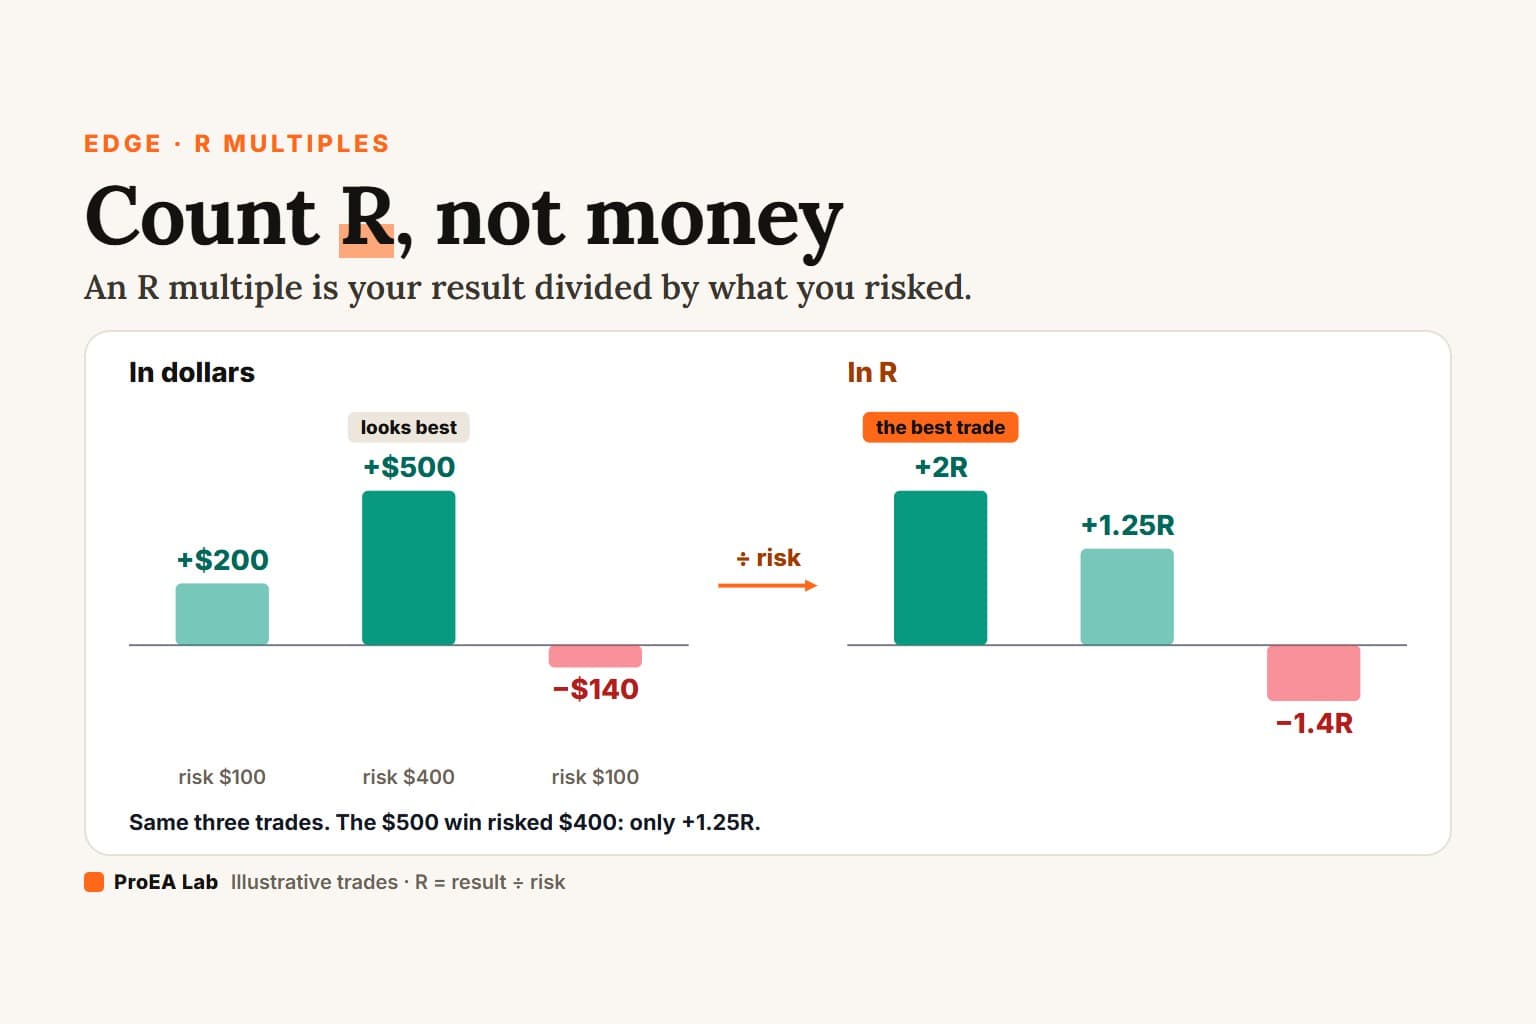
An R multiple is your trade result divided by what you risked: risk $100, make $180, that's +1.8 R. It is the only unit that makes trades of different sizes comparable — and once you count in R, most "great weeks" change their story.
A trader told me he was having a great week.
"Up $340." Then the second line came out, even louder: "70% win rate." He said it like he'd just shown me a passport to professional trading.
So I asked one question — does your system actually have an edge? — and the smile disappeared.
Not because the answer was bad.
Because he didn't know.
He knew the dollars. He knew the win rate. He knew how the week felt. But he couldn't tell whether the thing he was doing had a positive edge, because the two numbers he was proud of are exactly the two that hide it. Dollars hide the method; win rate hides the size — and together they can make a losing system look clean, confident, and screenshot-ready.
Ask a professional the same question and the answer sounds different. Not "I'm up $340," not "I win 70%," but something like "the system is averaging +0.38R per trade over 240 trades." That trader knows what they have. Same markets, same uncertainty, same pain — but one is guessing and one is measuring, and the whole difference is the unit they chose.
That unit is R, and R just means risk: the amount you risked on the trade. If you risk $100, then 1R = $100 — make $200 and the trade is +2R, lose the $100 and it's −1R, make $50 and it's +0.5R, lose $150 and it's −1.5R (and also a quiet sign your stop-loss needs adult supervision). Score every trade that way and the fog clears: trades become comparable across account sizes, systems, and months, and you can finally answer the question dollars and win rate avoid — on average, how much do I make for every unit of risk I take? That number is expectancy, and if you trade anything that claims an edge, it's the number you need.
Two requests before we start:
- Save this and relabel your last 20–50 trades in R before your next session.
- Send it to the trader who quotes their win rate like it's a credit score. It isn't telling them what they think it is.
a practical expectancy band for many real systems — useful, not a law of physics.
operating benchmark ↗a more credible sample for judging expectancy; under ~30 trades, treat the number as noise.
sample-size discipline ↗The one-sentence version
You can't know whether your trading has an edge if you measure it in the wrong unit. Dollars tell you what happened to the account; win rate tells you how often you were right; neither tells you whether the system is mathematically worth trading. R does. Convert every trade into a multiple of what it risked, average those multiples, and you get expectancy in R — the cleanest answer to "does this make money per unit of risk?" Positive means the system makes money over many trades; negative means it loses; a high win rate can't save a negative expectancy, and a single bad week can't invalidate a positive one. That's why serious traders count R — not because it sounds clever, but because it removes the noise.
I — Dollars are a terrible unit
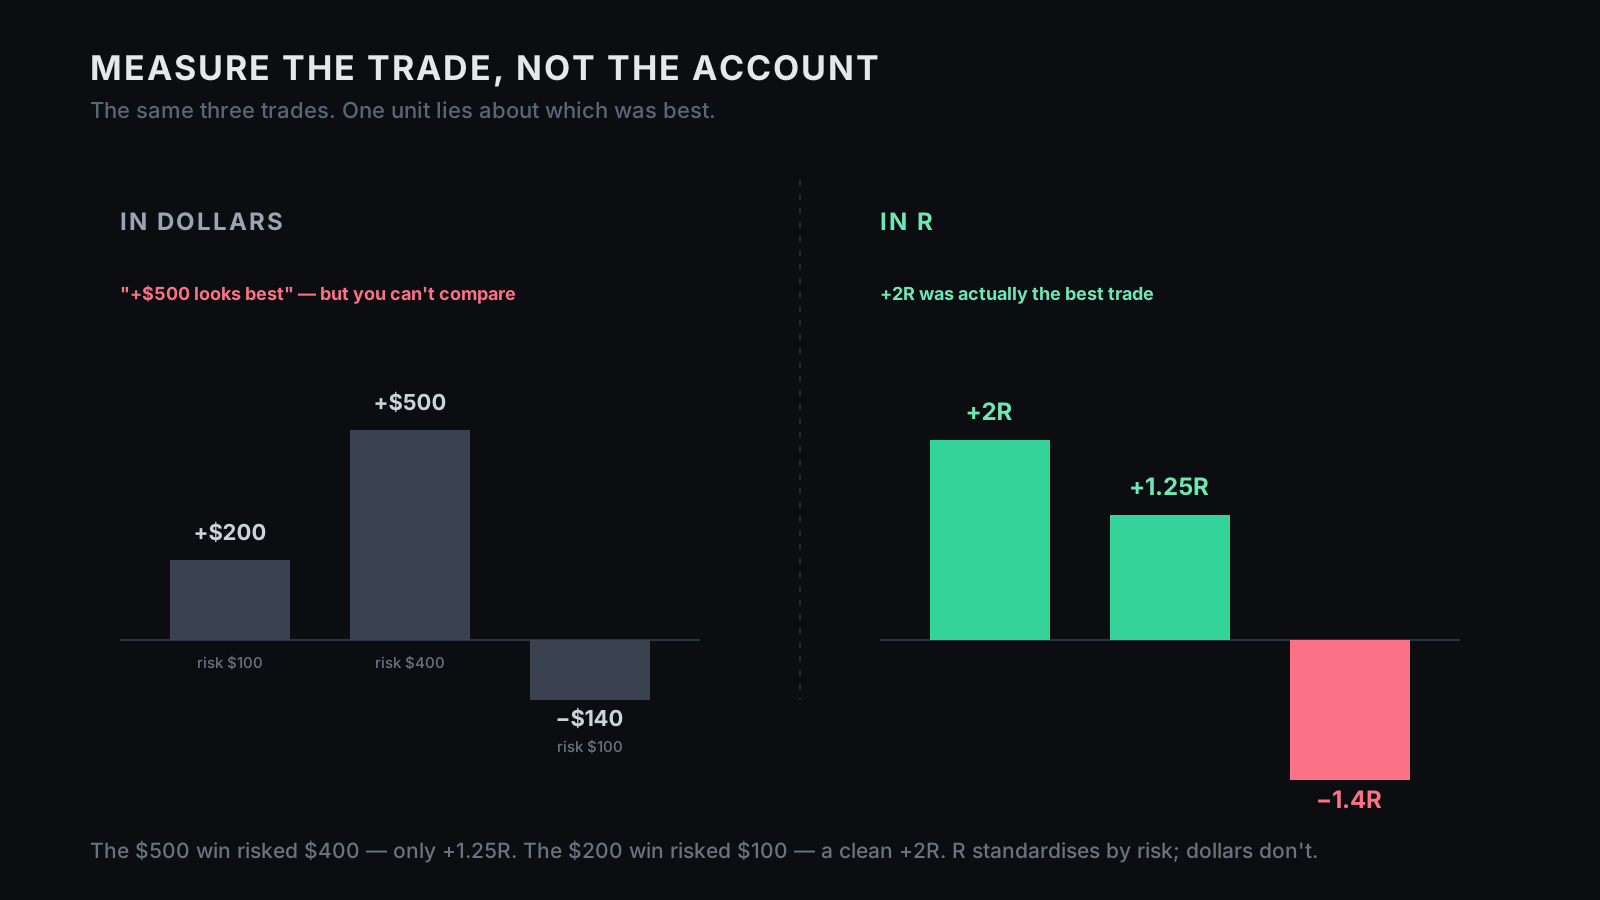
Dollars feel like the obvious scoreboard: green number good, red number bad, brain understands. Very primitive, very satisfying, very dangerous — because a dollar figure blends four completely different things into one noisy number: the size of your account, the size you bet, the luck of the recent trades, and the actual edge. "I made $340" tells you almost nothing: was it a $1,000 account or a $100,000 one? Did you risk $50 or $2,000? One lucky trade or forty disciplined ones? The dollar amount hides all of it, so a $200 win can be excellent, meaningless, or reckless and look identical.
Dollars are also useless for learning. A +$500 trade in January and a +$500 in July might be totally different quality — different account size, different lot size, different stop distance — so when you study your journal in dollars you're not comparing like with like; you're reviewing through a dirty window. Dollars measure your account balance. They do not measure your trading — and the two are not the same thing.
II — Win rate hides the size
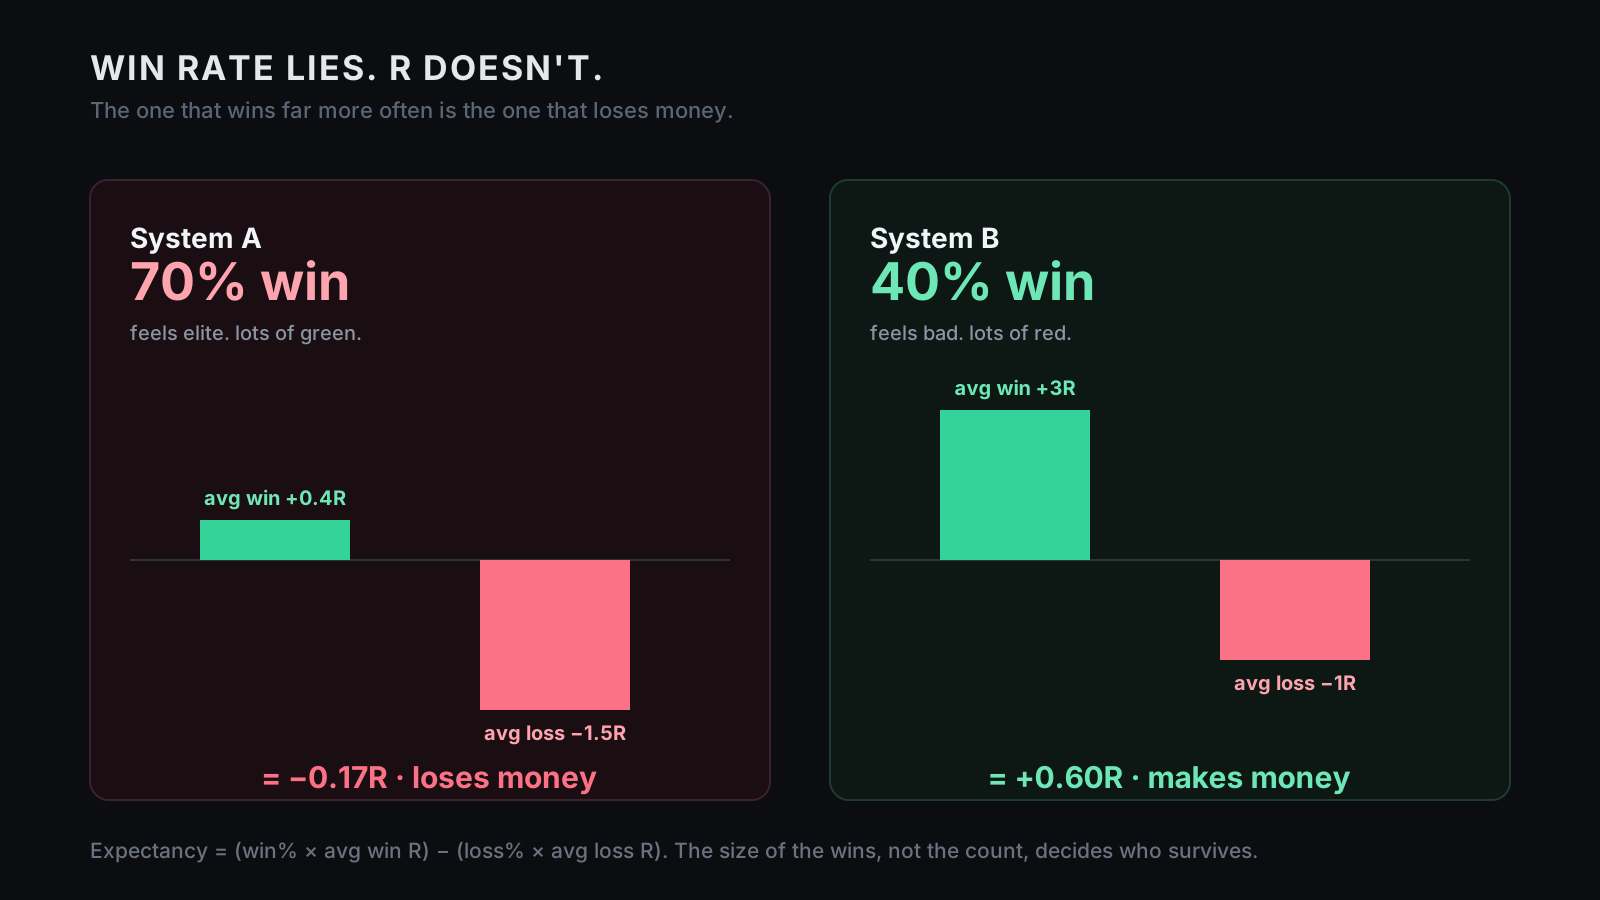
So traders switch to win rate, which feels smarter and isn't smart enough — because win rate counts how often you win and says nothing about how much. That missing half is everything. A 70% win rate can lose money steadily if the wins are small and the losses are large; a 40% win rate can compound beautifully if the winners are big and the losers are cut short.
System A          win 70%   ·  avg win +0.4R  ·  avg loss −1.5R   →  loses money
System B          win 40%   ·  avg win +3R    ·  avg loss −1R     →  makes money
System A feels great — lots of small green trades that make your journal look like it has its life together — and bleeds out, because the losses are too big. System B feels uncomfortable — more losers, more patience, more "maybe I'm terrible at this" — and pays for the losers and then some. That's the trap behind every "90% win rate" screenshot: the number easiest to feel good about is the one most disconnected from whether you make money (the whole case in why win rate is a vanity metric). Win rate asks how often you're right. Expectancy asks whether being right is worth more than being wrong — and only one of those questions matters.
III — Meet R
R is the amount you risked on a trade. That's it — no mysticism, no quant costume, no saying "probabilistic framework" while staring into the distance. If your stop-loss defines a $100 loss, then 1R = $100, and you score the result as a multiple of that:
risk $100 (= 1R)
   win $200   →  +2R
   win $50    →  +0.5R
   stop out   →  −1R
   lose $150  →  −1.5R   (a confession, not just a number)
The beauty is that every trade is now on the same scale regardless of account or position size, so a +2R in January and a +2R in July mean the same thing — you made twice what you risked — and a −1R means the system lost exactly what it was allowed to. Once every trade becomes an R-multiple, your journal stops being a money diary and becomes a system measurement — you can finally see whether your winners are big enough, whether your losses are controlled, and whether your "edge" is just one oversized lucky trade wearing a crown.
IV — Expectancy
Once trades are in R, expectancy is just the average R per trade — line them up, add, divide by the count:
Trades (R):  −1, −1, +3, +2, −1, +2, −1, +3, −1, +0.5
Sum = +5.5R   ÷ 10 trades   =   +0.55R expectancy per trade
That means this sample made, on average, 0.55× its risk per trade — about $55/trade if you risk $100, about $550 if you risk $1,000. Same system quality, different account scale; that's why R is clean. You can also build it from win rate and average sizes:
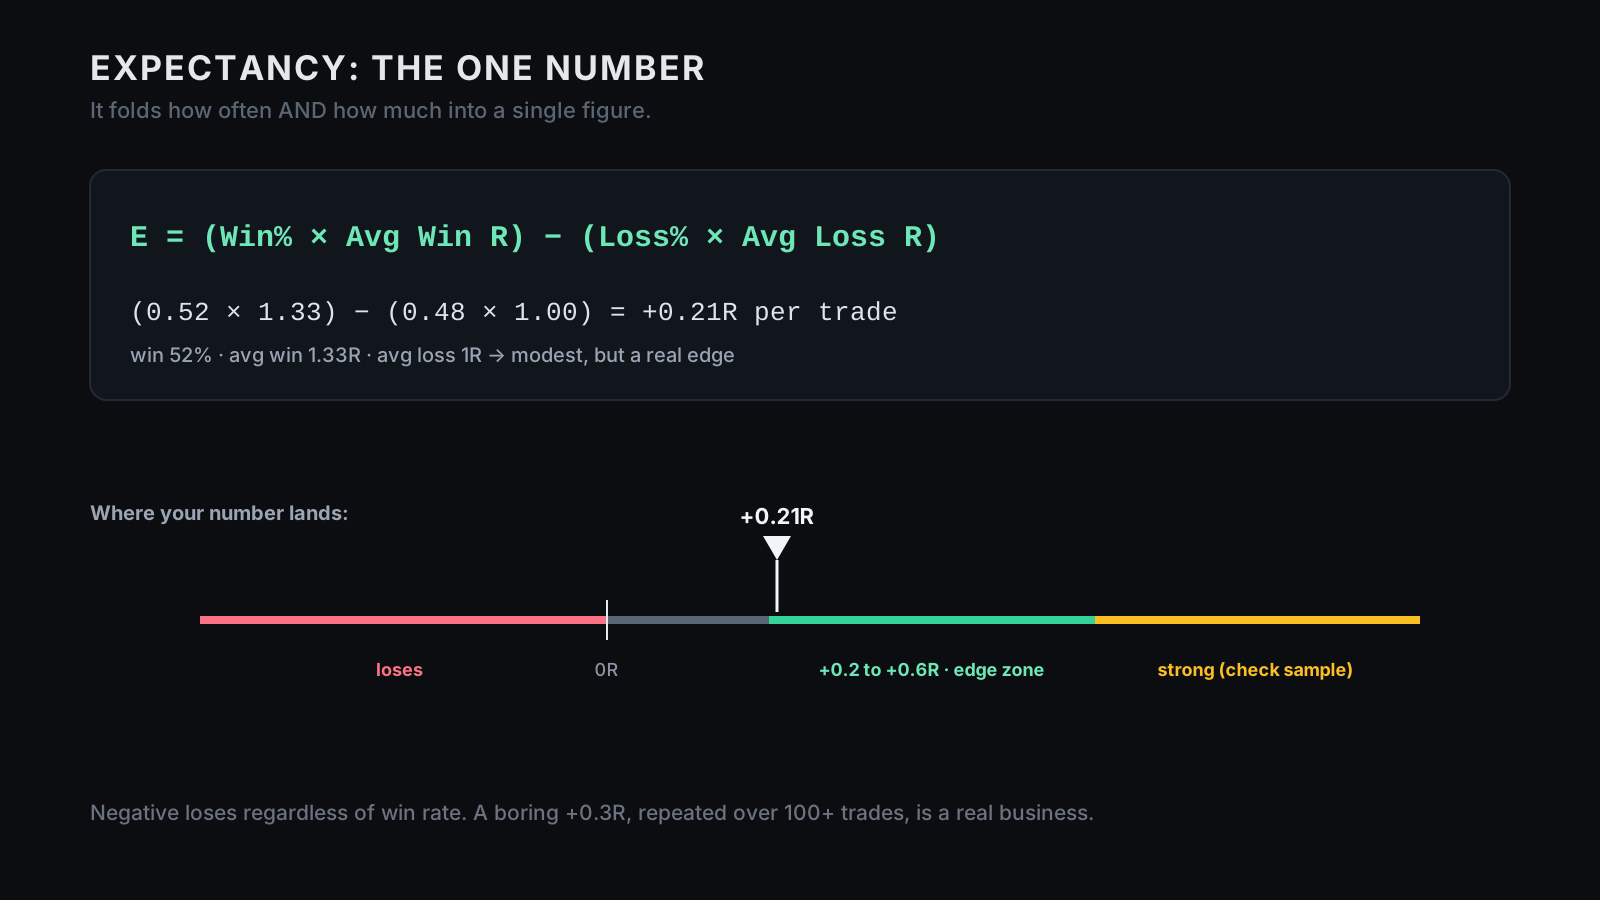
Expectancy = (Win% × Avg Win in R) − (Loss% × Avg Loss in R)

  win 52%, avg win +1.33R, avg loss −1R:
  (0.52 × 1.33) − (0.48 × 1.00) = 0.692 − 0.48 = +0.21R per trade
Not flashy, not "quit your job and buy a neon Lamborghini" — but positive, real, and measurable, and if it holds across a large enough sample, that's an edge. Dollars tell you what happened; win rate tells you how often you felt correct; expectancy tells you whether the machine works.
V — What "good" actually looks like
Once people learn expectancy they immediately want a scoreboard — and trading already has enough people with spreadsheet confidence and casino behaviour, so hold the genius part. A practical operating lens:
negative          →  losing system
~0R               →  breakeven before costs
+0.1R             →  fragile, needs caution
+0.2R to +0.6R    →  a workable edge zone
> +0.5R sustained →  very strong
> +1R sustained   →  rare — inspect for tiny sample, overfit, or one-trade dependency
This band is a sanity lens, not a law of nature. A boring +0.25R repeated across hundreds of trades is a real business; a wild +2R over 12 trades is a lucky weekend in sunglasses — and that's the part that humbles everyone. Expectancy from 10 trades is a rumour, from 30 it's a hint, and it doesn't start to mean something until you're past 100, because below ~30 the math happily flatters pure luck:
under 30 trades   →  don't believe the number
30–100 trades     →  treat it as preliminary
100+ trades       →  start listening — but still check regime, costs, robustness
Even then, trade count is necessary, not sufficient: were they all one regime, one month, one of 400 tested variations kept because it looked best, with realistic costs? (Same sample-size truth behind why you don't need a better strategy.) A positive expectancy on a tiny sample isn't an edge — it's a flirtation. Make it earn your trust over 100+ trades before you believe it.
VI — SQN
Expectancy is the average — but two systems with the same average can feel completely different to trade: one delivers a steady +0.3R, the other swings between +5R and −1R like a mechanical bull in a dark room. Van Tharp's System Quality Number (SQN) captures that, by combining three things — your average R, how spread out your R-multiples are, and how many trades you have:
SQN = ( Average R ÷ Std-Dev of R-multiples ) × √(Number of trades)
It rewards higher expectancy, penalises chaotic distributions, and adjusts for sample size — so a quiet +0.35R over 300 trades can score better than a loud +0.8R over 12, because small samples are charming little liars. A rough reading lens runs "below 2 weak · 2–3 good · above 3 strong" — but don't worship the bands; SQN is a filter, not a prophecy, and it only means anything past 100+ trades. Expectancy tells you if the edge exists; SQN tells you whether it's consistent enough — and has enough evidence — to actually sit through. A system can be positive and still be miserable to trade if it only pays through rare giant wins and long painful stretches — and you want to know that before you size it, simulate it, or trust it with real money.
VII — R is the language of the whole system
Step back and the real payoff appears: R isn't just a measurement, it's the common language that makes the rest of risk management speak to each other. When you size a position, you're literally defining 1R. When you Monte-Carlo your drawdowns, the clean input is a list of R-multiples (−1R, +2R, −0.5R, +3R), so the drawdown distribution is tied to the system, not the random account size you happened to test. When you write a stop sheet, "pause if I lose 6R this week" survives account growth, position-size changes, and different markets in a way "$2,000" never will.
That's the upgrade. Dollars make every part of the system speak a different language; R makes sizing, expectancy, drawdown, simulation, and stop rules all speak the same one — and your journal turns from a mood diary into a lab notebook. That's when you can finally improve the machine instead of just feeling your way through it.
The 5-minute version
Do this now, on trades you've already made.
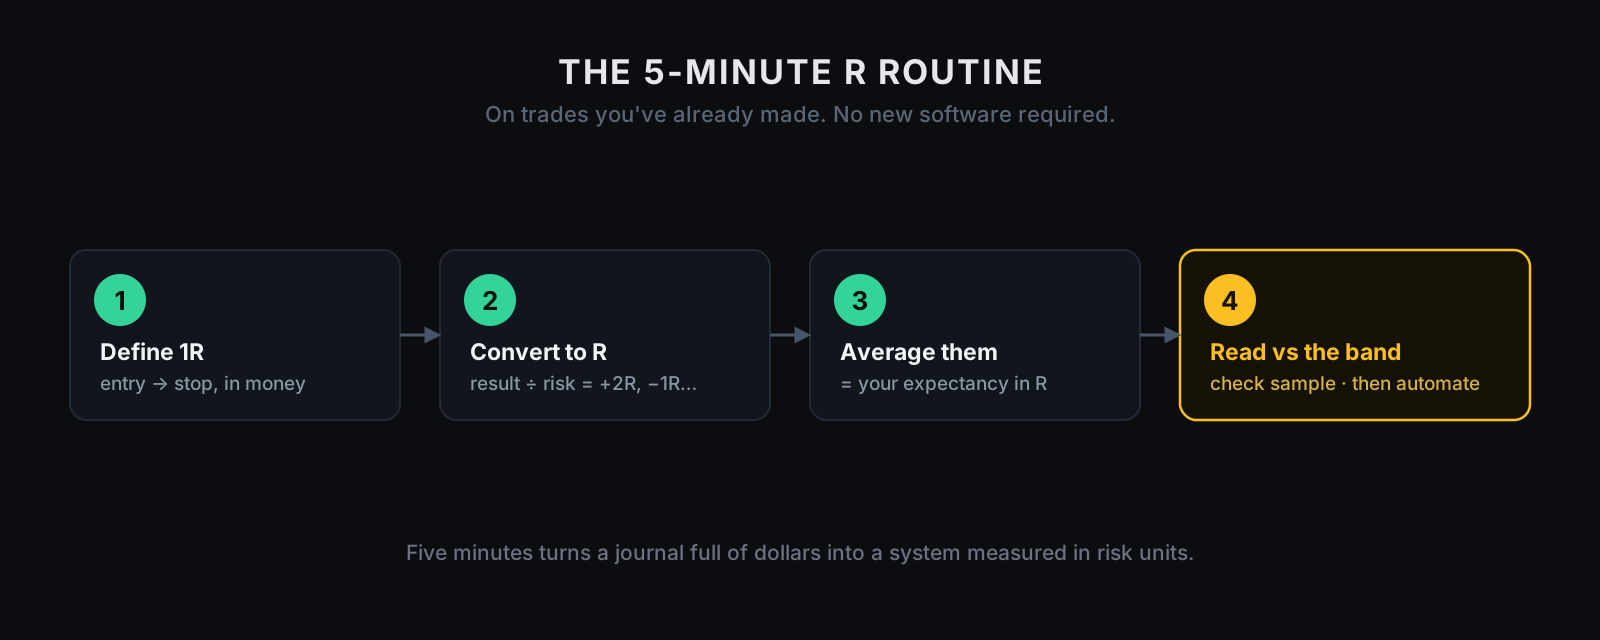
Minute 1 · Find 1R for each trade. For your last 20–50 trades, note what you risked — entry to stop, in money. That's that trade's R.
Minute 2 · Convert results to R-multiples. Divide each profit or loss by its R: a $250 win on $100 risk is +2.5R; a −$60 loss is −0.6R; a −$140 loss is −1.4R (and deserves a review, not shame).
Minute 3 · Average them. Add all the R-multiples and divide by the count — that single number is your expectancy (e.g. the list above → +0.55R). Small sample, but now you're at least measuring the right thing.
Minute 4 · Read it against the band and the sample. Negative = the system loses regardless of win rate; +0.2 to +0.6R = a workable edge; anything wildly higher on a small sample is almost certainly luck. Under ~30 trades, treat it as a rumour; 100+, start trusting it.
Minute 5 · Automate it forever. Hand the whole calculation to AI so you never do it by hand again:
Here's my trade history (each row: entry, stop, exit, size, P&L, direction, date).
1. Compute 1R for each trade and convert each result to an R-multiple.
2. Output: total trades, win rate, avg win in R, avg loss in R, expectancy in R,
   std-dev of R, SQN, longest losing streak, largest R win, largest R loss.
3. Flag if: sample < 30 or < 100; expectancy positive but driven by one outlier;
   avg loss worse than −1R; or win rate looks good while expectancy is negative.
4. Verdict: early evidence of edge, no evidence, or needs more trades.
That's AI used the right way — not a signal god, not a forecaster, just an accountant with no emotional attachment to your excuses (the same build-it-yourself workflow, pointed at the one number that tells the truth).
Where this meets ProEA
This is also the honest way to read anyone's track record, including ours. A win-rate headline is the easiest thing in the world to show and the least informative; a smooth equity curve is easy to admire; a big dollar number is easy to screenshot — but expectancy in R, over a real sample, after costs, is the number that's hard to fake emotionally and actually says something. So we ship a 28-month backtest as a trade-level grid, not a feel-good win-rate number, precisely so you can convert it to R, average it, inspect the distribution, and see whether the edge comes from many small wins or one suspicious miracle trade in a fake moustache. Marketing gives you a number to admire. Evidence gives you trades to measure — so measure ours.
And the caveat, stated plainly because honesty is the brand: a positive expectancy in a backtest is not a promise of one in your future — edges decay, your broker's costs differ, regimes change, and a real sample can still disappoint. Expectancy in R is the right way to measure an edge; it is proof of method, not proof of profit. But it's the difference between a seller who hands you a number and one who hands you the trades.
Disclosure
We sell source and evidence you can inspect — not outcomes, not guarantees. R-multiples, expectancy, and SQN are measurement tools: they describe a sample of trades, they do not predict the future. A positive historical expectancy can still be followed by losses; a high SQN can still fail live; edges decay, costs vary, regimes change, and past performance is not future performance. The point isn't certainty — it's measurement.
Your first 20 minutes
Don't take our word for it — go measure something real.
Minutes 0–5 · Relabel your trades. Take your last 30+ trades and convert each to an R-multiple. Don't judge yet — just translate, and notice how much clearer they are than the dollars.
Minutes 5–10 · Compute your expectancy. Average the R-multiples. That number — not your win rate, not your P&L — is the first honest look you've had at your edge.
Minutes 10–15 · Check the shape. Look at your average win and loss in R, your largest win and loss, and whether one outlier is carrying everything. This is where the system starts confessing.
Minutes 15–20 · Measure MTR the same way, then build the calculator. Pull the published 28-month grid, convert it to R, and compute its expectancy yourself — then hand the AI prompt your own history so expectancy and SQN are one paste away, forever.
One last thing
Most traders can't answer "do you have an edge?" — not because they're bad at trading, but because they've been keeping score in a unit that can't answer the question. Dollars tell you about the account. Win rate tells you about your ego. R tells you about the trade; expectancy tells you about the system; SQN tells you whether that system's edge is consistent enough to deserve your attention.
That's the progression, and it starts with one switch. Stop counting money. Count R — average it, earn it over a real sample, and for the first time you'll be able to say what your edge is worth per unit of risk, with a number instead of a feeling. Trading gets much cleaner when the number finally speaks.