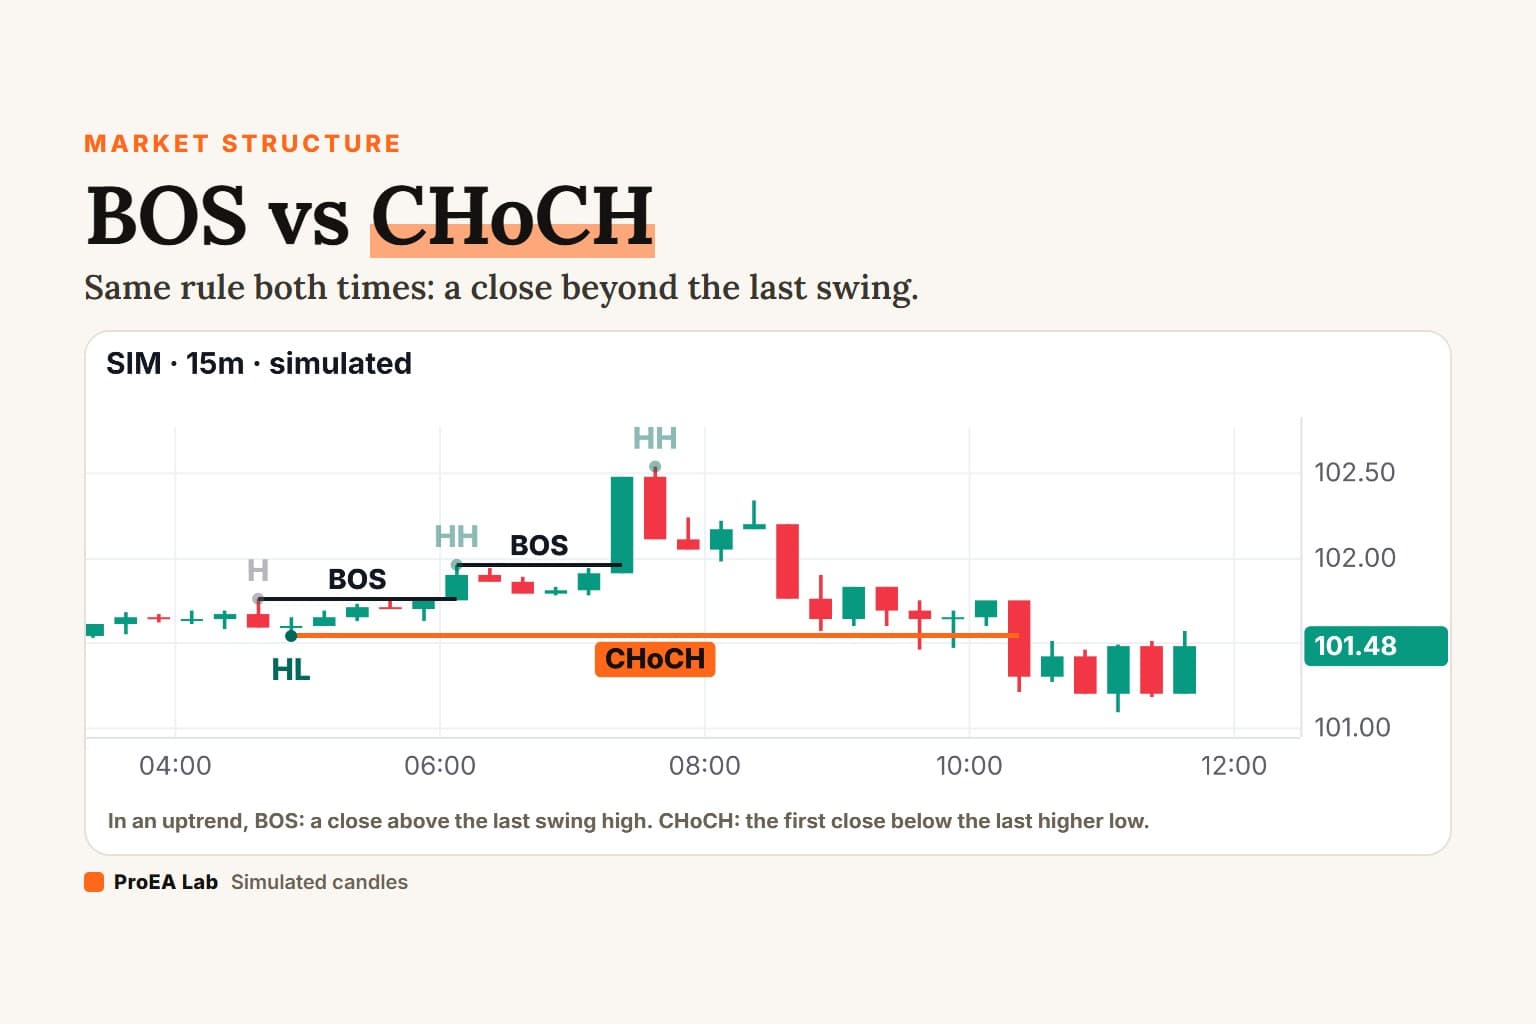
Premium and discount split a dealing range at its 50% line, called equilibrium. Above the line is premium: price is high for that range. Below it is discount: price is low. In a bullish range, buys are looked for in discount. In a bearish range, sells are looked for in premium.
The line is only as good as the range under it. So this page uses one written rule for the range, and every chart below is a replay of simulated candles read by it. It builds on BOS vs CHoCH.
What is premium and discount?
Two halves of one leg. Take the leg that last broke structure, from where it started to how far it has gone. Its midpoint is equilibrium. The upper half is premium, the lower half discount.
Simulated 15-minute candles, not market data. Swings are confirmed by 3 candles on each side; the range is this article's rule, the leg that made the last break.
Read as text
- A candle closes above the last swing high at 99.28: a CHoCH. The leg that did it started at the last swing low, 98.58.
- From that close, the dealing range runs from 98.58 to the furthest price since the break. Its midpoint is equilibrium, the 50% line.
- Each new high moves the range's far end, and the 50% line moves with it.
- The leg's high at 100.10 is confirmed as a swing high 3 candles after it printed. The range is now 98.58 to 100.10, equilibrium 99.34.
- Above 99.34 is premium, below it is discount. In this bullish range, buys are looked for in discount.
How this window was chosen: The first 15-minute window of the simulated market in which a close above the last swing high starts a bullish range whose origin, the last swing low, is the lowest price between that low and the break; the leg makes a new high at least 2 candles after the break; the range is at least 4 average candles tall; and its top is confirmed as a swing high before any break replaces it.
Use itDraw the range from the leg that broke structure, then split it at 50%. Above = premium, below = discount.
Watch outA range drawn from whatever high and low look right gives whatever answer you wanted. Fix the rule first.
How do you draw the dealing range?
From the last break of structure. This is the rule every film uses:
The dealing range
1. Find the last break of structure: a close beyond the last confirmed swing.
2. Close above a swing high: the range runs from the last confirmed
   swing low up to the highest high since that close.
   Close below a swing low: from the last confirmed swing high
   down to the lowest low since.
3. Equilibrium = (range high + range low) / 2.
4. Above equilibrium = premium. Below = discount.
5. A new extreme moves the far end, and the 50% line with it.
   The next break of structure, either way, replaces the range.
Swings here are confirmed 3 candles a side. Every new high stretches the range, so the 50% line climbs with it. A close above the leg's confirmed high is the next break, and that replaces the range.
No break, no range.Why buy in discount and sell in premium?
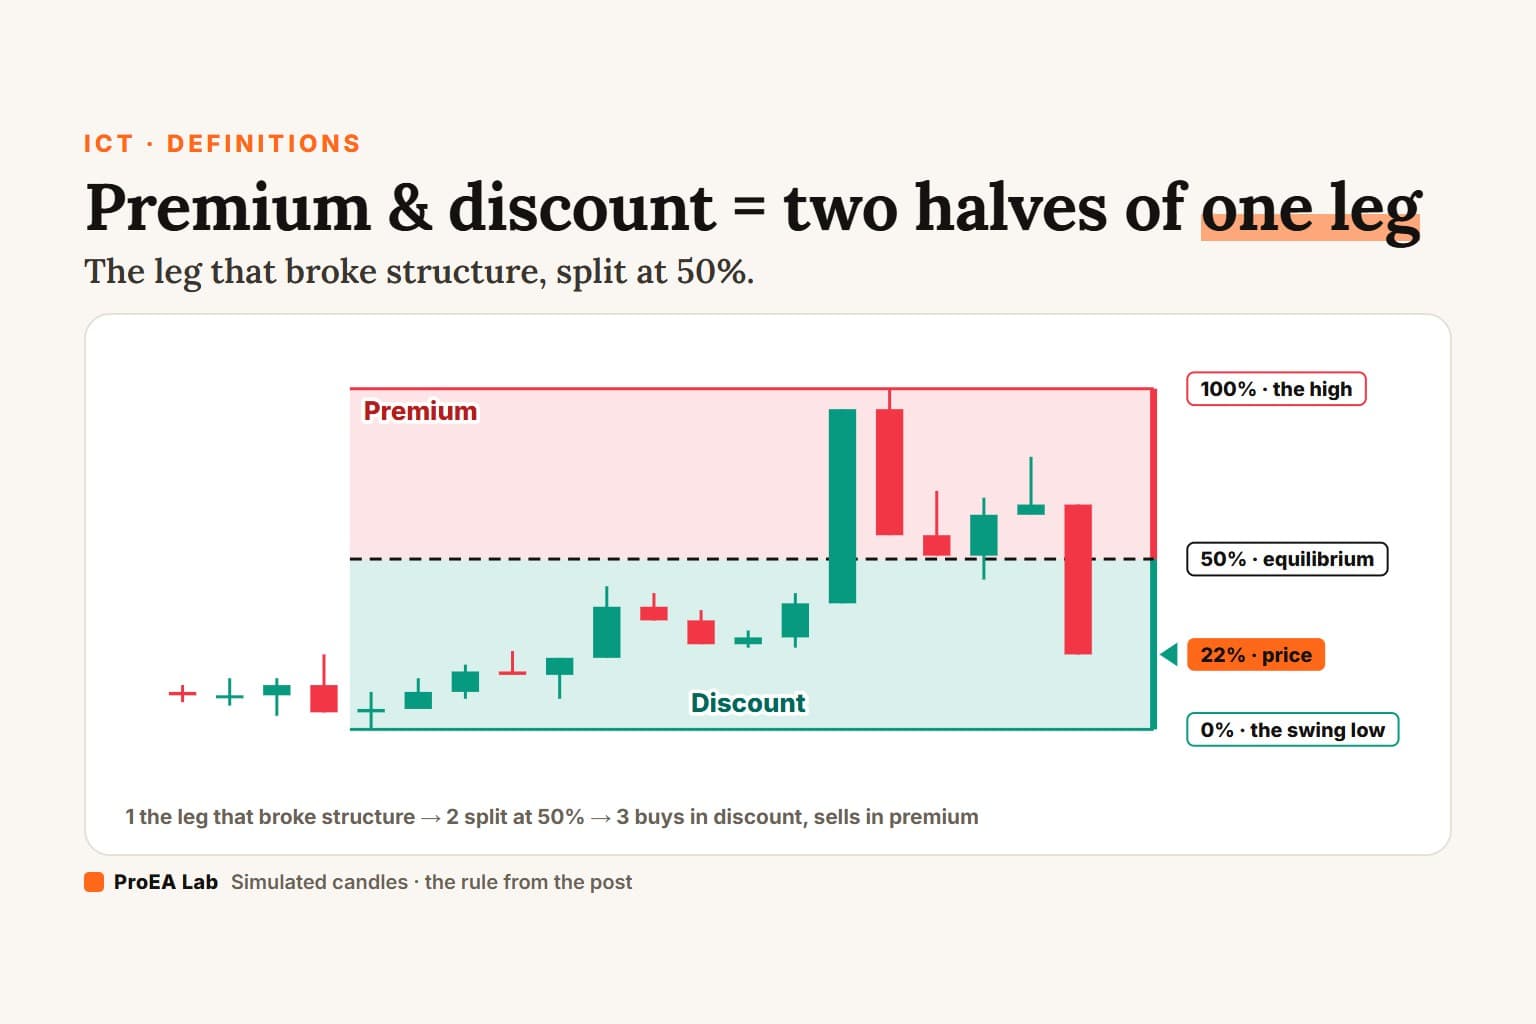
Geometry, not odds. In a bullish range your stop goes below the range's low and your first target is its high. Close to the low, the stop is near and the target far. At the high, it's the other way round.
Simulated 15-minute candles, not market data. Swings are confirmed by 3 candles on each side; the range is this article's rule, the leg that made the last break. The percentages are distances inside the range, not odds.
Read as text
- A close above the swing high at 101.96 (a BOS) starts a bullish range from the swing low at 101.54.
- The candle that breaks out closes at 102.48, 100% of the range it starts: deep in premium. Joining the move on that close puts a stop beyond 101.54 100% of the range away, with no room yet to the high.
- The high is confirmed 3 candles later. The range is 101.54 to 102.54, equilibrium 102.04.
- A close at 101.76 sits at 22% of the range: 22% of it lies between price and the low, 78% between price and the high. With a stop beyond the low and the high as a first target, the target is 3.5 times as far as the stop. That's geometry, not a forecast.
- The film ends 6 candles later, wherever price is.
How this window was chosen: The first window in which a bullish range at least 4 average candles tall has its top confirmed as a swing high, a later candle closes in the lower 40 % of the range without any close below the range's low before it, and the range is still live 6 candles after that close. The film ends there. Each film's window starts after the windows of the films above it, so no two films share candles.
At 25% of the range, the high is 3 times as far as the low. At 75%, a third as far. In the film, the candle that breaks out closes at 100% of the range it starts. Buying that close is buying premium: the whole range is under you, and nothing is left above.
Use itRead the % before you enter: where in the range is price? In a bullish range, below 50%.
Watch outDiscount isn't support. Price can keep falling through the range's low, and then the range is gone.
When does the dealing range change?
At the next break of structure. A new BOS the same way draws a new range from the latest higher low, and the 50% line jumps with it. A CHoCH flips it: after a close below the last swing low, the range runs from the last swing high down, and sells are looked for in premium.
Simulated 15-minute candles, not market data. Swings are confirmed by 3 candles on each side; the range is this article's rule, the leg that made the last break. The old range stays as a grey outline.
Read as text
- A close above the swing high at 65.87 (a BOS) starts a bullish range from the swing low at 65.66. At its widest it runs to 66.27, equilibrium 65.97.
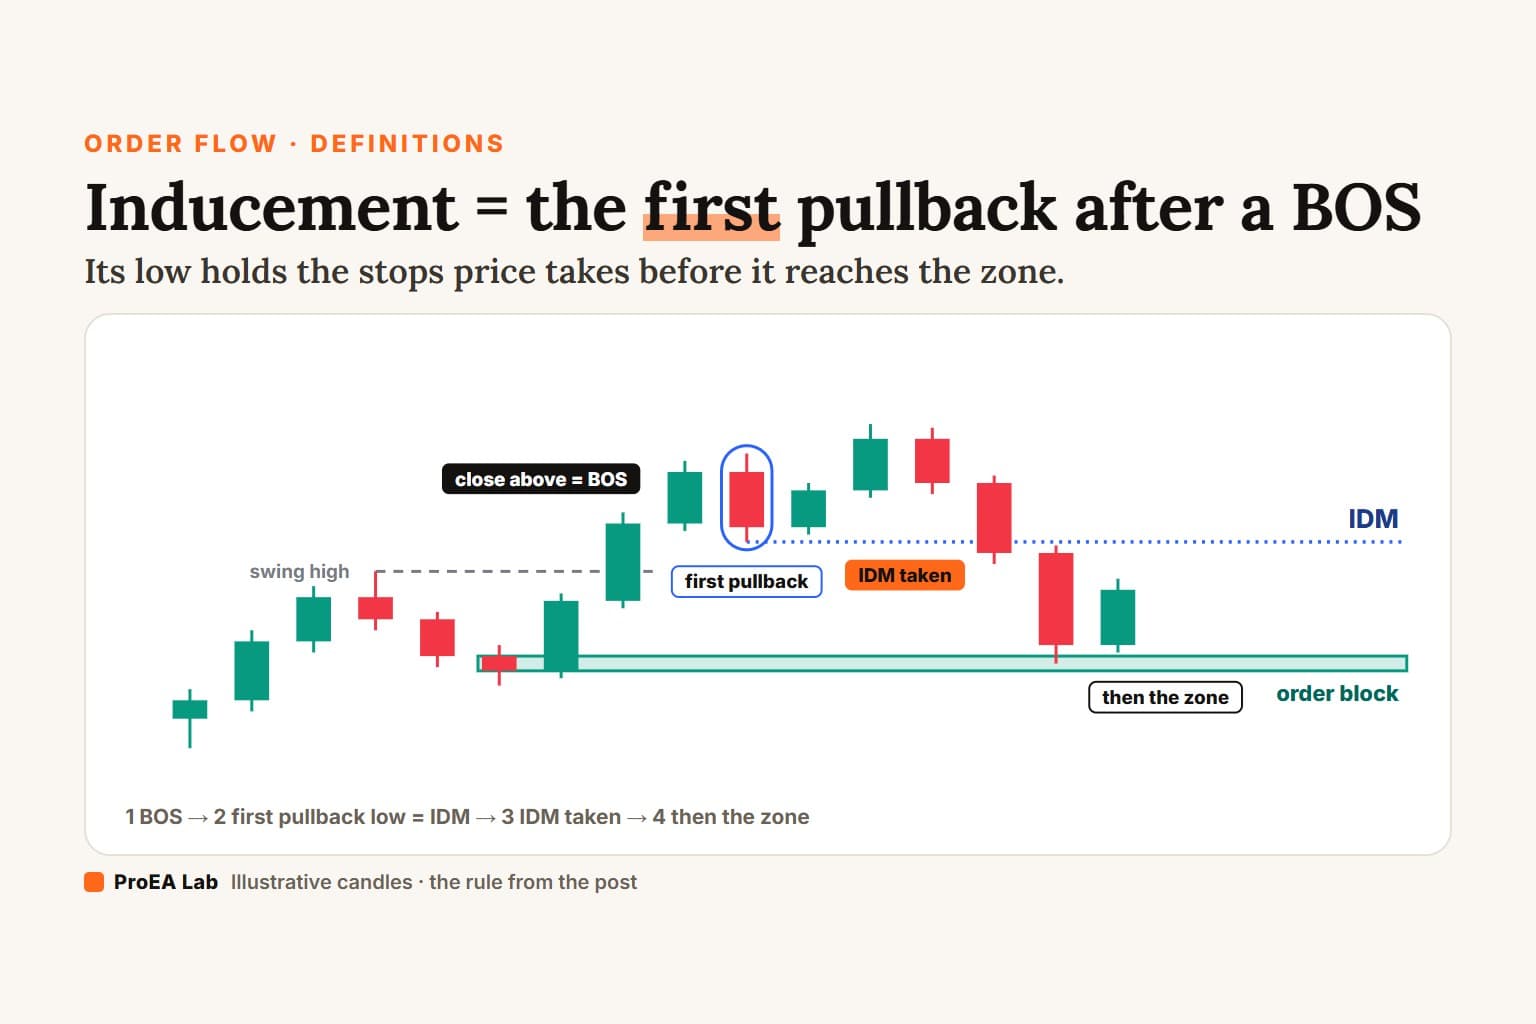
- A higher low at 66.13 is confirmed. Then a candle closes above the top at 66.26: a BOS. That close replaces the range: the new one runs from the higher low at 66.13 to the highest high since.
- By the end of the film the new range is 66.13 to 68.47, equilibrium 67.30. The old one is history.
How this window was chosen: The first window in which a bullish range at least 4 average candles tall is replaced by the next close above a swing high (a BOS), the new range's origin is a higher low inside the old range, and the new leg makes a new high at least 2 candles after its break, grows at least 4 average candles tall and at least half as tall as the old range, and has its top confirmed as a swing high. Each film's window starts after the windows of the films above it, so no two films share candles.
Use itAfter every break, redraw. The range you trade is always the latest leg's.
Watch outAn old range's 50% line is just a line. Using it after a new break mixes two different legs.
Where does OTE sit in premium and discount?
Inside discount, at the deep end. ICT's optimal trade entry (OTE) is a 62% to 79% retracement of the leg, with 70.5% inside it (innercircletrader.net, checked 2026-10-04). Measured from the low of a bullish range, that's 21% to 38% of the way up. All of it is below 50%.
Simulated 15-minute candles, not market data. Swings are confirmed by 3 candles on each side; the range is this article's rule, the leg that made the last break. OTE levels as innercircletrader.net gives them (0.62, 0.705, 0.79).
Read as text
- A close above the swing high at 75.01 (a BOS) starts a bullish range from the swing low at 74.68.
- The leg's high, 75.40, is confirmed 3 candles later. The range is 74.68 to 75.40, equilibrium 75.04.
- ICT's optimal trade entry is a 62% to 79% retracement of the leg, with 70.5% inside it. Here that's 74.95, 74.89 and 74.83.
- Measured from the low, those levels sit at 38%, 29.5% and 21% of the range. The whole band is below 50%: it's the deep part of discount.
- 2 candles after the high is confirmed, a candle trades into the band. The film ends 6 candles later, wherever price is.
How this window was chosen: The first window in which a bullish range at least 4 average candles tall has its top confirmed as a swing high, and a later candle trades into the 62 % to 79 % retracement band without any close below the range's low before it, with the range still live 6 candles after that candle. The film ends there. Each film's window starts after the windows of the films above it, so no two films share candles.
Use itTreat OTE as a narrower part of discount: 0.62 to 0.79 back from the extreme.
Watch outA Fibonacci tool drawn on a different leg gives different levels. Use the same leg as the range.
Premium vs discount
| Premium | Discount | |
|---|---|---|
| Where | above the 50% line | below the 50% line |
| Price is | high for the range | low for the range |
| In a bullish range | a buy here is a chase | buys are looked for here |
| In a bearish range | sells are looked for here | a sell here is a chase |
| Deepest part | OTE of a bearish range (62% to 79% up from the low) | OTE of a bullish range (21% to 38% up from the low) |
Is equilibrium the 50% Fibonacci level?
Yes, of the same leg. The 0.5 retracement of the range is its equilibrium. The difference between pages and tools is which leg they draw it on.
Same words, different ranges
We read the source of each tool below. Same names, four different ranges:
| Tool | Range | Premium | Updates |
|---|---|---|---|
| This page = Location Desk's leg 50% | last swing to the furthest price since the break | above 50% | each break; new extremes stretch it |
| ICT Levels Desk | the previous day's high and low | upper half | each day |
| Location Desk's cloud | high and low of the last 100 candles (5- and 15-minute layers) | top 25% | every candle |
| LuxAlgo SMC | its last 50-bar swings, pushed out by new extremes | top 5% | each new swing |
Pick one, and know which one your tool draws.
How to use premium and discount, step by step
- Fix the timeframe and the swing length before you look.
- Find the last break of structure, on a close.
- Draw the range: the last opposite swing to the furthest price since the break.
- Split it at 50%. Note which half price is in, as a %.
- Bullish range: wait for discount. Bearish range: wait for premium.
- Inside that half, look for your entry, like an order block or a fair value gap.
- Redraw at the next break of structure.
Which timeframe works best?
We haven't compared timeframes, so we can't name a best one. The rule is the same on every chart. A 4-hour range and a 5-minute range on the same chart can disagree. Pick the one you trade and read every break on its closes.
Common mistakes
- Picking the range by eye. A different high or low moves the 50% line. Use a rule.
- Buying discount in a bearish range. Discount is where a bullish range's buys are looked for. In a bearish range, it's where a chase lands.
- Chasing the break. In the film the breakout candle closes at 100% of the range it starts: deep premium. Check the % before you chase.
- Keeping an old range after a new break of structure.
- Treating 50% as support. It's a midpoint. Price passes through it all the time.
- Mixing timeframes. A 15-minute range's discount can be a 4-hour range's premium.
Do premium and discount zones work?
Which tools draw premium and discount?
Two of ours, free. We read the Pine source of each.
Premium and discount on your own chart, free. ICT Levels Desk splits the previous day's high-to-low range at equilibrium: premium shaded rose above, discount teal below (default theme), the 50% line dotted. It's on by default and redraws when a new day's levels are set. Its panel says which half price is in and how far from equilibrium. Location Desk draws this page's line as "Leg 50 %": from the last confirmed swing to the furthest price since the break. Its swings take 5 candles a side by default; the films use 3. Its cloud marks the top 25% of a range as the sell location and the bottom 25% as the buy location.
The SMC AI-Scored Toolkit (v1.4.2) doesn't draw premium or discount. It scores order blocks and fair value gaps.
One free TradingView script we source-checked for our SMC indicator comparison draws premium and discount zones too:
- Smart Money Concepts by LuxAlgo (source v7, read 2026-10-04). Off by default (line 131). Its range starts at the last swing high and low found with a 50-bar swing length (line 95), and every new high or low pushes it out (lines 710 to 713). Its premium box is the top 5% of that range, its discount box the bottom 5%, and its equilibrium a band from 47.5% to 52.5% (lines 756 to 761).
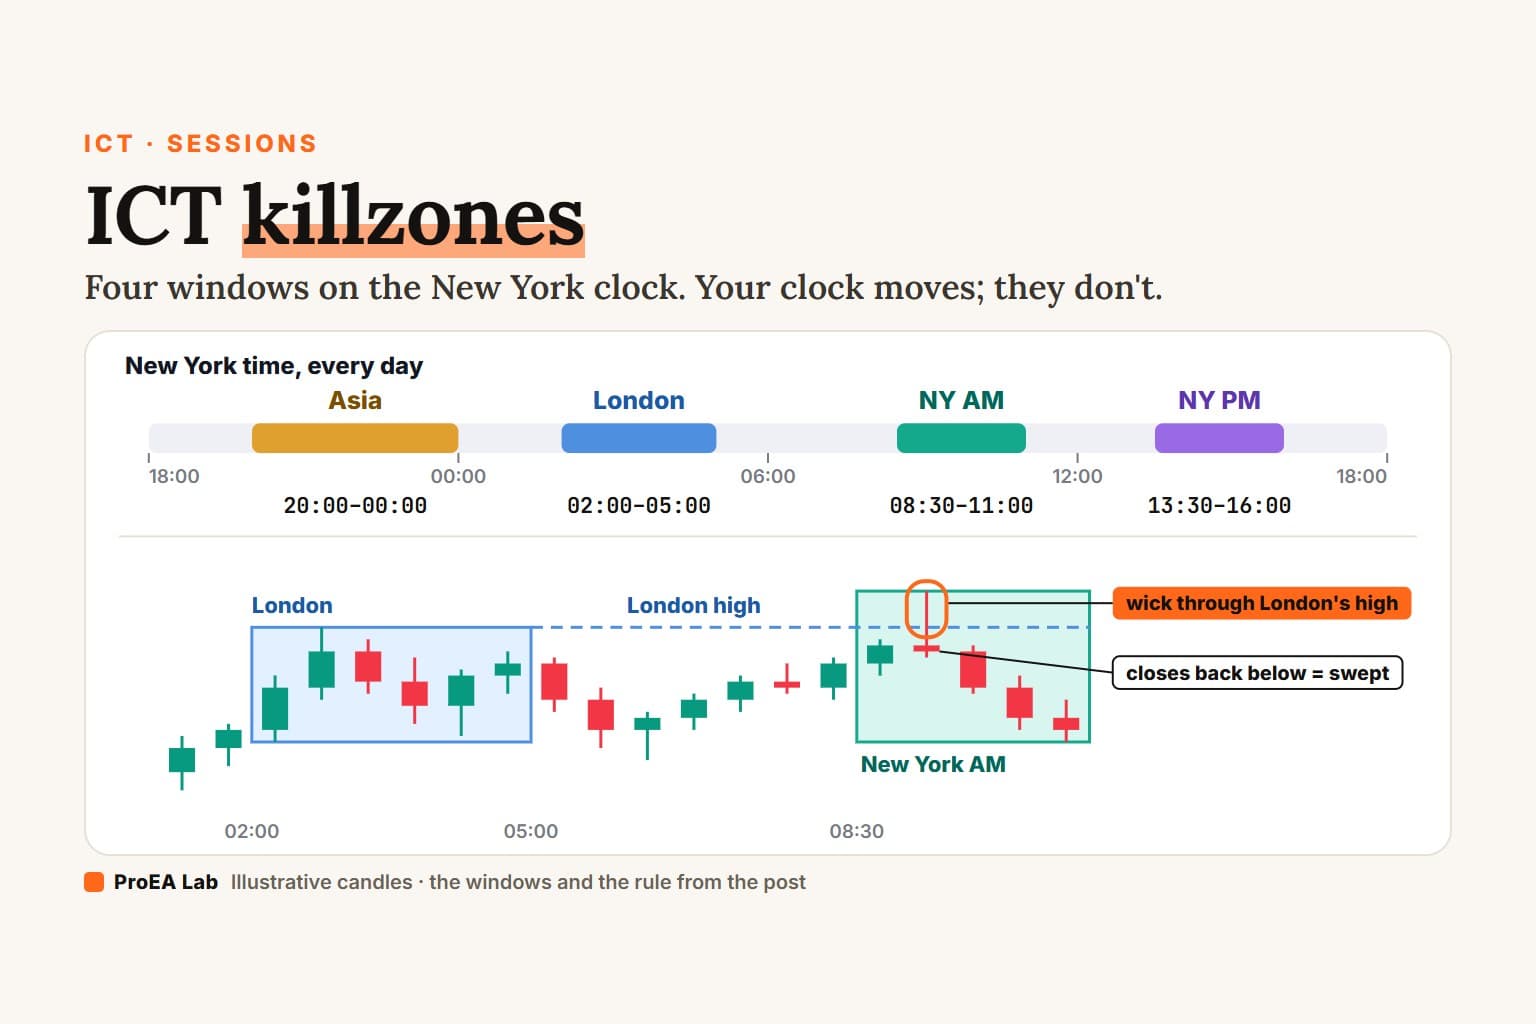
For when to look, not where: ICT killzones. More concepts, each with one rule and its own replays: SMC & order flow.
Disclosure
We build ICT Levels Desk, Location Desk and Signal Desk and give them away; we sell other indicators, including the SMC AI-Scored Toolkit. We have no relationship with LuxAlgo or innercircletrader.net. Nothing here is financial advice.
Use these animations on your site.