Location Desk · Free & open-source
High or low, compared with what?
See the range. Check direction. Wait for the setup.
Full indicator and strategy included. No signup.
What is Location Desk?
Location Desk is a free TradingView indicator that compares price with rolling, swing or previous-day ranges, then separates location from direction. Its entry sequence looks for a small range, a strong departure and a qualifying return. Range bands show areas to investigate; they do not establish an entry or trading advantage by themselves.
How do Location Desk's buy and sell bands work?
By default, the outer quarters of each selected range become buy and sell locations, with a continuation band around its midpoint. Rolling, confirmed-swing and previous-day modes use different references. A band describes relative location; it does not predict a reversal. Read the range calculations
Does returning to a Location Desk range always trigger an entry?
No. At the return, the tool checks the small range's midpoint against current observation locations, then checks direction, time, existing trade and daily allowance. A skipped return consumes that setup; it does not wait indefinitely for permission. Follow the return and entry gates
Do Location Desk and its strategy twin start with identical settings?
No. The indicator's default target is 3R, while the twin's Measurement grid starts at 5R and overrides several normal inputs. Align those settings before comparing results. Broker-emulator fills and costs can also differ from the indicator's paper ledger. Check the twin's active overrides
A price needs a frame of reference.
A reader wanted open-source bands showing where to look. The bands begin with a range.
Is 78 high or low?
One price alone cannot answer. A candle shows where price moved. Its white dot marks the close at 78.
Fictional prices; ranges calculated from the shown history. Three and five candles shorten the example, not the shipped observation windows.
How could this help a trade?
Choose an area to watch, then test an entry and exit rule there. Location alone cannot establish an advantage.
The return still needs permission.
Reveal nine candles. Compare what happens when price returns.
Collect six candles first.
The tool looks for a small recent range. These prices are close together, but this demonstration has not collected all six candles yet.
Compare cases at candle nine. A short plans for lower prices; a return can still fail or be skipped.
What is supplied, and what is calculated?
One fictional setup, with supplied bearish confirmed direction, fixed observation ranges 80–120 and 70–126, a permitted window, no open trade and the ledger on. ATR is supplied as 4 on every candle, including entry; it is not calculated from these nine bars. The six-candle execution range and subsequent decisions are calculated from revealed bars. This isolated replay ends when this setup ends.
Find the same clues on a real chart.
Select the dashboard, bands or explanation.
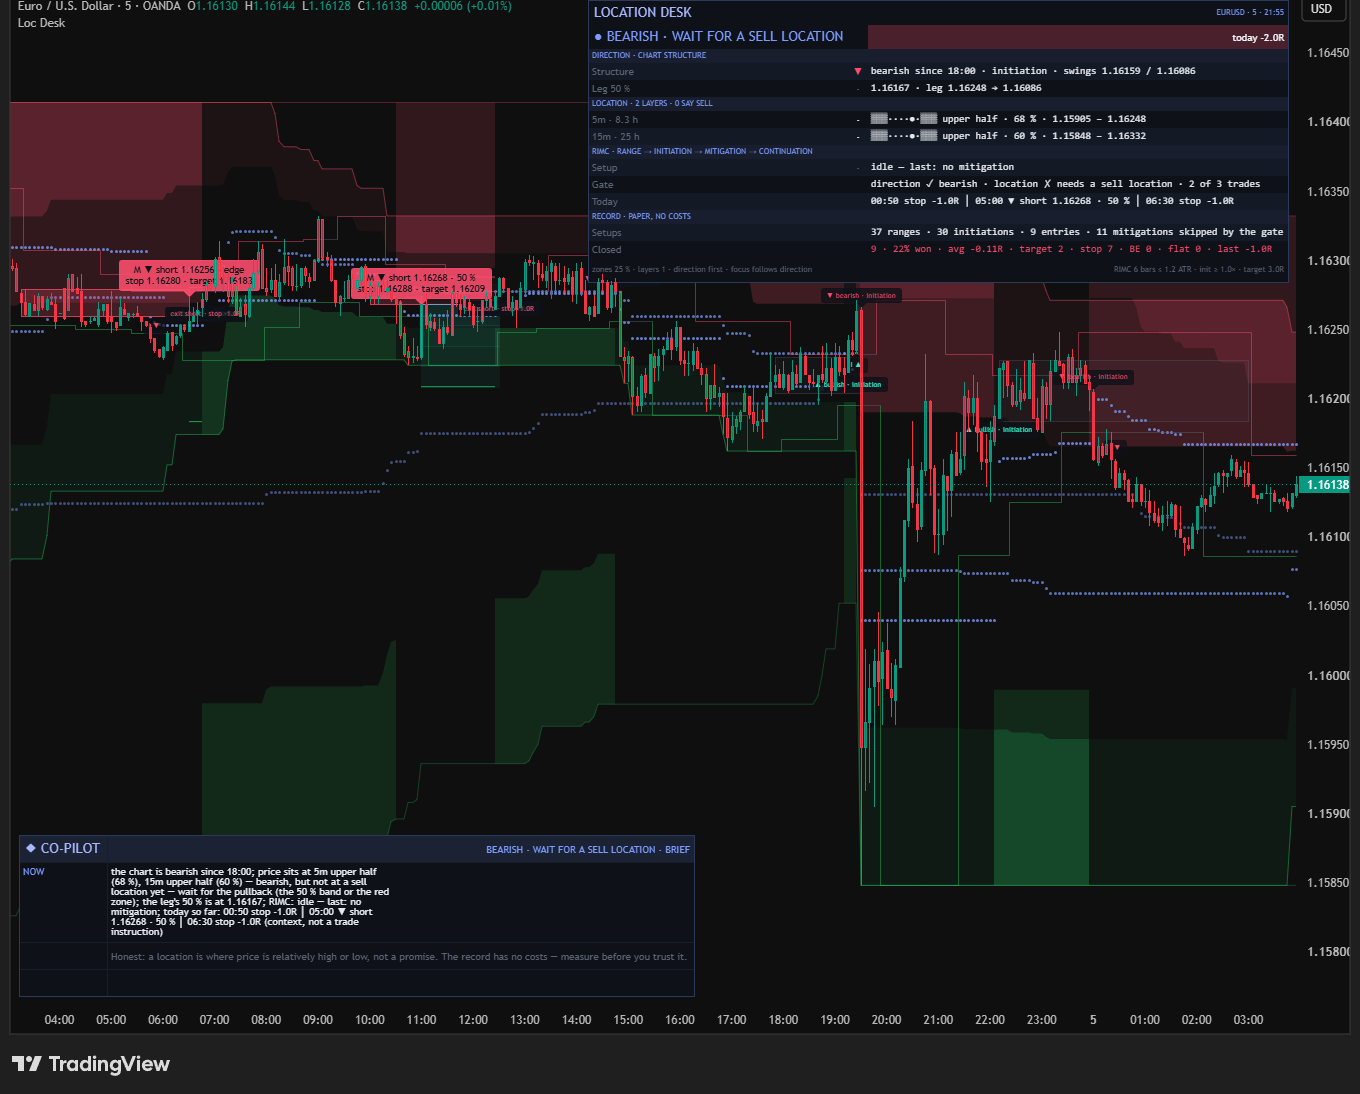
This capture says BEARISH · WAIT FOR A SELL LOCATION. Structure supplies the side, but price is still in the upper half of both ranges. Bearish direction alone does not permit an entry.
Open the original chart full size ↗Explore every layer and move the price
Freeze the reference ranges and move the close. This thought experiment isolates price location; real rolling ranges can move too.
Move the candle. Read the zones.
Drag the last candle’s close on the chart, or use the slider. Its blue price line runs through the 5m and 15m ranges.
This is a test candle. The reference ranges and direction stay fixed while you explore.
How the ranges differ, and more options
The candles and the range columns use the same vertical price scale. Each column keeps its own high and low. In the second example, the 15m window includes an earlier, higher extreme outside the visible candles. The 15m column grows taller while the test close stays the same.
The 5m and 15m labels name the observation timeframes. They do not mean only five or fifteen minutes of history: the shipped rolling windows use 100 bars each. This drawing shows a few recent candles and freezes the reference ranges. The real tool updates its ranges and direction as bars close.
The default layers are 5m + 15m. These examples show both sides for comparison; visibility does not set direction or alter the entry rule.
A range midpoint is halfway between that range’s high and low. The impulse midpoint is halfway between the current leg’s starting swing and its extreme. They can be different.
Outer-zone illustration; the full read also uses continuation bands, the impulse midpoint and the nearest-layer guard.
Schematic examples · no market prices · location is not an entry
Follow the full direction-to-entry walkthrough
Range → initiation → mitigation → continuation names the method. In plain words: a small range, a strong move away, a return, then an entry plan if checks pass.
Follow one sell setup
Same beginning. Compare what happens at the end.
Start with the direction.
A candle closes below a confirmed swing low. The chart’s structure turns bearish.
NextLook for a sell location.
Why this step?
Direction comes from structure. A wick through the swing is different from a close beyond it. This structure break is not the entry.
BEARISH STRUCTURE
Illustrated example First-touch rule No trade result shown
Paste it into TradingView.
Both complete Pine v6 scripts are free, under MIT.
- 1
Open Pine Editor
Create an indicator on an intraday chart.
- 2
Paste and save
Replace the sample. Choose Add to chart.
- 3
Read the default setup
Start with five- or fifteen-minute candles and observation frames at least as large.
The indicator
Draws on the price chart. Its default target is three times the initial risk distance.
Copy the code as it is. No coding needed.
View the full code
// ═══════════════════════════════════════════════════════════════════════════════════════════════════════
//  LOCATION DESK — direction · location (the cloud) · RIMC execution · Co-Pilot  ·  Pine Script v6  ·  v1.1.0
//  Built for a r/pinescript thread reply ("NJAT location tool!" — "a cloud like band location tool that shows where
//  you should be looking for buys or sells"). Open-source answer to the idea behind it: where is price inside the
//  range of the timeframe you observe — a red band at the top (look for sells), a green band at the bottom (look
//  for buys), the 50 % line for continuation pullbacks — on up to three observation timeframes at once, read
//  together with the chart's structure (direction first, location second), and an RIMC execution
//  (Range → Initiation → Mitigation → Continuation) attached so the whole idea can be measured.
//
//  HOW IT READS THE MARKET (every decision commits on the CLOSED bar — nothing repaints):
//     1 LAYERS     up to three location layers, each an observation timeframe and a range: the rolling window of
//                  that timeframe (default), its last swing high / low, or the previous day. Sell zone = top part
//                  of the range, buy zone = bottom part, 50 % line + a continuation band around it.
//     2 DIRECTION  chart structure: a close above the last swing high = bullish until a close below the last swing
//                  low (and the mirror). The breaking bar with a real body = an initiation. Sideways when no new
//                  break comes and price sits inside the swings.
//     3 THE READ   bearish + a sell location (edge, the 50 % line, or the leg's 50 %) = look for sells; bullish + a buy location =
//                  look for buys; selling in a buy location = low probability; a higher layer's zone against the
//                  chart's direction = wait for the change; mid-range = stand aside. Layers agreeing = stacked.
//     4 RIMC       a small range forms, price initiates away by at least the range's height, comes back and
//                  CLOSES inside it → entry at that close, stop beyond the far side, target in R or at structure
//                  (the initiation extreme, the opposite zone) — only when the read allows that side.
//     FOCUS        the cloud follows the direction: the side you should be looking at draws strong, the other fades.
//
//  Paper ledger has NO costs — a description of the past on your chart. The strategy twin measures it with costs.
//  License: MIT — share freely, keep this header.  © 2026 ProEA Lab · built for r/pinescript
// ═══════════════════════════════════════════════════════════════════════════════════════════════════════
//@version=6
indicator("Location Desk — direction · location · RIMC execution", "Loc Desk", overlay = true, max_labels_count = 400, max_boxes_count = 200, max_lines_count = 200)

// ─────────────────────────────────────────────────────────────────── INPUTS
gL = "Location layers (the cloud) — on · observation timeframe · range · bars of that timeframe"
inL1On   = input.bool(true, "1", inline = "l1", group = gL, display = display.none)
inL1Tf   = input.timeframe("5", "", inline = "l1", group = gL, display = display.none)
inL1Mode = input.string("Rolling window", "", options = ["Rolling window", "Swing range", "Previous day"], inline = "l1", group = gL, display = display.none)
inL1N    = input.int(100, "", minval = 5, maxval = 1000, inline = "l1", group = gL, tooltip = "Layer 1 — the nearest location. Rolling window: the highest high and lowest low of the last N bars of the observation timeframe, computed on this chart's closed bars (identical extremes, no higher-timeframe request, never repaints). Swing range: the last confirmed swing high and swing low of that timeframe. Previous day: yesterday's high and low.", display = display.none)
inL2On   = input.bool(true, "2", inline = "l2", group = gL, display = display.none)
inL2Tf   = input.timeframe("15", "", inline = "l2", group = gL, display = display.none)
inL2Mode = input.string("Rolling window", "", options = ["Rolling window", "Swing range", "Previous day"], inline = "l2", group = gL, display = display.none)
inL2N    = input.int(100, "", minval = 5, maxval = 1000, inline = "l2", group = gL, tooltip = "Layer 2 — the context location (the 15-minute chart in the NJAT videos).", display = display.none)
inL3On   = input.bool(false, "3", inline = "l3", group = gL, display = display.none)
inL3Tf   = input.timeframe("60", "", inline = "l3", group = gL, display = display.none)
inL3Mode = input.string("Rolling window", "", options = ["Rolling window", "Swing range", "Previous day"], inline = "l3", group = gL, display = display.none)
inL3N    = input.int(100, "", minval = 5, maxval = 1000, inline = "l3", group = gL, tooltip = "Layer 3 — the higher-timeframe location.", display = display.none)
inZonePct = input.int(25, "Zone size — top and bottom % of the range", minval = 5, maxval = 50, group = gL, tooltip = "The sell zone is the top N % of the range, the buy zone the bottom N %. 25 = the outer quarters.", display = display.none)
inContPct = input.int(5, "Continuation band — ± % around the 50 % line", minval = 1, maxval = 20, group = gL, tooltip = "The 'relative 50 % location': after an initiation, a pullback into this band is a continuation location.", display = display.none)
inLeg     = input.int(5, "Swing leg for 'Swing range' (bars of the layer's timeframe)", minval = 2, maxval = 50, group = gL, display = display.none)

gDr = "Direction (chart structure)"
inDirLeg   = input.int(5, "Swing leg (bars)", minval = 2, maxval = 50, group = gDr, tooltip = "Swings confirm this many bars late. A close above the last swing high = bullish until a close below the last swing low; the mirror for bearish.", display = display.none)
inInitAtr  = input.float(0.5, "Initiation — the breaking bar's body ≥ N × ATR", minval = 0, maxval = 5, step = 0.1, group = gDr, tooltip = "A break with a real body is an initiation (speed and aggression); a break without one is just a break. The 50 % continuation band counts as a location only after an initiation.", display = display.none)
inSideBars = input.int(60, "Sideways after N bars without a new break (price inside the swings)", minval = 5, maxval = 1000, group = gDr, display = display.none)

gRd = "The read"
inLayersReq = input.int(1, "Layers that must agree for a location", minval = 1, maxval = 3, group = gRd, tooltip = "1 = any layer's zone is a location. 2 = stacked: two layers must put price in the same-side zone (the layering the videos call the highest probability). Measured on gold 15m at 3R: requiring two layers left 4 trades in three months, all stopped — too rare to trade mechanically; keep it as a read, not a gate.", display = display.none)
inContOn    = input.bool(true, "The 50 % band counts as a location (continuation pullbacks)", group = gRd, display = display.none)
inNeedDir   = input.bool(true, "Direction first — only trade with the chart structure", group = gRd, tooltip = "Off = a location alone allows the trade (the initiation's own direction is used). Measured on gold 15m at 3R (profit factor): direction first on 0.54 (16 trades) · off 0.38 (22 trades) — the extra trades were the losing kind.", display = display.none)
inLeg50     = input.bool(true, "Leg 50 % — the midpoint of the current impulse counts as a continuation location", group = gRd, tooltip = "The 'relative 50 %' of the move itself: from the swing the break started at to the extreme reached since. After an initiation, a pullback into ± the continuation band around it is a continuation location (drawn as a dotted line).", display = display.none)
inFocus     = input.string("Follow direction", "Focus — which side of the cloud draws strong", options = ["Follow direction", "Both sides", "Sells only (premium)", "Buys only (discount)"], group = gRd, tooltip = "NJAT: 'set up that premium high probable location' — you look at ONE side once the direction is known. Follow direction: bearish = sell zones strong and buy zones faded, bullish = the mirror, sideways = both. The read and the ledger are unaffected; this is what the chart emphasises.", display = display.none)

gX = "RIMC execution (the measurable rule — paper ledger, the twin measures it with costs)"
inRimcOn     = input.bool(true, "Trade the RIMC entries", group = gX, display = display.none)
inRimcBars   = input.int(6, "Range: the last N bars fit inside …", minval = 3, maxval = 40, group = gX, display = display.none)
inRimcAtr    = input.float(1.2, "… a height of at most N × ATR", minval = 0.3, maxval = 5, step = 0.1, group = gX, display = display.none)
inInitMult   = input.float(1.0, "Initiation: a close beyond the range by ≥ N × its height", minval = 0.2, maxval = 3, step = 0.1, group = gX, tooltip = "'At least the same size as the range, otherwise it may be a sweep of liquidity.' Measured — see the build report.", display = display.none)
inInitWithin = input.int(10, "Initiation must come within N bars after the range", minval = 1, maxval = 100, group = gX, display = display.none)
inMitWithin  = input.int(30, "Mitigation must come within N bars after the initiation", minval = 1, maxval = 300, group = gX, display = display.none)
inMitMode    = input.string("First touch", "Mitigation entry", options = ["First touch", "Close inside the range"], group = gX, tooltip = "First touch = the first bar whose wick comes back into the range is the entry (at its close). Close inside the range = wait for a bar that CLOSES inside the range. Measured on gold 15m at 3R (profit factor): first touch 0.54 (3 of 16 won) · close inside 0.35 (2 of 13) — and with the v1.1 close-inside rule at 5R every one of 13 trades was stopped. First touch is the shipped default.", display = display.none)
inTpMode     = input.string("R multiple", "Target", options = ["R multiple", "Initiation extreme", "Opposite zone (layer 1)"], group = gX, tooltip = "R multiple = the R below. Initiation extreme = the furthest price the initiation reached before the mitigation ('take profit at the next point of structure'). Opposite zone (layer 1) = from a sell location to the buy location of the nearest layer — buy low, sell high across the range. A structure target closer than 1R falls back to the R target. Measured on gold 15m (profit factor): R multiple 3R 0.54 · initiation extreme 0.16 · opposite zone 0.45.", display = display.none)
inR          = input.float(3.0, "  R multiple", minval = 0.5, maxval = 20, step = 0.5, group = gX, tooltip = "NJAT's minimum is 1:5. Measured on gold 15m (profit factor, costs on): 5R 0.43 · 2R 0.49 · 3R 0.54 — 3R is the shipped default; none of them crosses 1.0 on the history we can see. EURUSD 15m at 3R: 0.29 with a 0.02 % commission, 0.73 with slippage only.", display = display.none)
inStopMode   = input.string("Range edge", "Stop", options = ["Range edge", "Last swing beyond the range"], group = gX, tooltip = "Range edge = just beyond the far side of the mitigated range (tight). Last swing beyond the range = NJAT's 'stop above the high': the chart's last swing high (for a short) or swing low (for a long) when it sits beyond the range, else the range edge. Measured on gold 15m at 3R (profit factor): range edge 0.54 · last swing 0.24 — the wider stop was hit just as often and cost more.", display = display.none)
inStopBuf    = input.float(0.1, "  Stop buffer (× ATR beyond the level)", minval = 0, maxval = 2, step = 0.05, group = gX, display = display.none)
inBeAt       = input.float(0.0, "Move the stop to breakeven at N R (0 = off)", minval = 0, maxval = 10, step = 0.5, group = gX, display = display.none)
inMaxTrades  = input.int(3, "Trades per day", minval = 1, maxval = 10, group = gX, display = display.none)
inWinOn      = input.bool(false, "Trade window only", group = gX, tooltip = "NJAT trades the London session, 08:00–10:00 London time. Measured at 3R: gold 15m 2 of 3 trades won (profit factor 1.16) · EURUSD 15m 2 of 3 (0.96, slippage only) — three trades each, which is a story, not a statistic.", display = display.none)
inWinSess    = input.session("0800-1000", "  Window", group = gX, display = display.none)
inTz         = input.string("Europe/London", "  Timezone (IANA)", group = gX, display = display.none)
inEodFlat    = input.bool(true, "  Flat at the end of the window", group = gX, display = display.none)
inRiskUsd    = input.float(0, "Risk per trade in account currency (0 = off, display only)", minval = 0, step = 10, group = gX, display = display.none)

gV = "Style"
inTheme     = input.string("Aurora Neon", "Theme", options = ["Aurora Neon", "Royal Gold", "Colorblind-safe"], group = gV, display = display.none)
inFills     = input.bool(true, "Zone fills (the cloud)", group = gV, display = display.none)
inFillA     = input.int(80, "  Nearest layer's fill transparency (higher layers are paler)", minval = 50, maxval = 97, group = gV, display = display.none)
inZoneLabels = input.bool(true, "Layer labels at the right edge", group = gV, display = display.none)
inShowSwings = input.bool(true, "Chart swings (step lines) and structure marks", group = gV, display = display.none)
inShowRanges = input.string("Last 10", "RIMC range boxes", options = ["All", "Last 10", "Off"], group = gV, display = display.none)
inZones     = input.bool(true, "Gradient risk / reward zones", group = gV, display = display.none)
inTint      = input.bool(true, "Tint candles while a trade is open", group = gV, display = display.none)
inTintLoc   = input.bool(true, "Tint candles while price sits in a location", group = gV, tooltip = "A soft wash on the bars that are inside a sell or buy zone of any layer — the 'am I in a location right now' at a glance. The middle of the range stays uncoloured on purpose: that is the no-man's-land the method tells you to stay out of.", display = display.none)
inWinShade  = input.bool(true, "Shade the trade window (when it is on)", group = gV, display = display.none)

gD = "Dashboard"
inDash      = input.bool(true, "Show the dashboard", group = gD, display = display.none)
inDashPos   = input.string("Top Right", "Position", options = ["Top Right", "Top Left", "Bottom Right", "Bottom Left", "Middle Right", "Middle Left"], group = gD, display = display.none)
inSize      = input.string("Medium", "Size", options = ["Small", "Medium", "Large"], group = gD, display = display.none)

gN = "Co-Pilot (narrative)"
inNarr      = input.string("Brief", "Narrative depth", options = ["Off", "Brief", "Standard", "Detailed"], group = gN, tooltip = "Brief = one sentence (NOW). Standard adds WHY and PLAN. Detailed adds the track record and a glossary.", display = display.none)
inNarrPos   = input.string("Bottom Left", "Position", options = ["Bottom Left", "Bottom Right", "Top Left", "Top Right", "Middle Left", "Middle Right"], group = gN, display = display.none)
inNarrSize  = input.string("Auto", "Size", options = ["Auto", "Small", "Medium", "Large"], group = gN, display = display.none)
inNarrWrap  = input.int(64, "Line width (characters)", minval = 30, maxval = 140, group = gN, display = display.none)

gA = "Alerts"
inAlertJson = input.bool(true, "alert() payload as JSON (webhooks)", group = gA, tooltip = "Choose 'Any alert() function call' when creating the alert.", display = display.none)

// ─────────────────────────────────────────────────────────────────── THEME
type Theme
    color bg       = #0B0E14
    color frame    = #B8923A
    color accent   = #D8B14A
    color accentHi = #E8C25A
    color up       = #2BE7C7
    color down     = #FF3B5C
    color flat     = #6B7280
    color txt      = #D7DCE6
    color txtHi    = #ECEFF5
    color sellZ    = #FF3B5C
    color buyZ     = #2BE7C7
themeOf(string name) =>
    Theme t = Theme.new()
    if name == "Aurora Neon"
        t.bg       := #0E1118
        t.frame    := #2C3A5A
        t.accent   := #7C9CFF
        t.accentHi := #A9B8FF
        t.up       := #2AF0C8
        t.down     := #FF4D6D
        t.flat     := #5B6472
        t.txt      := #E6E9EF
        t.txtHi    := #F2F4F9
        t.sellZ    := #FF4D6D
        t.buyZ     := #22C55E
    else if name == "Colorblind-safe"
        t.bg       := #0E1014
        t.frame    := #3A4150
        t.accent   := #56B4E9
        t.accentHi := #8ED0F5
        t.up       := #E69F00
        t.down     := #0072B2
        t.flat     := #8C92A0
        t.txt      := #E8EAED
        t.txtHi    := #FFFFFF
        t.sellZ    := #0072B2
        t.buyZ     := #E69F00
    t
// The cloud's colours are constants on purpose: a plot with a non-constant colour costs TWO of the 64 plot
// outputs, and three per-bar layers would not fit (that is what broke v1.0). Recolour any line in the Style tab.
const color cSell = #FF4D6D
const color cBuy  = #22C55E
const color cEq   = #7C9CFF
Theme th = themeOf(inTheme)
th.sellZ := cSell
th.buyZ  := cBuy
fmt(float x) => str.tostring(x, format.mintick)
tfOf(string tf) => tf == "" ? timeframe.period : tf
tfName(string tf) =>
    string p = tfOf(tf)
    float n = str.tonumber(p)
    na(n) ? p : n >= 60 and n % 60 == 0 ? str.tostring(n / 60, "#") + "H" : p + "m"

// ─────────────────────────────────────────────────────────────────── ENGINE · series (all ta.* at global scope)
float atr  = ta.atr(14)
float atrU = math.max(nz(atr, syminfo.mintick), syminfo.mintick)
float pdh  = request.security(syminfo.tickerid, "D", high[1], lookahead = barmerge.lookahead_on)
float pdl  = request.security(syminfo.tickerid, "D", low[1], lookahead = barmerge.lookahead_on)
int   chartSec = timeframe.in_seconds(timeframe.period)
// layer windows in chart bars (a layer's timeframe × its bars, expressed in this chart's bars)
int   sec1 = timeframe.in_seconds(tfOf(inL1Tf))
int   sec2 = timeframe.in_seconds(tfOf(inL2Tf))
int   sec3 = timeframe.in_seconds(tfOf(inL3Tf))
int   n1   = math.min(4000, math.max(1, math.round(inL1N * sec1 / chartSec)))
int   n2   = math.min(4000, math.max(1, math.round(inL2N * sec2 / chartSec)))
int   n3   = math.min(4000, math.max(1, math.round(inL3N * sec3 / chartSec)))
int   leg1 = math.max(1, math.round(inLeg * sec1 / chartSec))
int   leg2 = math.max(1, math.round(inLeg * sec2 / chartSec))
int   leg3 = math.max(1, math.round(inLeg * sec3 / chartSec))
float rH1  = ta.highest(high, n1)
float rL1  = ta.lowest(low, n1)
float rH2  = ta.highest(high, n2)
float rL2  = ta.lowest(low, n2)
float rH3  = ta.highest(high, n3)
float rL3  = ta.lowest(low, n3)
float ph1  = ta.pivothigh(high, leg1, leg1)
float pl1  = ta.pivotlow(low, leg1, leg1)
float ph2  = ta.pivothigh(high, leg2, leg2)
float pl2  = ta.pivotlow(low, leg2, leg2)
float ph3  = ta.pivothigh(high, leg3, leg3)
float pl3  = ta.pivotlow(low, leg3, leg3)
float dph  = ta.pivothigh(high, inDirLeg, inDirLeg)
float dpl  = ta.pivotlow(low, inDirLeg, inDirLeg)
float wH   = ta.highest(high, inRimcBars)
float wL   = ta.lowest(low, inRimcBars)
// clock
int    nowMin = hour(time, inTz) * 60 + minute(time, inTz)
string hhmm   = str.tostring(hour(time, inTz), "00") + ":" + str.tostring(minute(time, inTz), "00")
bool   inWin  = not inWinOn or not na(time(timeframe.period, inWinSess, inTz))
bool   winEnd = inWinOn and not inWin and inWin[1]
bool   newDay = dayofmonth(time, inTz) != dayofmonth(time[1], inTz)

// ─────────────────────────────────────────────────────────────────── STATE
type Layer
    bool   on = false
    string name = ""
    string mode = ""
    float  top = na
    float  bot = na
    float  swH = na
    float  swL = na
    float  sellLo = na
    float  buyHi = na
    float  eq = na
    float  cHi = na
    float  cLo = na
    int    loc = 9         // +2 sell zone (or above) · +1 upper half · 0 the 50 % band · -1 lower half · -2 buy zone (or below) · 9 not ready
    float  pos = na        // where price sits, % of the range (0 = the low, 100 = the high)
    int    nBars = 0
type Dir
    float swHi = na
    float swLo = na
    int   swHiBar = na
    int   swLoBar = na
    bool  hiBroken = false
    bool  loBroken = false
    int   bias = 0
    int   state = 0        // -1 bearish · 0 no direction / sideways · +1 bullish
    int   breakBar = na
    int   breakTime = na
    int   breaks = 0
    bool  initiated = false
    float legOrigin = na
    float legExt = na
    float leg50 = na
    int   readPrev = 0
type Rimc
    int   phase = 0        // 0 idle · 1 range formed · 2 initiated, waiting for the mitigation
    int   lastPhase = 0
    float top = na
    float bot = na
    int   startBar = na
    int   lastIn = na
    int   initDir = 0
    int   initBar = na
    float initExt = na
    int   n = 0
    box   bx = na
    string endWhy = ""
type Trade
    int    dir = 0
    float  entry = na
    float  sl = na
    float  sl0 = na
    float  r = na
    float  tp = na
    int    bar = na
    bool   beHit = false
    float  lastR = na
    string lastWhy = ""
    string locTxt = ""
type Stat
    int   n = 0
    int   wins = 0
    float sumR = 0.0
    int   nTp = 0
    int   nStop = 0
    int   nBe = 0
    int   nEod = 0
    int   nRanges = 0
    int   nInit = 0
    int   nMit = 0
    int   nSkip = 0
    int   days = 0
type Day
    int    trades = 0
    float  todayR = 0.0
    string log = ""
    int    dayNo = 0
type Ev
    bool   sigL = false
    bool   sigS = false
    bool   exit = false
    bool   be = false
    bool   rangeFormed = false
    bool   initiated = false
    bool   mitigated = false
    bool   skipped = false
    bool   dirChange = false
    bool   enterSell = false
    bool   enterBuy = false
    bool   enterEq = false
    bool   stacked = false
    bool   lookSell = false
    bool   lookBuy = false
    string why = ""
    string skipWhy = ""
    float  r = na
    int    dir = 0
var Layer L1 = Layer.new()
var Layer L2 = Layer.new()
var Layer L3 = Layer.new()
var array<Layer> layers = array.from(L1, L2, L3)
var Dir   dr = Dir.new()
var Rimc  rm = Rimc.new()
var Trade t  = Trade.new()
var Stat  st = Stat.new()
var Day   dy = Day.new()
Ev ev = Ev.new()

// ─────────────────────────────────────────────────────────────────── LAYERS (geometry every bar; swings commit on closed bars)
layerUpdate(Layer L, bool on, string tf, string mode, int nB, float rH, float rL, float ph, float pl) =>
    L.on := on
    L.name := tfName(tf)
    L.mode := mode
    L.nBars := nB
    if barstate.isconfirmed
        if not na(ph)
            L.swH := ph
        if not na(pl)
            L.swL := pl
    float top = mode == "Rolling window" ? rH : mode == "Swing range" ? (na(L.swH) or na(L.swL) ? na : math.max(L.swH, L.swL)) : pdh
    float bot = mode == "Rolling window" ? rL : mode == "Swing range" ? (na(L.swH) or na(L.swL) ? na : math.min(L.swH, L.swL)) : pdl
    L.top := top
    L.bot := bot
    float h = top - bot
    L.sellLo := top - h * inZonePct / 100
    L.buyHi  := bot + h * inZonePct / 100
    L.eq     := (top + bot) / 2
    L.cHi    := L.eq + h * inContPct / 100
    L.cLo    := L.eq - h * inContPct / 100
    L.pos    := na(top) or na(bot) or h <= 0 ? na : (close - bot) / h * 100
    L.loc    := na(top) or na(bot) or h <= 0 ? 9 : close >= L.sellLo ? 2 : close <= L.buyHi ? -2 : close <= L.cHi and close >= L.cLo ? 0 : close > L.eq ? 1 : -1
    L
locAt(Layer L, float px) =>
    na(L.top) or na(L.bot) or L.top <= L.bot ? 9 : px >= L.sellLo ? 2 : px <= L.buyHi ? -2 : px <= L.cHi and px >= L.cLo ? 0 : px > L.eq ? 1 : -1
layerUpdate(L1, inL1On, inL1Tf, inL1Mode, n1, rH1, rL1, ph1, pl1)
layerUpdate(L2, inL2On, inL2Tf, inL2Mode, n2, rH2, rL2, ph2, pl2)
layerUpdate(L3, inL3On, inL3Tf, inL3Mode, n3, rH3, rL3, ph3, pl3)

// ─────────────────────────────────────────────────────────────────── DIRECTION + RIMC (closed bars only)
logEv(string what) =>
    string e = hhmm + " " + what
    dy.log := dy.log == "" ? e : dy.log + " │ " + e
    array<string> ps = str.split(dy.log, " │ ")
    if array.size(ps) > 3
        string o = ""
        for i = array.size(ps) - 3 to array.size(ps) - 1
            o := o + (o == "" ? "" : " │ ") + array.get(ps, i)
        dy.log := o

// how many layers put a price in a location for side d (edge, or the 50 % band after an initiation in that direction)
alignedAt(int d, float px, bool contOk) =>
    int n = 0
    for L in layers
        if L.on
            int lc = locAt(L, px)
            if (d == -1 and lc == 2) or (d == 1 and lc == -2) or (contOk and lc == 0)
                n += 1
    if contOk and inLeg50 and not na(dr.leg50) and not na(dr.legOrigin) and not na(dr.legExt)
        float legH = math.abs(dr.legExt - dr.legOrigin)
        if legH > 0 and math.abs(px - dr.leg50) <= legH * inContPct / 100
            n += 1
    n
edgeAt(int d, float px) =>
    int n = 0
    for L in layers
        if L.on
            int lc = locAt(L, px)
            if (d == -1 and lc == 2) or (d == 1 and lc == -2)
                n += 1
    n
locWord(int lc) => lc == 2 ? "sell location" : lc == -2 ? "buy location" : lc == 0 ? "50 % band" : lc == 1 ? "upper half" : lc == -1 ? "lower half" : "not ready"

closeTrade(float px, string why) =>
    float rr = (px - t.entry) * t.dir / t.r
    ev.exit := true
    ev.why := why
    ev.r := rr
    ev.dir := t.dir
    st.n := st.n + 1
    st.wins := st.wins + (rr >= 0.05 ? 1 : 0)
    st.sumR := st.sumR + rr
    if why == "TP"
        st.nTp := st.nTp + 1
    else if why == "EOD"
        st.nEod := st.nEod + 1
    else if why == "BE"
        st.nBe := st.nBe + 1
    else
        st.nStop := st.nStop + 1
    dy.todayR := dy.todayR + rr
    logEv((why == "TP" ? "target " : why == "EOD" ? "flat " : why == "BE" ? "breakeven " : "stop ") + (rr >= 0 ? "+" : "") + str.tostring(rr, "0.0") + "R")
    t.lastR := rr
    t.lastWhy := why
    t.dir := 0

openTrade(int d, string locTxt) =>
    float edge = d == 1 ? rm.bot : rm.top
    float swingStop = d == 1 ? (not na(dr.swLo) and dr.swLo < edge ? dr.swLo : edge) : (not na(dr.swHi) and dr.swHi > edge ? dr.swHi : edge)
    float anchor = inStopMode == "Last swing beyond the range" ? swingStop : edge
    float slPx = d == 1 ? math.min(anchor - inStopBuf * atrU, close - syminfo.mintick) : math.max(anchor + inStopBuf * atrU, close + syminfo.mintick)
    t.dir := d
    t.entry := close
    t.sl := slPx
    t.sl0 := slPx
    t.r := math.abs(close - slPx)
    float tpR    = close + d * inR * t.r
    float tpInit = na(rm.initExt) ? tpR : rm.initExt
    float tpZone = L1.on and not na(L1.top) ? (d == 1 ? L1.sellLo : L1.buyHi) : tpR
    float tpRaw  = inTpMode == "Initiation extreme" ? tpInit : inTpMode == "Opposite zone (layer 1)" ? tpZone : tpR
    t.tp := (tpRaw - close) * d >= t.r ? tpRaw : tpR
    t.bar := bar_index
    t.beHit := false
    t.locTxt := locTxt
    dy.trades := dy.trades + 1
    st.nMit := st.nMit + 1
    logEv((d == 1 ? "▲ long " : "▼ short ") + fmt(close) + " · " + locTxt)
    if d == 1
        ev.sigL := true
    else
        ev.sigS := true

if barstate.isconfirmed and not na(atr)
    // ── the day
    if newDay
        dy.trades := 0
        dy.todayR := 0.0
        dy.log := ""
        dy.dayNo := dy.dayNo + 1
        st.days := st.days + 1
    // ── direction: swings confirm, breaks commit
    if not na(dph)
        dr.swHi := dph
        dr.swHiBar := bar_index - inDirLeg
        dr.hiBroken := false
    if not na(dpl)
        dr.swLo := dpl
        dr.swLoBar := bar_index - inDirLeg
        dr.loBroken := false
    bool bosUp = not na(dr.swHi) and not dr.hiBroken and close > dr.swHi
    bool bosDn = not na(dr.swLo) and not dr.loBroken and close < dr.swLo
    if bosUp and bosDn
        bosUp := close >= open
        bosDn := not bosUp
    int prevState = dr.state
    if bosUp
        dr.hiBroken := true
        dr.bias := 1
        dr.breakBar := bar_index
        dr.breakTime := time
        dr.breaks := dr.breaks + 1
        dr.initiated := math.abs(close - open) >= inInitAtr * atrU
        dr.legOrigin := nz(dr.swLo, low)
        dr.legExt := high
    if bosDn
        dr.loBroken := true
        dr.bias := -1
        dr.breakBar := bar_index
        dr.breakTime := time
        dr.breaks := dr.breaks + 1
        dr.initiated := math.abs(close - open) >= inInitAtr * atrU
        dr.legOrigin := nz(dr.swHi, high)
        dr.legExt := low
    if dr.bias == 1 and not na(dr.legExt)
        dr.legExt := math.max(dr.legExt, high)
    else if dr.bias == -1 and not na(dr.legExt)
        dr.legExt := math.min(dr.legExt, low)
    dr.leg50 := na(dr.legOrigin) or na(dr.legExt) ? na : (dr.legOrigin + dr.legExt) / 2
    bool inside = not na(dr.swHi) and not na(dr.swLo) and close < dr.swHi and close > dr.swLo
    dr.state := dr.bias != 0 and bar_index - nz(dr.breakBar, bar_index) > inSideBars and inside ? 0 : dr.bias
    ev.dirChange := dr.state != prevState
    // ── manage an open trade (stop first, then target, breakeven, end of window)
    if t.dir != 0
        int d = t.dir
        bool stopHit = d == 1 ? low <= t.sl : high >= t.sl
        if stopHit
            closeTrade(t.sl, t.beHit and t.sl == t.entry ? "BE" : "SL")
        else if d == 1 ? high >= t.tp : low <= t.tp
            closeTrade(t.tp, "TP")
        else
            if inBeAt > 0 and not t.beHit and (d == 1 ? high >= t.entry + inBeAt * t.r : low <= t.entry - inBeAt * t.r)
                t.beHit := true
                t.sl := t.entry
                ev.be := true
                logEv("breakeven")
            if inEodFlat and winEnd and t.dir != 0
                closeTrade(close, "EOD")
    // ── RIMC: range → initiation → mitigation
    bool tight = wH - wL <= inRimcAtr * atrU
    rm.lastPhase := rm.phase
    if rm.phase == 0
        if tight
            rm.phase := 1
            rm.top := wH
            rm.bot := wL
            rm.startBar := bar_index - inRimcBars + 1
            rm.lastIn := bar_index
            rm.initDir := 0
            rm.initBar := na
            rm.initExt := na
            rm.n := rm.n + 1
            rm.endWhy := ""
            st.nRanges := st.nRanges + 1
            ev.rangeFormed := true
    else if rm.phase == 1
        float h = rm.top - rm.bot
        bool insideBox = close <= rm.top and close >= rm.bot
        if insideBox
            float nTop = math.max(rm.top, high)
            float nBot = math.min(rm.bot, low)
            if nTop - nBot <= inRimcAtr * atrU
                rm.top := nTop
                rm.bot := nBot
            rm.lastIn := bar_index
        else if close > rm.top + inInitMult * h or close < rm.bot - inInitMult * h
            rm.phase := 2
            rm.initDir := close > rm.top ? 1 : -1
            rm.initBar := bar_index
            rm.initExt := rm.initDir == 1 ? high : low
            st.nInit := st.nInit + 1
            ev.initiated := true
        else if bar_index - rm.lastIn > inInitWithin
            rm.phase := 0
            rm.endWhy := "no initiation"
    else
        int d = rm.initDir
        rm.initExt := d == 1 ? math.max(rm.initExt, high) : math.min(rm.initExt, low)
        bool insideClose = close <= rm.top and close >= rm.bot
        bool touched = d == 1 ? low <= rm.top : high >= rm.bot
        bool mitHit = inMitMode == "First touch" ? touched : insideClose
        bool through = d == 1 ? close < rm.bot : close > rm.top
        if through
            rm.phase := 0
            rm.endWhy := "fell back through the range"
        else if mitHit
            float mid = (rm.top + rm.bot) / 2
            bool contOk = inContOn and dr.state == d
            int  nAl = alignedAt(d, mid, contOk)
            int  nEd = edgeAt(d, mid)
            bool dirOk = not inNeedDir or dr.state == d
            int  nearBox = L1.on ? locAt(L1, mid) : L2.on ? locAt(L2, mid) : L3.on ? locAt(L3, mid) : 9
            bool locOk = nAl >= inLayersReq and not (d == 1 and nearBox == 2) and not (d == -1 and nearBox == -2)
            string skipWhy = not dirOk ? "direction is " + (dr.state == 0 ? "sideways" : dr.state == 1 ? "bullish" : "bearish") : not locOk ? (nAl == 0 ? "no " + (d == 1 ? "buy" : "sell") + " location" : "only " + str.tostring(nAl) + " of " + str.tostring(inLayersReq) + " layers") : not inWin ? "outside the window" : t.dir != 0 ? "in a trade" : dy.trades >= inMaxTrades ? "trades per day used" : not inRimcOn ? "ledger off" : ""
            rm.phase := 0
            rm.endWhy := skipWhy == "" ? "mitigated → entry" : "mitigated · " + skipWhy
            if skipWhy == ""
                openTrade(d, (nEd > 0 ? "edge" : "50 %") + (nAl >= 2 ? " · stacked ×" + str.tostring(nAl) : ""))
            else
                ev.mitigated := true
                ev.skipped := true
                ev.skipWhy := skipWhy
                ev.dir := d
                st.nSkip := st.nSkip + 1
                logEv("skip · " + (not dirOk ? "direction" : not locOk ? "location" : not inWin ? "window" : t.dir != 0 ? "in trade" : dy.trades >= inMaxTrades ? "budget" : "ledger off"))
        else if bar_index - rm.initBar > inMitWithin
            rm.phase := 0
            rm.endWhy := "no mitigation"
    // ── location events (price entering a zone in the direction's favour)
    int sellNow = edgeAt(-1, close)
    int buyNow  = edgeAt(1, close)
    int sellPrev = edgeAt(-1, close[1])
    int buyPrev  = edgeAt(1, close[1])
    ev.enterSell := sellNow > 0 and sellPrev == 0
    ev.enterBuy  := buyNow > 0 and buyPrev == 0
    bool eqNow = false
    bool eqPrev = false
    for L in layers
        if L.on
            eqNow := eqNow or locAt(L, close) == 0
            eqPrev := eqPrev or locAt(L, close[1]) == 0
    ev.enterEq := eqNow and not eqPrev and dr.state != 0 and dr.initiated
    ev.stacked := (dr.state == -1 and sellNow >= 2 and sellPrev < 2) or (dr.state == 1 and buyNow >= 2 and buyPrev < 2)
    int nearNow = L1.on ? L1.loc : L2.on ? L2.loc : L3.on ? L3.loc : 9
    int rcNow = dr.state == 0 ? 0 : dr.state == -1 ? (alignedAt(-1, close, inContOn) >= inLayersReq and nearNow != -2 ? -2 : -1) : (alignedAt(1, close, inContOn) >= inLayersReq and nearNow != 2 ? 2 : 1)
    ev.lookSell := rcNow == -2 and dr.readPrev != -2
    ev.lookBuy  := rcNow == 2 and dr.readPrev != 2
    dr.readPrev := rcNow

// ─────────────────────────────────────────────────────────────────── THE READ (display only)
int   sellN = alignedAt(-1, close, inContOn and dr.state == -1)
int   buyN  = alignedAt(1, close, inContOn and dr.state == 1)
int   sellE = edgeAt(-1, close)
int   buyE  = edgeAt(1, close)
bool  eqAny = false
for L in layers
    if L.on and L.loc == 0
        eqAny := true
int   nOn = (L1.on ? 1 : 0) + (L2.on ? 1 : 0) + (L3.on ? 1 : 0)
string dirWord = dr.state == 1 ? "bullish" : dr.state == -1 ? "bearish" : dr.bias == 0 ? "no direction yet" : "sideways"
string sinceTxt = na(dr.breakTime) ? "" : " since " + str.tostring(hour(dr.breakTime, inTz), "00") + ":" + str.tostring(minute(dr.breakTime, inTz), "00")
int    nearLoc  = L1.on ? L1.loc : L2.on ? L2.loc : L3.on ? L3.loc : 9
int    readCode = t.dir != 0 ? 5 : dr.state == 0 ? 0 : dr.state == -1 ? (sellN >= inLayersReq ? (nearLoc == -2 ? -4 : -2) : buyE > 0 ? -3 : -1) : (buyN >= inLayersReq ? (nearLoc == 2 ? 4 : 2) : sellE > 0 ? 3 : 1)
// -2 look for sells · -1 bearish, wait for a location · -3 bearish in a buy location (low probability) · -4 a sell location on a higher layer but the nearest layer has price at its LOW — wait for the pullback · +2/+1/+3/+4 the mirror · 0 stand aside · 5 in a trade
string stackTxt = (dr.state == -1 ? sellN : buyN) >= 2 ? " · STACKED ×" + str.tostring(dr.state == -1 ? sellN : buyN) : ""
string stateWord = t.dir == 1 ? "LONG OPEN" : t.dir == -1 ? "SHORT OPEN" : readCode == 0 ? (dr.bias == 0 ? "NO DIRECTION YET" : "SIDEWAYS · WAIT FOR DIRECTION") : readCode == -2 ? "LOOK FOR SELLS" + stackTxt : readCode == 2 ? "LOOK FOR BUYS" + stackTxt : readCode == -3 ? "BEARISH IN A BUY LOCATION · LOW PROBABILITY" : readCode == 3 ? "BULLISH IN A SELL LOCATION · WAIT FOR THE CHANGE" : readCode == -4 ? "BEARISH · SELL LOCATION ABOVE, BUT " + (L1.on ? L1.name : L2.on ? L2.name : L3.name) + " IS AT ITS LOW · WAIT FOR THE PULLBACK" : readCode == 4 ? "BULLISH · BUY LOCATION BELOW, BUT " + (L1.on ? L1.name : L2.on ? L2.name : L3.name) + " IS AT ITS HIGH · WAIT FOR THE PULLBACK" : readCode == -1 ? "BEARISH · WAIT FOR A SELL LOCATION" : "BULLISH · WAIT FOR A BUY LOCATION"
color  stateCol  = t.dir == 1 ? th.up : t.dir == -1 ? th.down : readCode == -2 ? th.down : readCode == 2 ? th.up : readCode == 0 ? th.flat : readCode == -3 or readCode == 3 or readCode == -4 or readCode == 4 ? th.accentHi : th.accent
float  openR     = t.dir != 0 ? (close - t.entry) * t.dir / t.r : na
string sizeTxt   = inRiskUsd > 0 and t.dir != 0 and t.r > 0 ? str.tostring(math.floor(inRiskUsd / t.r)) + (syminfo.type == "stock" or syminfo.type == "fund" ? " shares" : " units") + " for " + str.tostring(inRiskUsd, "#") + " risk" : ""
string chipTxt   = t.dir != 0 ? (openR >= 0 ? "+" : "") + str.tostring(openR, "0.0") + "R now" + (t.beHit ? " · stop at breakeven" : "") : dy.trades > 0 ? "today " + (dy.todayR >= 0 ? "+" : "") + str.tostring(dy.todayR, "0.0") + "R" : rm.phase == 2 ? "initiated " + (rm.initDir == 1 ? "▲" : "▼") : rm.phase == 1 ? "range forming" : "day " + str.tostring(dy.dayNo)
string rimcTxt   = rm.phase == 1 ? "range " + fmt(rm.bot) + " – " + fmt(rm.top) + " (" + str.tostring(bar_index - rm.startBar + 1) + " bars) · waiting for an initiation ≥ " + str.tostring(inInitMult, "0.0") + " × its height" : rm.phase == 2 ? "initiated " + (rm.initDir == 1 ? "▲" : "▼") + " from " + fmt(rm.bot) + " – " + fmt(rm.top) + " · waiting for the mitigation (" + str.tostring(math.max(0, inMitWithin - (bar_index - nz(rm.initBar, bar_index)))) + " bars left)" : "idle — " + (rm.endWhy == "" ? "no range yet" : "last: " + rm.endWhy)
string tpModeTxt = inTpMode == "R multiple" ? str.tostring(inR, "0.0") + "R" : inTpMode == "Initiation extreme" ? "initiation extreme" : "opposite zone"
int    locTint   = sellE > 0 ? 1 : buyE > 0 ? -1 : 0
int    sellFade  = inFocus == "Both sides" ? 0 : inFocus == "Buys only (discount)" ? 100 : inFocus == "Sells only (premium)" ? 0 : dr.state == 1 ? 14 : 0
int    buyFade   = inFocus == "Both sides" ? 0 : inFocus == "Sells only (premium)" ? 100 : inFocus == "Buys only (discount)" ? 0 : dr.state == -1 ? 14 : 0
string gateTxt   = (inNeedDir ? "direction " + (dr.state == 0 ? "✗ " + dirWord : "✓ " + dirWord) : "direction not required") + " · location " + (dr.state == -1 ? (sellN >= inLayersReq ? "✓ sell" : "✗ needs a sell location") : dr.state == 1 ? (buyN >= inLayersReq ? "✓ buy" : "✗ needs a buy location") : "— no side yet") + (inWinOn ? " · window " + (inWin ? "✓" : "✗") : "") + " · " + str.tostring(dy.trades) + " of " + str.tostring(inMaxTrades) + " trades"

// ─────────────────────────────────────────────────────────────────── CHART · the cloud (per-bar plots + fills), leg 50 %, swings, RIMC boxes, trade levels
// The cloud is drawn bar by bar so you can look back and see where the locations WERE — the "cloud like band".
// Plot colours are inputs (not theme fields) on purpose: a series colour costs a second output and three layers
// of per-bar bands blew the 64-plot budget in v1.0. Nearer layer strong, higher layers paler; the side the
// direction says to look at draws strong, the other side fades (Focus).
int   a1 = inFillA
int   a2 = math.min(97, inFillA + 6)
int   a3 = math.min(97, inFillA + 11)
p1t = plot(inL1On ? L1.top : na, "L1 range high", color = color.new(cSell, 55), linewidth = 1, display = display.pane)
p1s = plot(inL1On ? L1.sellLo : na, "L1 sell zone floor", color = color.new(#000000, 100), display = display.pane)
p1e = plot(inL1On ? L1.eq : na, "L1 50 %", color = color.new(cEq, 30), linewidth = 1, style = plot.style_circles, display = display.pane)
p1b = plot(inL1On ? L1.buyHi : na, "L1 buy zone ceiling", color = color.new(#000000, 100), display = display.pane)
p1o = plot(inL1On ? L1.bot : na, "L1 range low", color = color.new(cBuy, 55), linewidth = 1, display = display.pane)
fill(p1t, p1s, color = inFills and inL1On ? color.new(cSell, math.min(100, a1 + sellFade)) : na, title = "L1 sell zone")
fill(p1b, p1o, color = inFills and inL1On ? color.new(cBuy, math.min(100, a1 + buyFade)) : na, title = "L1 buy zone")
p2t = plot(inL2On ? L2.top : na, "L2 range high", color = color.new(cSell, 72), linewidth = 1, display = display.pane)
p2s = plot(inL2On ? L2.sellLo : na, "L2 sell zone floor", color = color.new(#000000, 100), display = display.pane)
p2e = plot(inL2On ? L2.eq : na, "L2 50 %", color = color.new(cEq, 55), linewidth = 1, style = plot.style_circles, display = display.pane)
p2b = plot(inL2On ? L2.buyHi : na, "L2 buy zone ceiling", color = color.new(#000000, 100), display = display.pane)
p2o = plot(inL2On ? L2.bot : na, "L2 range low", color = color.new(cBuy, 72), linewidth = 1, display = display.pane)
fill(p2t, p2s, color = inFills and inL2On ? color.new(cSell, math.min(100, a2 + sellFade)) : na, title = "L2 sell zone")
fill(p2b, p2o, color = inFills and inL2On ? color.new(cBuy, math.min(100, a2 + buyFade)) : na, title = "L2 buy zone")
p3t = plot(inL3On ? L3.top : na, "L3 range high", color = color.new(cSell, 82), linewidth = 1, display = display.pane)
p3s = plot(inL3On ? L3.sellLo : na, "L3 sell zone floor", color = color.new(#000000, 100), display = display.pane)
p3e = plot(inL3On ? L3.eq : na, "L3 50 %", color = color.new(cEq, 72), linewidth = 1, style = plot.style_circles, display = display.pane)
p3b = plot(inL3On ? L3.buyHi : na, "L3 buy zone ceiling", color = color.new(#000000, 100), display = display.pane)
p3o = plot(inL3On ? L3.bot : na, "L3 range low", color = color.new(cBuy, 82), linewidth = 1, display = display.pane)
fill(p3t, p3s, color = inFills and inL3On ? color.new(cSell, math.min(100, a3 + sellFade)) : na, title = "L3 sell zone")
fill(p3b, p3o, color = inFills and inL3On ? color.new(cBuy, math.min(100, a3 + buyFade)) : na, title = "L3 buy zone")
// the leg's 50 % (the retracement midpoint of the current impulse)
plot(inLeg50 and dr.state != 0 ? dr.leg50 : na, "Leg 50 %", color = color.new(cEq, 20), linewidth = 1, style = plot.style_circles, display = display.pane)
// the trade window (soft time shade, only when the window is on)
bgcolor(inWinOn and inWinShade and inWin ? color.new(cEq, 94) : na, title = "Trade window")
// chart swings (the direction engine's last swing high / low)
plot(inShowSwings ? dr.swHi : na, "Swing high", color = color.new(dr.hiBroken ? #5B6472 : cSell, 55), linewidth = 1, style = plot.style_stepline, display = display.pane)
plot(inShowSwings ? dr.swLo : na, "Swing low", color = color.new(dr.loBroken ? #5B6472 : cBuy, 55), linewidth = 1, style = plot.style_stepline, display = display.pane)
// trade levels
bool inT = t.dir != 0
plot(inT ? t.entry : na, "Entry", color = color.new(#A9B8FF, 20), linewidth = 1, style = plot.style_linebr, display = display.pane)
plot(inT ? t.sl : na, "Stop", color = color.new(#FF4D6D, 20), linewidth = 1, style = plot.style_linebr, display = display.pane)
plot(inT ? t.tp : na, "Target", color = color.new(#22C55E, 20), linewidth = 1, style = plot.style_linebr, display = display.pane)
barcolor(inTint and inT ? color.new(t.dir == 1 ? cBuy : cSell, 15) : inTintLoc and locTint != 0 ? color.new(locTint == 1 ? cSell : cBuy, 40) : na, title = "Trade / location tint")

// layer labels at the right edge
var array<label> zl = array.new<label>()
if barstate.isfirst
    for i = 0 to 6
        array.push(zl, label.new(bar_index, close, "", style = label.style_label_left, color = color.new(th.bg, 100), textcolor = th.txt, size = size.tiny))
if barstate.islast
    int k = 0
    for L in layers
        label ls = array.get(zl, k * 2)
        label lb = array.get(zl, k * 2 + 1)
        bool show = inZoneLabels and L.on and not na(L.top)
        string ageTxt = L.mode == "Rolling window" ? str.tostring(L.nBars * chartSec / 3600.0, "#.#") + " h" : L.mode == "Swing range" ? "swings" : "prev day"
        label.set_xy(ls, bar_index + 2, show ? (L.top + L.sellLo) / 2 : close)
        label.set_text(ls, show ? L.name + " sell ≥ " + fmt(L.sellLo) : "")
        label.set_textcolor(ls, color.new(cSell, math.min(90, k * 20 + sellFade)))
        label.set_xy(lb, bar_index + 2, show ? (L.bot + L.buyHi) / 2 : close)
        label.set_text(lb, show ? L.name + " buy ≤ " + fmt(L.buyHi) : "")
        label.set_textcolor(lb, color.new(cBuy, math.min(90, k * 20 + buyFade)))
        k += 1
    label ll = array.get(zl, 6)
    bool showLeg = inLeg50 and dr.state != 0 and not na(dr.leg50)
    label.set_xy(ll, bar_index + 2, showLeg ? dr.leg50 : close)
    label.set_text(ll, showLeg ? "leg 50 % " + fmt(dr.leg50) : "")
    label.set_textcolor(ll, color.new(cEq, 15))

// RIMC range boxes
var array<box> rBoxes = array.new<box>()
if barstate.isconfirmed and inShowRanges != "Off"
    if ev.rangeFormed
        rm.bx := box.new(rm.startBar, rm.top, bar_index, rm.bot, border_color = color.new(th.flat, 40), border_width = 1, bgcolor = color.new(th.flat, 86))
        array.push(rBoxes, rm.bx)
        int keep = inShowRanges == "Last 10" ? 10 : 60
        while array.size(rBoxes) > keep
            box.delete(array.shift(rBoxes))
    else if not na(rm.bx) and rm.phase != 0
        box.set_right(rm.bx, bar_index)
        box.set_top(rm.bx, rm.top)
        box.set_bottom(rm.bx, rm.bot)
        if rm.phase == 2
            color ic = rm.initDir == 1 ? th.up : th.down
            box.set_border_color(rm.bx, color.new(ic, 30))
            box.set_bgcolor(rm.bx, color.new(ic, 84))
    else if not na(rm.bx) and rm.phase == 0 and rm.lastPhase != 0
        box.set_right(rm.bx, bar_index)
        if rm.endWhy == "mitigated → entry"
            box.set_bgcolor(rm.bx, color.new(t.dir == 1 ? th.up : th.down, 78))
        else
            box.set_bgcolor(rm.bx, color.new(th.flat, 93))
            box.set_border_color(rm.bx, color.new(th.flat, 70))

// gradient risk / reward zones
var array<box> zones = array.new<box>()
var array<box> liveZ = array.new<box>()
gradBand(float top, float bot, color c, int x1, int x2, bool denseTop) =>
    float h = (top - bot) / 4
    for k = 0 to 3
        float bTop = top - h * k
        float bBot = bTop - h
        int alpha = denseTop ? 88 + k * 2 : 96 - k * 2
        box b = box.new(x1, bTop, x2, bBot, border_color = color.new(c, 100), bgcolor = color.new(c, alpha))
        array.push(zones, b)
        array.push(liveZ, b)
if barstate.isconfirmed
    if (ev.sigL or ev.sigS) and inZones
        for b in zones
            box.delete(b)
        array.clear(zones)
        array.clear(liveZ)
        int d = t.dir
        gradBand(math.max(t.entry, t.sl), math.min(t.entry, t.sl), th.down, bar_index, bar_index + 1, d == 1)
        gradBand(math.max(t.entry, t.tp), math.min(t.entry, t.tp), th.up, bar_index, bar_index + 1, d == -1)
    else if (t.dir != 0 or ev.exit) and array.size(liveZ) > 0
        for b in liveZ
            box.set_right(b, bar_index)

// event labels
if inShowSwings and ev.dirChange and dr.state != 0
    label.new(bar_index, dr.state == 1 ? low : high, dr.state == 1 ? "▲ bullish" + (dr.initiated ? " · initiation" : "") : "▼ bearish" + (dr.initiated ? " · initiation" : ""), style = dr.state == 1 ? label.style_label_up : label.style_label_down, color = color.new(th.bg, 20), textcolor = dr.state == 1 ? th.up : th.down, size = size.tiny)
if ev.initiated
    label.new(bar_index, rm.initDir == 1 ? low : high, rm.initDir == 1 ? "I ▲" : "I ▼", style = rm.initDir == 1 ? label.style_label_up : label.style_label_down, color = color.new(th.bg, 30), textcolor = rm.initDir == 1 ? th.up : th.down, size = size.tiny, tooltip = "RIMC initiation: a close beyond the range by at least " + str.tostring(inInitMult, "0.0") + " × its height — waiting for the mitigation")
if ev.sigL
    label.new(bar_index, low, "M ▲ long " + fmt(t.entry) + " · " + t.locTxt + "\nstop " + fmt(t.sl) + " · target " + fmt(t.tp) + (sizeTxt != "" ? "\n" + sizeTxt : ""), style = label.style_label_up, color = color.new(th.up, 12), textcolor = th.bg, size = size.small, tooltip = "Mitigation entry: price came back into the range after a bullish initiation, in a buy location, with the direction bullish. Stop below the range, target " + tpModeTxt + ".")
if ev.sigS
    label.new(bar_index, high, "M ▼ short " + fmt(t.entry) + " · " + t.locTxt + "\nstop " + fmt(t.sl) + " · target " + fmt(t.tp) + (sizeTxt != "" ? "\n" + sizeTxt : ""), style = label.style_label_down, color = color.new(th.down, 12), textcolor = th.bg, size = size.small, tooltip = "Mitigation entry: price came back into the range after a bearish initiation, in a sell location, with the direction bearish. Stop above the range, target " + tpModeTxt + ".")
if ev.skipped
    label.new(bar_index, ev.dir == 1 ? low : high, "mitigated · " + ev.skipWhy, style = ev.dir == 1 ? label.style_label_up : label.style_label_down, color = color.new(th.bg, 15), textcolor = th.flat, size = size.tiny)
if ev.exit
    string rTxt = (ev.r >= 0 ? "+" : "") + str.tostring(ev.r, "0.0") + "R"
    string whyTxt = ev.why == "TP" ? "target" : ev.why == "EOD" ? "flat at the window end" : ev.why == "BE" ? "breakeven" : "stop"
    label.new(bar_index, ev.dir == 1 ? high : low, (ev.dir == 1 ? "exit long · " : "exit short · ") + whyTxt + " " + rTxt, style = ev.dir == 1 ? label.style_label_down : label.style_label_up, color = color.new(th.bg, 15), textcolor = ev.r >= 0 ? th.up : th.down, size = size.tiny)

// ─────────────────────────────────────────────────────────────────── DASHBOARD
posOf(string p) =>
    p == "Top Left" ? position.top_left : p == "Bottom Right" ? position.bottom_right : p == "Bottom Left" ? position.bottom_left : p == "Middle Right" ? position.middle_right : p == "Middle Left" ? position.middle_left : position.top_right
szLead() => inSize == "Small" ? size.small : inSize == "Large" ? size.large  : size.normal
szBody() => inSize == "Small" ? size.tiny  : inSize == "Large" ? size.normal : size.small
szSub()  => inSize == "Small" ? size.tiny  : inSize == "Large" ? size.small  : size.tiny
row3(table tb, int r, string k, string mark, color markCol, string why, color whyCol) =>
    color stripe = r % 2 == 1 ? color.new(th.accent, 94) : th.bg
    table.cell(tb, 0, r, k, text_color = th.flat, text_size = szBody(), text_halign = text.align_left, bgcolor = stripe)
    table.cell(tb, 1, r, mark, text_color = markCol, text_size = szBody(), text_halign = text.align_center, bgcolor = stripe)
    table.cell(tb, 2, r, why, text_color = whyCol, text_size = szBody(), text_halign = text.align_left, text_font_family = font.family_monospace, bgcolor = stripe)
section(table tb, int r, string title) =>
    table.cell(tb, 0, r, title, text_color = th.accent, text_size = szSub(), text_halign = text.align_left, bgcolor = color.new(th.accent, 90))
    table.cell(tb, 1, r, "", bgcolor = color.new(th.accent, 90))
    table.cell(tb, 2, r, "", bgcolor = color.new(th.accent, 90))
    table.merge_cells(tb, 0, r, 2, r)
locColor(int lc) => lc == 2 ? th.sellZ : lc == -2 ? th.buyZ : lc == 0 ? th.accentHi : th.txt
locMark(int lc) => lc == 2 ? "▼" : lc == -2 ? "▲" : lc == 0 ? "◆" : lc == 9 ? "" : "·"
gauge(float pos) =>
    // twelve cells: buy zone · middle · sell zone, the price marked ● — the location at a glance
    int zc = math.max(1, math.round(12 * inZonePct / 100.0))
    int p  = na(pos) ? -1 : math.round(math.min(math.max(pos, 0), 100) / 100 * 11)
    string g = ""
    for i = 0 to 11
        g := g + (i == p ? "●" : i < zc ? "▒" : i >= 12 - zc ? "▒" : "·")
    g
layerRow(table tb, int r, Layer L) =>
    string rng = na(L.top) ? "not ready yet" : fmt(L.bot) + " – " + fmt(L.top)
    string desc = L.mode == "Rolling window" ? str.tostring(L.nBars * chartSec / 3600.0, "#.#") + " h" : L.mode == "Swing range" ? "swings" : "prev day"
    row3(tb, r, L.name + " · " + desc, locMark(L.loc), locColor(L.loc), na(L.top) ? "not ready yet" : gauge(L.pos) + " " + locWord(L.loc) + " · " + str.tostring(L.pos, "#") + " % · " + rng, locColor(L.loc))

var table dash = table.new(posOf(inDashPos), 3, 24, bgcolor = th.bg, frame_color = th.frame, frame_width = 1, border_width = 0, force_overlay = false)
if barstate.islast and inDash
    table.clear(dash, 0, 0, 2, 23)
    int r = 0
    table.cell(dash, 0, r, "LOCATION DESK", text_color = th.accentHi, text_size = szLead(), text_halign = text.align_left, bgcolor = th.bg, tooltip = "Direction first, location second, execution last. Every decision commits on the closed bar.")
    table.cell(dash, 1, r, "", bgcolor = th.bg)
    table.cell(dash, 2, r, syminfo.ticker + " · " + timeframe.period + " · " + hhmm, text_color = th.accent, text_size = szSub(), text_halign = text.align_right, bgcolor = th.bg)
    r += 1
    table.cell(dash, 0, r, (t.dir == 1 ? "▲ " : t.dir == -1 ? "▼ " : readCode == -2 ? "▼ " : readCode == 2 ? "▲ " : "● ") + stateWord, text_color = stateCol, text_size = szLead(), text_halign = text.align_left, bgcolor = th.bg, tooltip = "The read: the chart's direction combined with where price sits in each layer's range.")
    table.cell(dash, 1, r, "", bgcolor = th.bg)
    color chipBg = t.dir != 0 ? color.new(openR >= 0 ? th.up : th.down, 75) : dy.trades > 0 ? color.new(dy.todayR >= 0 ? th.up : th.down, 75) : color.new(stateCol, 80)
    table.cell(dash, 2, r, chipTxt, text_color = th.txtHi, text_size = szBody(), text_halign = text.align_right, bgcolor = chipBg)
    r += 1
    section(dash, r, "DIRECTION · CHART STRUCTURE")
    r += 1
    row3(dash, r, "Structure", dr.state == 1 ? "▲" : dr.state == -1 ? "▼" : "·", dr.state == 1 ? th.up : dr.state == -1 ? th.down : th.flat, dirWord + sinceTxt + (dr.state != 0 and dr.initiated ? " · initiation" : "") + (na(dr.swHi) ? "" : " · swings " + fmt(dr.swHi) + (dr.hiBroken ? "✗" : "") + " / " + fmt(dr.swLo) + (dr.loBroken ? "✗" : "")), th.txt)
    r += 1
    if inLeg50 and dr.state != 0 and not na(dr.leg50)
        bool atLeg = math.abs(close - dr.leg50) <= math.abs(dr.legExt - dr.legOrigin) * inContPct / 100
        row3(dash, r, "Leg 50 %", atLeg ? "◆" : "·", atLeg ? th.accentHi : th.flat, fmt(dr.leg50) + " · leg " + fmt(dr.legOrigin) + " → " + fmt(dr.legExt) + (atLeg ? " · price is here — continuation location" : ""), atLeg ? th.accentHi : th.txt)
        r += 1
    section(dash, r, "LOCATION · " + str.tostring(nOn) + (nOn == 1 ? " LAYER" : " LAYERS") + " · " + (dr.state == -1 ? str.tostring(sellN) + " SAY SELL" : dr.state == 1 ? str.tostring(buyN) + " SAY BUY" : "NO SIDE YET"))
    r += 1
    if L1.on
        layerRow(dash, r, L1)
        r += 1
    if L2.on
        layerRow(dash, r, L2)
        r += 1
    if L3.on
        layerRow(dash, r, L3)
        r += 1
    section(dash, r, "RIMC · RANGE → INITIATION → MITIGATION → CONTINUATION")
    r += 1
    if t.dir == 0
        row3(dash, r, "Setup", rm.phase == 2 ? (rm.initDir == 1 ? "▲" : "▼") : rm.phase == 1 ? "◻" : "·", rm.phase == 2 ? (rm.initDir == 1 ? th.up : th.down) : rm.phase == 1 ? th.accentHi : th.flat, rimcTxt, th.txt)
        r += 1
        row3(dash, r, "Gate", "", th.txt, gateTxt, th.txt)
        r += 1
    else
        row3(dash, r, "Trade", t.dir == 1 ? "▲" : "▼", t.dir == 1 ? th.up : th.down, (t.dir == 1 ? "long " : "short ") + fmt(t.entry) + " · " + t.locTxt + " · " + str.tostring(bar_index - t.bar) + " bars · 1R = " + fmt(t.r), th.txtHi)
        r += 1
        row3(dash, r, "Stop · target", "", th.txt, fmt(t.sl) + (t.beHit ? " (breakeven)" : inStopMode == "Range edge" ? " · beyond the range" : " · beyond the last swing") + " · target " + fmt(t.tp) + " (" + tpModeTxt + ")" + (inWinOn and inEodFlat ? " · flat after " + inWinSess : ""), th.txt)
        r += 1
        if sizeTxt != ""
            row3(dash, r, "Size", "", th.txt, sizeTxt, th.txt)
            r += 1
    if dy.log != ""
        row3(dash, r, "Today", "", th.txt, dy.log, th.txt)
        r += 1
    section(dash, r, "RECORD · PAPER, NO COSTS")
    r += 1
    row3(dash, r, "Setups", "", th.txt, str.tostring(st.nRanges) + " ranges · " + str.tostring(st.nInit) + " initiations · " + str.tostring(st.nMit) + " entries · " + str.tostring(st.nSkip) + " mitigations skipped by the gate", th.txt)
    r += 1
    row3(dash, r, "Closed", "", th.txt, st.n == 0 ? "no closed trades yet" : str.tostring(st.n) + " · " + str.tostring(math.round(st.wins / st.n * 100)) + "% won · avg " + (st.sumR / st.n >= 0 ? "+" : "") + str.tostring(st.sumR / st.n, "0.00") + "R · target " + str.tostring(st.nTp) + " · stop " + str.tostring(st.nStop) + " · BE " + str.tostring(st.nBe) + " · flat " + str.tostring(st.nEod) + (na(t.lastR) ? "" : " · last " + (t.lastR >= 0 ? "+" : "") + str.tostring(t.lastR, "0.0") + "R"), st.n > 0 and st.sumR >= 0 ? th.up : st.n > 0 ? th.down : th.txt)
    r += 1
    table.cell(dash, 0, r, "zones " + str.tostring(inZonePct) + " % · layers " + str.tostring(inLayersReq) + (inNeedDir ? " · direction first" : "") + " · focus " + (inFocus == "Follow direction" ? "follows direction" : str.lower(inFocus)), text_color = th.flat, text_size = szSub(), text_halign = text.align_left, bgcolor = th.bg)
    table.cell(dash, 1, r, "", bgcolor = th.bg)
    table.cell(dash, 2, r, "RIMC " + str.tostring(inRimcBars) + " bars ≤ " + str.tostring(inRimcAtr, "0.0") + " ATR · init ≥ " + str.tostring(inInitMult, "0.0") + "× · target " + tpModeTxt + (inWinOn ? " · " + inWinSess : ""), text_color = th.flat, text_size = szSub(), text_halign = text.align_right, bgcolor = th.bg)

// ─────────────────────────────────────────────────────────────────── CO-PILOT
wrap(string s, int width) =>
    array<string> words = str.split(s, " ")
    string out = ""
    string line = ""
    for w in words
        if str.length(line) + str.length(w) + 1 > width and line != ""
            out := out + line + "\n"
            line := w
        else
            line := line == "" ? w : line + " " + w
    out + line
layersTxt() =>
    string o = ""
    for L in layers
        if L.on and not na(L.top)
            o := o + (o == "" ? "" : ", ") + L.name + " " + locWord(L.loc) + " (" + str.tostring(L.pos, "#") + " %)"
    o
narrNow() =>
    string o = ""
    if t.dir != 0
        o := "in a " + (t.dir == 1 ? "long" : "short") + " from " + fmt(t.entry) + " (" + t.locTxt + ") for " + str.tostring(bar_index - t.bar) + " bars, " + (openR >= 0 ? "+" : "") + str.tostring(openR, "0.0") + "R at this close — stop " + fmt(t.sl) + (t.beHit ? " (breakeven)" : " beyond the range") + ", target " + fmt(t.tp)
    else
        o := "the chart is " + dirWord + sinceTxt + "; price sits at " + layersTxt() + " — " + (readCode == -2 ? "a sell location with a bearish direction: look for sells, not chase" : readCode == 2 ? "a buy location with a bullish direction: look for buys, not chase" : readCode == -3 ? "bearish but in a buy location: selling here is low probability" : readCode == 3 ? "bullish but in a sell location: no chase, and sells need a change of direction first" : readCode == -4 ? "a sell location on a higher layer, but the nearest layer has price at its low — wait for the pullback before selling" : readCode == 4 ? "a buy location on a higher layer, but the nearest layer has price at its high — wait for the pullback before buying" : readCode == -1 ? "bearish, but not at a sell location yet — wait for the pullback (the 50 % band or the red zone)" : readCode == 1 ? "bullish, but not at a buy location yet — wait for the pullback (the 50 % band or the green zone)" : dr.bias == 0 ? "no structure break yet, nothing to lean on" : "sideways: no new break, price inside the swings — wait for direction") + "" + (inLeg50 and dr.state != 0 and not na(dr.leg50) ? "; the leg's 50 % is at " + fmt(dr.leg50) : "") + "; RIMC: " + rimcTxt
    o + (dy.log != "" ? "; today so far: " + dy.log : "")
narrWhy() =>
    "Location: price relatively high inside the observed range is where sells are hunted, relatively low is where buys are — buying low and selling high made mechanical; the 50 % line is where continuations pull back to after an initiation. Direction first: the location says where to be interested, the chart's structure says which side; a red zone with a bullish structure is not a sell, it is a place to wait. Layers: when the 5-minute, 15-minute and 1-hour locations agree, the decision is stronger. RIMC: a range is where orders were built, the initiation shows their intention, the mitigation is price coming back to them — the entry — and the continuation is the move that pays."
narrPlan() =>
    string o = ""
    if t.dir != 0
        o := "Stop first on every closed bar. Target " + fmt(t.tp) + " (" + tpModeTxt + ")" + (inBeAt > 0 ? "; the stop moves to breakeven at " + str.tostring(inBeAt, "0.0") + "R" : "") + (inWinOn and inEodFlat ? "; whatever is open closes on the first bar after " + inWinSess : "") + ". The idea is wrong beyond " + fmt(t.sl0) + "." + (sizeTxt != "" ? " Size: " + sizeTxt + "." : "")
    else
        o := "A trade needs: " + (inNeedDir ? "the chart's direction, " : "") + "a " + (dr.state == 1 ? "buy" : dr.state == -1 ? "sell" : "same-side") + " location on " + str.tostring(inLayersReq) + (inLayersReq == 1 ? " layer" : " layers") + ", a range of " + str.tostring(inRimcBars) + " bars inside " + str.tostring(inRimcAtr, "0.0") + " ATR, an initiation of at least " + str.tostring(inInitMult, "0.0") + " × the range, and the mitigation within " + str.tostring(inMitWithin) + " bars. Then: entry at the " + (inMitMode == "First touch" ? "close of the first bar that touches the range" : "first close back inside the range") + ", stop beyond " + (inStopMode == "Range edge" ? "the far side" : "the last swing") + " plus " + str.tostring(inStopBuf, "0.00") + " ATR, target " + tpModeTxt + (inWinOn ? ", inside " + inWinSess + " " + inTz : "") + ". " + str.tostring(inMaxTrades) + " trade" + (inMaxTrades == 1 ? "" : "s") + " per day."
    o
narrTrack() =>
    st.n < 5 ? "Too few closed trades on this chart to say anything yet (" + str.tostring(st.nRanges) + " ranges, " + str.tostring(st.nInit) + " initiations seen)." : str.tostring(st.n) + " paper trades from " + str.tostring(st.nInit) + " initiations: " + str.tostring(math.round(st.wins / st.n * 100)) + "% won, avg " + (st.sumR / st.n >= 0 ? "+" : "") + str.tostring(st.sumR / st.n, "0.00") + "R; " + str.tostring(st.nTp) + " reached the target, " + str.tostring(st.nStop) + " stopped, " + str.tostring(st.nBe) + " breakeven, " + str.tostring(st.nEod) + " flat at the window end; " + str.tostring(st.nSkip) + " mitigations skipped by the gate. No costs, small sample — a description of the past on THIS chart, not an edge."
narrPosOf(string p) =>
    p == "Top Left" ? position.top_left : p == "Top Right" ? position.top_right : p == "Bottom Right" ? position.bottom_right : p == "Middle Left" ? position.middle_left : p == "Middle Right" ? position.middle_right : position.bottom_left
narrBodySz() => inNarrSize == "Small" ? size.small : inNarrSize == "Medium" ? size.normal : inNarrSize == "Large" ? size.large : szBody()
narrHeadSz() => inNarrSize == "Small" ? size.normal : inNarrSize == "Medium" ? size.large : inNarrSize == "Large" ? size.large : szLead()

var table narrT = na
if barstate.islast
    if not na(narrT)
        table.delete(narrT)
        narrT := na
    if inNarr != "Off"
        array<string> labs = array.new<string>()
        array<string> vals = array.new<string>()
        array.push(labs, "NOW")
        array.push(vals, wrap(narrNow() + " (context, not a trade instruction)", inNarrWrap))
        bool deep = inNarr == "Standard" or inNarr == "Detailed"
        if deep
            array.push(labs, "WHY")
            array.push(vals, wrap(narrWhy(), inNarrWrap))
            array.push(labs, "PLAN")
            array.push(vals, wrap(narrPlan(), inNarrWrap))
        if inNarr == "Detailed"
            array.push(labs, "TRACK REC")
            array.push(vals, wrap(narrTrack(), inNarrWrap))
            array.push(labs, "GLOSSARY")
            array.push(vals, wrap("Location = where price sits inside the observed range: the top part is the sell location (premium), the bottom part the buy location (discount), the 50 % line the equilibrium. Layer = one observation timeframe's range. Stacked = two or more layers agree. Initiation = a break with a real body. RIMC = Range, Initiation, Mitigation, Continuation — the entry is the mitigation, price coming back into the range it left.", inNarrWrap))
        int nr = array.size(labs)
        bool atBottom = inNarrPos == "Bottom Left" or inNarrPos == "Bottom Right"
        int rows = nr + 2 + (atBottom ? 1 : 0)
        narrT := table.new(narrPosOf(inNarrPos), 2, rows, bgcolor = th.bg, frame_color = th.frame, frame_width = 1, border_color = color.new(th.frame, 70), border_width = 1)
        table.cell(narrT, 0, 0, "◆ CO-PILOT", text_color = th.accentHi, bgcolor = color.new(th.accent, 88), text_size = narrHeadSz(), text_halign = text.align_left)
        table.cell(narrT, 1, 0, stateWord + " · " + str.upper(inNarr), text_color = th.accent, bgcolor = color.new(th.accent, 88), text_size = narrBodySz(), text_halign = text.align_right)
        for i = 0 to nr - 1
            table.cell(narrT, 0, i + 1, array.get(labs, i), text_color = th.accent, bgcolor = th.bg, text_size = narrBodySz(), text_halign = text.align_left, text_valign = text.align_top)
            table.cell(narrT, 1, i + 1, array.get(vals, i), text_color = th.txt, bgcolor = th.bg, text_size = narrBodySz(), text_halign = text.align_left, text_valign = text.align_top)
        table.cell(narrT, 0, nr + 1, "", bgcolor = th.bg)
        table.cell(narrT, 1, nr + 1, "Honest: a location is where price is relatively high or low, not a promise. The record has no costs — measure before you trust it.", text_color = th.flat, bgcolor = th.bg, text_size = narrBodySz(), text_halign = text.align_left)
        if atBottom
            table.cell(narrT, 0, nr + 2, " ", bgcolor = th.bg)
            table.cell(narrT, 1, nr + 2, " ", bgcolor = th.bg)

// ─────────────────────────────────────────────────────────────────── ALERTS (confirmed bars only by construction)
payload(string evName, string why) =>
    string js = '{"src":"LocationDesk","symbol":"' + syminfo.ticker + '","tf":"' + timeframe.period + '","event":"' + evName + '","direction":"' + dirWord + '","read":"' + stateWord + '","layers":"' + layersTxt() + '","side":"' + (t.dir == 1 or ev.dir == 1 ? "LONG" : t.dir == -1 or ev.dir == -1 ? "SHORT" : "NONE") + '","entry":' + fmt(nz(t.entry, close)) + ',"sl":' + fmt(nz(t.sl, 0)) + ',"tp":' + fmt(nz(t.tp, 0)) + ',"reason":"' + why + '"' + (na(ev.r) ? "" : ',"r":' + str.tostring(ev.r, "0.00")) + '}'
    string tx = "Location Desk · " + syminfo.ticker + " " + timeframe.period + " · " + evName + " · " + stateWord + " · " + layersTxt() + (why != "" ? " · " + why : "")
    inAlertJson ? js : tx
alertcondition(ev.lookSell, "Read: LOOK FOR SELLS", "Location Desk: bearish direction + a sell location — look for sells")
alertcondition(ev.lookBuy, "Read: LOOK FOR BUYS", "Location Desk: bullish direction + a buy location — look for buys")
alertcondition(ev.enterSell, "Entered a sell location", "Location Desk: price entered a sell location (top of a layer's range)")
alertcondition(ev.enterBuy, "Entered a buy location", "Location Desk: price entered a buy location (bottom of a layer's range)")
alertcondition(ev.enterEq, "50 % pullback after an initiation", "Location Desk: price pulled back into the 50 % band with the direction set — continuation location")
alertcondition(ev.stacked, "Stacked location", "Location Desk: two or more layers put price in the same-side location with the direction agreeing")
alertcondition(ev.dirChange, "Direction changed", "Location Desk: the chart's structure changed (bullish / bearish / sideways)")
alertcondition(ev.rangeFormed, "RIMC range formed", "Location Desk: a range formed — watching for the initiation")
alertcondition(ev.initiated, "RIMC initiation", "Location Desk: price initiated away from the range — the mitigation is the entry")
alertcondition(ev.sigL, "RIMC long", "Location Desk: long at the mitigation in a buy location")
alertcondition(ev.sigS, "RIMC short", "Location Desk: short at the mitigation in a sell location")
alertcondition(ev.skipped, "Mitigation skipped by the gate", "Location Desk: price mitigated the range but the read did not allow the trade")
alertcondition(ev.exit and ev.why == "TP", "Target reached", "Location Desk: target reached")
alertcondition(ev.exit and (ev.why == "SL" or ev.why == "BE"), "Stopped", "Location Desk: stop hit")
alertcondition(ev.exit and ev.why == "EOD", "Flat at the window end", "Location Desk: the trade window ended — position closed")
if ev.lookSell
    alert(payload("LOOK_FOR_SELLS", ""), alert.freq_once_per_bar_close)
if ev.lookBuy
    alert(payload("LOOK_FOR_BUYS", ""), alert.freq_once_per_bar_close)
if ev.enterSell
    alert(payload("ENTER_SELL_LOCATION", ""), alert.freq_once_per_bar_close)
if ev.enterBuy
    alert(payload("ENTER_BUY_LOCATION", ""), alert.freq_once_per_bar_close)
if ev.stacked
    alert(payload("STACKED_LOCATION", ""), alert.freq_once_per_bar_close)
if ev.dirChange
    alert(payload("DIRECTION", dirWord), alert.freq_once_per_bar_close)
if ev.initiated
    alert(payload("RIMC_INITIATION", rm.initDir == 1 ? "up" : "down"), alert.freq_once_per_bar_close)
if ev.sigL
    alert(payload("RIMC_LONG", t.locTxt), alert.freq_once_per_bar_close)
if ev.sigS
    alert(payload("RIMC_SHORT", t.locTxt), alert.freq_once_per_bar_close)
if ev.skipped
    alert(payload("MITIGATION_SKIPPED", ev.skipWhy), alert.freq_once_per_bar_close)
if ev.exit
    alert(payload("EXIT", ev.why), alert.freq_once_per_bar_close)
The strategy twin · optional
Use a second chart to measure rules with costs. Its Measurement grid starts at 5R; choose 3 there to match the indicator’s default target.
Copy the code as it is. No coding needed.
View the full code
// ═══════════════════════════════════════════════════════════════════════════════════════════════════════
//  LOCATION DESK — STRATEGY TWIN  ·  Pine Script v6  ·  v1.1.0   (generated from location_desk.pine by tools/gen-twin.mjs)
//  Built for a r/pinescript thread reply ("NJAT location tool!" — "a cloud like band location tool that shows where
//  you should be looking for buys or sells"). Open-source answer to the idea behind it: where is price inside the
//  range of the timeframe you observe — a red band at the top (look for sells), a green band at the bottom (look
//  for buys), the 50 % line for continuation pullbacks — on up to three observation timeframes at once, read
//  together with the chart's structure (direction first, location second), and an RIMC execution
//  (Range → Initiation → Mitigation → Continuation) attached so the whole idea can be measured.
//
//  HOW IT READS THE MARKET (every decision commits on the CLOSED bar — nothing repaints):
//     1 LAYERS     up to three location layers, each an observation timeframe and a range: the rolling window of
//                  that timeframe (default), its last swing high / low, or the previous day. Sell zone = top part
//                  of the range, buy zone = bottom part, 50 % line + a continuation band around it.
//     2 DIRECTION  chart structure: a close above the last swing high = bullish until a close below the last swing
//                  low (and the mirror). The breaking bar with a real body = an initiation. Sideways when no new
//                  break comes and price sits inside the swings.
//     3 THE READ   bearish + a sell location (edge, the 50 % line, or the leg's 50 %) = look for sells; bullish + a buy location =
//                  look for buys; selling in a buy location = low probability; a higher layer's zone against the
//                  chart's direction = wait for the change; mid-range = stand aside. Layers agreeing = stacked.
//     4 RIMC       a small range forms, price initiates away by at least the range's height, comes back and
//                  CLOSES inside it → entry at that close, stop beyond the far side, target in R or at structure
//                  (the initiation extreme, the opposite zone) — only when the read allows that side.
//     FOCUS        the cloud follows the direction: the side you should be looking at draws strong, the other fades.
//
//  Paper ledger has NO costs — a description of the past on your chart. The strategy twin measures it with costs.
//  License: MIT — share freely, keep this header.  © 2026 ProEA Lab · built for r/pinescript
// ═══════════════════════════════════════════════════════════════════════════════════════════════════════
//@version=6
strategy("Location Desk — Strategy Twin", "LocDeskS", overlay = true, initial_capital = 100000, default_qty_type = strategy.fixed, default_qty_value = 1, pyramiding = 0,
     commission_type = strategy.commission.percent, commission_value = 0.02, slippage = 5, process_orders_on_close = true, calc_on_every_tick = false,
     max_labels_count = 400, max_boxes_count = 200, max_lines_count = 200)
// COSTS ARE ON: 0.02% commission per order + 5 ticks slippage per fill (edit the strategy() header for your broker). Quantity = 1 unit.
// Entries fill at the mitigation bar's close (process_orders_on_close) — the same price the paper ledger uses.

// ─────────────────────────────────────────────────────────────────── INPUTS
gL = "Location layers (the cloud) — on · observation timeframe · range · bars of that timeframe"
inL1On   = input.bool(true, "1", inline = "l1", group = gL, display = display.none)
inL1Tf   = input.timeframe("5", "", inline = "l1", group = gL, display = display.none)
inL1Mode = input.string("Rolling window", "", options = ["Rolling window", "Swing range", "Previous day"], inline = "l1", group = gL, display = display.none)
inL1N    = input.int(100, "", minval = 5, maxval = 1000, inline = "l1", group = gL, tooltip = "Layer 1 — the nearest location. Rolling window: the highest high and lowest low of the last N bars of the observation timeframe, computed on this chart's closed bars (identical extremes, no higher-timeframe request, never repaints). Swing range: the last confirmed swing high and swing low of that timeframe. Previous day: yesterday's high and low.", display = display.none)
inL2On   = input.bool(true, "2", inline = "l2", group = gL, display = display.none)
inL2Tf   = input.timeframe("15", "", inline = "l2", group = gL, display = display.none)
inL2Mode = input.string("Rolling window", "", options = ["Rolling window", "Swing range", "Previous day"], inline = "l2", group = gL, display = display.none)
inL2N    = input.int(100, "", minval = 5, maxval = 1000, inline = "l2", group = gL, tooltip = "Layer 2 — the context location (the 15-minute chart in the NJAT videos).", display = display.none)
inL3On   = input.bool(false, "3", inline = "l3", group = gL, display = display.none)
inL3Tf   = input.timeframe("60", "", inline = "l3", group = gL, display = display.none)
inL3Mode = input.string("Rolling window", "", options = ["Rolling window", "Swing range", "Previous day"], inline = "l3", group = gL, display = display.none)
inL3N    = input.int(100, "", minval = 5, maxval = 1000, inline = "l3", group = gL, tooltip = "Layer 3 — the higher-timeframe location.", display = display.none)
inZonePct = input.int(25, "Zone size — top and bottom % of the range", minval = 5, maxval = 50, group = gL, tooltip = "The sell zone is the top N % of the range, the buy zone the bottom N %. 25 = the outer quarters.", display = display.none)
inContPct = input.int(5, "Continuation band — ± % around the 50 % line", minval = 1, maxval = 20, group = gL, tooltip = "The 'relative 50 % location': after an initiation, a pullback into this band is a continuation location.", display = display.none)
inLeg     = input.int(5, "Swing leg for 'Swing range' (bars of the layer's timeframe)", minval = 2, maxval = 50, group = gL, display = display.none)

gDr = "Direction (chart structure)"
inDirLeg   = input.int(5, "Swing leg (bars)", minval = 2, maxval = 50, group = gDr, tooltip = "Swings confirm this many bars late. A close above the last swing high = bullish until a close below the last swing low; the mirror for bearish.", display = display.none)
inInitAtr  = input.float(0.5, "Initiation — the breaking bar's body ≥ N × ATR", minval = 0, maxval = 5, step = 0.1, group = gDr, tooltip = "A break with a real body is an initiation (speed and aggression); a break without one is just a break. The 50 % continuation band counts as a location only after an initiation.", display = display.none)
inSideBars = input.int(60, "Sideways after N bars without a new break (price inside the swings)", minval = 5, maxval = 1000, group = gDr, display = display.none)

gRd = "The read"
inLayersReq = input.int(1, "Layers that must agree for a location", minval = 1, maxval = 3, group = gRd, tooltip = "1 = any layer's zone is a location. 2 = stacked: two layers must put price in the same-side zone (the layering the videos call the highest probability). Measured on gold 15m at 3R: requiring two layers left 4 trades in three months, all stopped — too rare to trade mechanically; keep it as a read, not a gate.", display = display.none)
inContOn    = input.bool(true, "The 50 % band counts as a location (continuation pullbacks)", group = gRd, display = display.none)
inNeedDir   = input.bool(true, "Direction first — only trade with the chart structure", group = gRd, tooltip = "Off = a location alone allows the trade (the initiation's own direction is used). Measured on gold 15m at 3R (profit factor): direction first on 0.54 (16 trades) · off 0.38 (22 trades) — the extra trades were the losing kind.", display = display.none)
inLeg50     = input.bool(true, "Leg 50 % — the midpoint of the current impulse counts as a continuation location", group = gRd, tooltip = "The 'relative 50 %' of the move itself: from the swing the break started at to the extreme reached since. After an initiation, a pullback into ± the continuation band around it is a continuation location (drawn as a dotted line).", display = display.none)
inFocus     = input.string("Follow direction", "Focus — which side of the cloud draws strong", options = ["Follow direction", "Both sides", "Sells only (premium)", "Buys only (discount)"], group = gRd, tooltip = "NJAT: 'set up that premium high probable location' — you look at ONE side once the direction is known. Follow direction: bearish = sell zones strong and buy zones faded, bullish = the mirror, sideways = both. The read and the ledger are unaffected; this is what the chart emphasises.", display = display.none)

gX = "RIMC execution (the measurable rule — paper ledger, the twin measures it with costs)"
inRimcOn     = input.bool(true, "Trade the RIMC entries", group = gX, display = display.none)
inRimcBars   = input.int(6, "Range: the last N bars fit inside …", minval = 3, maxval = 40, group = gX, display = display.none)
inRimcAtr    = input.float(1.2, "… a height of at most N × ATR", minval = 0.3, maxval = 5, step = 0.1, group = gX, display = display.none)
inInitMult   = input.float(1.0, "Initiation: a close beyond the range by ≥ N × its height", minval = 0.2, maxval = 3, step = 0.1, group = gX, tooltip = "'At least the same size as the range, otherwise it may be a sweep of liquidity.' Measured — see the build report.", display = display.none)
inInitWithin = input.int(10, "Initiation must come within N bars after the range", minval = 1, maxval = 100, group = gX, display = display.none)
inMitWithin  = input.int(30, "Mitigation must come within N bars after the initiation", minval = 1, maxval = 300, group = gX, display = display.none)
inMitMode    = input.string("First touch", "Mitigation entry", options = ["First touch", "Close inside the range"], group = gX, tooltip = "First touch = the first bar whose wick comes back into the range is the entry (at its close). Close inside the range = wait for a bar that CLOSES inside the range. Measured on gold 15m at 3R (profit factor): first touch 0.54 (3 of 16 won) · close inside 0.35 (2 of 13) — and with the v1.1 close-inside rule at 5R every one of 13 trades was stopped. First touch is the shipped default.", display = display.none)
inTpMode     = input.string("R multiple", "Target", options = ["R multiple", "Initiation extreme", "Opposite zone (layer 1)"], group = gX, tooltip = "R multiple = the R below. Initiation extreme = the furthest price the initiation reached before the mitigation ('take profit at the next point of structure'). Opposite zone (layer 1) = from a sell location to the buy location of the nearest layer — buy low, sell high across the range. A structure target closer than 1R falls back to the R target. Measured on gold 15m (profit factor): R multiple 3R 0.54 · initiation extreme 0.16 · opposite zone 0.45.", display = display.none)
inR          = input.float(3.0, "  R multiple", minval = 0.5, maxval = 20, step = 0.5, group = gX, tooltip = "NJAT's minimum is 1:5. Measured on gold 15m (profit factor, costs on): 5R 0.43 · 2R 0.49 · 3R 0.54 — 3R is the shipped default; none of them crosses 1.0 on the history we can see. EURUSD 15m at 3R: 0.29 with a 0.02 % commission, 0.73 with slippage only.", display = display.none)
inStopMode   = input.string("Range edge", "Stop", options = ["Range edge", "Last swing beyond the range"], group = gX, tooltip = "Range edge = just beyond the far side of the mitigated range (tight). Last swing beyond the range = NJAT's 'stop above the high': the chart's last swing high (for a short) or swing low (for a long) when it sits beyond the range, else the range edge. Measured on gold 15m at 3R (profit factor): range edge 0.54 · last swing 0.24 — the wider stop was hit just as often and cost more.", display = display.none)
inStopBuf    = input.float(0.1, "  Stop buffer (× ATR beyond the level)", minval = 0, maxval = 2, step = 0.05, group = gX, display = display.none)
inBeAt       = input.float(0.0, "Move the stop to breakeven at N R (0 = off)", minval = 0, maxval = 10, step = 0.5, group = gX, display = display.none)
inMaxTrades  = input.int(3, "Trades per day", minval = 1, maxval = 10, group = gX, display = display.none)
inWinOn      = input.bool(false, "Trade window only", group = gX, tooltip = "NJAT trades the London session, 08:00–10:00 London time. Measured at 3R: gold 15m 2 of 3 trades won (profit factor 1.16) · EURUSD 15m 2 of 3 (0.96, slippage only) — three trades each, which is a story, not a statistic.", display = display.none)
inWinSess    = input.session("0800-1000", "  Window", group = gX, display = display.none)
inTz         = input.string("Europe/London", "  Timezone (IANA)", group = gX, display = display.none)
inEodFlat    = input.bool(true, "  Flat at the end of the window", group = gX, display = display.none)
inRiskUsd    = input.float(0, "Risk per trade in account currency (0 = off, display only)", minval = 0, step = 10, group = gX, display = display.none)

gV = "Style"
inTheme     = input.string("Aurora Neon", "Theme", options = ["Aurora Neon", "Royal Gold", "Colorblind-safe"], group = gV, display = display.none)
inFills     = input.bool(false, "Zone fills (the cloud)", group = gV, display = display.none)
inFillA     = input.int(80, "  Nearest layer's fill transparency (higher layers are paler)", minval = 50, maxval = 97, group = gV, display = display.none)
inZoneLabels = input.bool(true, "Layer labels at the right edge", group = gV, display = display.none)
inShowSwings = input.bool(true, "Chart swings (step lines) and structure marks", group = gV, display = display.none)
inShowRanges = input.string("Last 10", "RIMC range boxes", options = ["All", "Last 10", "Off"], group = gV, display = display.none)
inZones     = input.bool(false, "Gradient risk / reward zones", group = gV, display = display.none)
inTint      = input.bool(true, "Tint candles while a trade is open", group = gV, display = display.none)
inTintLoc   = input.bool(true, "Tint candles while price sits in a location", group = gV, tooltip = "A soft wash on the bars that are inside a sell or buy zone of any layer — the 'am I in a location right now' at a glance. The middle of the range stays uncoloured on purpose: that is the no-man's-land the method tells you to stay out of.", display = display.none)
inWinShade  = input.bool(true, "Shade the trade window (when it is on)", group = gV, display = display.none)

gD = "Dashboard"
inDash      = input.bool(false, "Show the dashboard", group = gD, display = display.none)
inDashPos   = input.string("Top Right", "Position", options = ["Top Right", "Top Left", "Bottom Right", "Bottom Left", "Middle Right", "Middle Left"], group = gD, display = display.none)
inSize      = input.string("Medium", "Size", options = ["Small", "Medium", "Large"], group = gD, display = display.none)

gN = "Co-Pilot (narrative)"
inNarr      = input.string("Off", "Narrative depth", options = ["Off", "Brief", "Standard", "Detailed"], group = gN, tooltip = "Brief = one sentence (NOW). Standard adds WHY and PLAN. Detailed adds the track record and a glossary.", display = display.none)
inNarrPos   = input.string("Bottom Left", "Position", options = ["Bottom Left", "Bottom Right", "Top Left", "Top Right", "Middle Left", "Middle Right"], group = gN, display = display.none)
inNarrSize  = input.string("Auto", "Size", options = ["Auto", "Small", "Medium", "Large"], group = gN, display = display.none)
inNarrWrap  = input.int(64, "Line width (characters)", minval = 30, maxval = 140, group = gN, display = display.none)

gA = "Alerts"
inAlertJson = input.bool(true, "alert() payload as JSON (webhooks)", group = gA, tooltip = "Choose 'Any alert() function call' when creating the alert.", display = display.none)
gM = "Measurement grid (twin only — these override the numeric switches above)"
inGridR    = input.string("5", "R target", options = ["1", "2", "3", "5"], group = gM, display = display.none)
inGridDir  = input.string("On", "Direction first", options = ["On", "Off"], group = gM, display = display.none)
inGridLay  = input.string("1", "Layers required", options = ["1", "2"], group = gM, display = display.none)
inGridWin  = input.string("Off", "Trade window only", options = ["Off", "On"], group = gM, display = display.none)
inGridBe   = input.string("0", "Breakeven at R (0 = off)", options = ["0", "1"], group = gM, display = display.none)
float gridR  = str.tonumber(inGridR)
float gridBe = str.tonumber(inGridBe)
int   gridLay = int(str.tonumber(inGridLay))

// ─────────────────────────────────────────────────────────────────── THEME
type Theme
    color bg       = #0B0E14
    color frame    = #B8923A
    color accent   = #D8B14A
    color accentHi = #E8C25A
    color up       = #2BE7C7
    color down     = #FF3B5C
    color flat     = #6B7280
    color txt      = #D7DCE6
    color txtHi    = #ECEFF5
    color sellZ    = #FF3B5C
    color buyZ     = #2BE7C7
themeOf(string name) =>
    Theme t = Theme.new()
    if name == "Aurora Neon"
        t.bg       := #0E1118
        t.frame    := #2C3A5A
        t.accent   := #7C9CFF
        t.accentHi := #A9B8FF
        t.up       := #2AF0C8
        t.down     := #FF4D6D
        t.flat     := #5B6472
        t.txt      := #E6E9EF
        t.txtHi    := #F2F4F9
        t.sellZ    := #FF4D6D
        t.buyZ     := #22C55E
    else if name == "Colorblind-safe"
        t.bg       := #0E1014
        t.frame    := #3A4150
        t.accent   := #56B4E9
        t.accentHi := #8ED0F5
        t.up       := #E69F00
        t.down     := #0072B2
        t.flat     := #8C92A0
        t.txt      := #E8EAED
        t.txtHi    := #FFFFFF
        t.sellZ    := #0072B2
        t.buyZ     := #E69F00
    t
// The cloud's colours are constants on purpose: a plot with a non-constant colour costs TWO of the 64 plot
// outputs, and three per-bar layers would not fit (that is what broke v1.0). Recolour any line in the Style tab.
const color cSell = #FF4D6D
const color cBuy  = #22C55E
const color cEq   = #7C9CFF
Theme th = themeOf(inTheme)
th.sellZ := cSell
th.buyZ  := cBuy
fmt(float x) => str.tostring(x, format.mintick)
tfOf(string tf) => tf == "" ? timeframe.period : tf
tfName(string tf) =>
    string p = tfOf(tf)
    float n = str.tonumber(p)
    na(n) ? p : n >= 60 and n % 60 == 0 ? str.tostring(n / 60, "#") + "H" : p + "m"

// ─────────────────────────────────────────────────────────────────── ENGINE · series (all ta.* at global scope)
float atr  = ta.atr(14)
float atrU = math.max(nz(atr, syminfo.mintick), syminfo.mintick)
float pdh  = request.security(syminfo.tickerid, "D", high[1], lookahead = barmerge.lookahead_on)
float pdl  = request.security(syminfo.tickerid, "D", low[1], lookahead = barmerge.lookahead_on)
int   chartSec = timeframe.in_seconds(timeframe.period)
// layer windows in chart bars (a layer's timeframe × its bars, expressed in this chart's bars)
int   sec1 = timeframe.in_seconds(tfOf(inL1Tf))
int   sec2 = timeframe.in_seconds(tfOf(inL2Tf))
int   sec3 = timeframe.in_seconds(tfOf(inL3Tf))
int   n1   = math.min(4000, math.max(1, math.round(inL1N * sec1 / chartSec)))
int   n2   = math.min(4000, math.max(1, math.round(inL2N * sec2 / chartSec)))
int   n3   = math.min(4000, math.max(1, math.round(inL3N * sec3 / chartSec)))
int   leg1 = math.max(1, math.round(inLeg * sec1 / chartSec))
int   leg2 = math.max(1, math.round(inLeg * sec2 / chartSec))
int   leg3 = math.max(1, math.round(inLeg * sec3 / chartSec))
float rH1  = ta.highest(high, n1)
float rL1  = ta.lowest(low, n1)
float rH2  = ta.highest(high, n2)
float rL2  = ta.lowest(low, n2)
float rH3  = ta.highest(high, n3)
float rL3  = ta.lowest(low, n3)
float ph1  = ta.pivothigh(high, leg1, leg1)
float pl1  = ta.pivotlow(low, leg1, leg1)
float ph2  = ta.pivothigh(high, leg2, leg2)
float pl2  = ta.pivotlow(low, leg2, leg2)
float ph3  = ta.pivothigh(high, leg3, leg3)
float pl3  = ta.pivotlow(low, leg3, leg3)
float dph  = ta.pivothigh(high, inDirLeg, inDirLeg)
float dpl  = ta.pivotlow(low, inDirLeg, inDirLeg)
float wH   = ta.highest(high, inRimcBars)
float wL   = ta.lowest(low, inRimcBars)
// clock
int    nowMin = hour(time, inTz) * 60 + minute(time, inTz)
string hhmm   = str.tostring(hour(time, inTz), "00") + ":" + str.tostring(minute(time, inTz), "00")
bool   inWin  = inGridWin == "Off" or not na(time(timeframe.period, inWinSess, inTz))
bool   winEnd = inGridWin == "On" and not inWin and inWin[1]
bool   newDay = dayofmonth(time, inTz) != dayofmonth(time[1], inTz)

// ─────────────────────────────────────────────────────────────────── STATE
type Layer
    bool   on = false
    string name = ""
    string mode = ""
    float  top = na
    float  bot = na
    float  swH = na
    float  swL = na
    float  sellLo = na
    float  buyHi = na
    float  eq = na
    float  cHi = na
    float  cLo = na
    int    loc = 9         // +2 sell zone (or above) · +1 upper half · 0 the 50 % band · -1 lower half · -2 buy zone (or below) · 9 not ready
    float  pos = na        // where price sits, % of the range (0 = the low, 100 = the high)
    int    nBars = 0
type Dir
    float swHi = na
    float swLo = na
    int   swHiBar = na
    int   swLoBar = na
    bool  hiBroken = false
    bool  loBroken = false
    int   bias = 0
    int   state = 0        // -1 bearish · 0 no direction / sideways · +1 bullish
    int   breakBar = na
    int   breakTime = na
    int   breaks = 0
    bool  initiated = false
    float legOrigin = na
    float legExt = na
    float leg50 = na
    int   readPrev = 0
type Rimc
    int   phase = 0        // 0 idle · 1 range formed · 2 initiated, waiting for the mitigation
    int   lastPhase = 0
    float top = na
    float bot = na
    int   startBar = na
    int   lastIn = na
    int   initDir = 0
    int   initBar = na
    float initExt = na
    int   n = 0
    box   bx = na
    string endWhy = ""
type Trade
    int    dir = 0
    float  entry = na
    float  sl = na
    float  sl0 = na
    float  r = na
    float  tp = na
    int    bar = na
    bool   beHit = false
    float  lastR = na
    string lastWhy = ""
    string locTxt = ""
type Stat
    int   n = 0
    int   wins = 0
    float sumR = 0.0
    int   nTp = 0
    int   nStop = 0
    int   nBe = 0
    int   nEod = 0
    int   nRanges = 0
    int   nInit = 0
    int   nMit = 0
    int   nSkip = 0
    int   days = 0
type Day
    int    trades = 0
    float  todayR = 0.0
    string log = ""
    int    dayNo = 0
type Ev
    bool   sigL = false
    bool   sigS = false
    bool   exit = false
    bool   be = false
    bool   rangeFormed = false
    bool   initiated = false
    bool   mitigated = false
    bool   skipped = false
    bool   dirChange = false
    bool   enterSell = false
    bool   enterBuy = false
    bool   enterEq = false
    bool   stacked = false
    bool   lookSell = false
    bool   lookBuy = false
    string why = ""
    string skipWhy = ""
    float  r = na
    int    dir = 0
var Layer L1 = Layer.new()
var Layer L2 = Layer.new()
var Layer L3 = Layer.new()
var array<Layer> layers = array.from(L1, L2, L3)
var Dir   dr = Dir.new()
var Rimc  rm = Rimc.new()
var Trade t  = Trade.new()
var Stat  st = Stat.new()
var Day   dy = Day.new()
Ev ev = Ev.new()

// ─────────────────────────────────────────────────────────────────── LAYERS (geometry every bar; swings commit on closed bars)
layerUpdate(Layer L, bool on, string tf, string mode, int nB, float rH, float rL, float ph, float pl) =>
    L.on := on
    L.name := tfName(tf)
    L.mode := mode
    L.nBars := nB
    if barstate.isconfirmed
        if not na(ph)
            L.swH := ph
        if not na(pl)
            L.swL := pl
    float top = mode == "Rolling window" ? rH : mode == "Swing range" ? (na(L.swH) or na(L.swL) ? na : math.max(L.swH, L.swL)) : pdh
    float bot = mode == "Rolling window" ? rL : mode == "Swing range" ? (na(L.swH) or na(L.swL) ? na : math.min(L.swH, L.swL)) : pdl
    L.top := top
    L.bot := bot
    float h = top - bot
    L.sellLo := top - h * inZonePct / 100
    L.buyHi  := bot + h * inZonePct / 100
    L.eq     := (top + bot) / 2
    L.cHi    := L.eq + h * inContPct / 100
    L.cLo    := L.eq - h * inContPct / 100
    L.pos    := na(top) or na(bot) or h <= 0 ? na : (close - bot) / h * 100
    L.loc    := na(top) or na(bot) or h <= 0 ? 9 : close >= L.sellLo ? 2 : close <= L.buyHi ? -2 : close <= L.cHi and close >= L.cLo ? 0 : close > L.eq ? 1 : -1
    L
locAt(Layer L, float px) =>
    na(L.top) or na(L.bot) or L.top <= L.bot ? 9 : px >= L.sellLo ? 2 : px <= L.buyHi ? -2 : px <= L.cHi and px >= L.cLo ? 0 : px > L.eq ? 1 : -1
layerUpdate(L1, inL1On, inL1Tf, inL1Mode, n1, rH1, rL1, ph1, pl1)
layerUpdate(L2, inL2On, inL2Tf, inL2Mode, n2, rH2, rL2, ph2, pl2)
layerUpdate(L3, inL3On, inL3Tf, inL3Mode, n3, rH3, rL3, ph3, pl3)

// ─────────────────────────────────────────────────────────────────── DIRECTION + RIMC (closed bars only)
logEv(string what) =>
    string e = hhmm + " " + what
    dy.log := dy.log == "" ? e : dy.log + " │ " + e
    array<string> ps = str.split(dy.log, " │ ")
    if array.size(ps) > 3
        string o = ""
        for i = array.size(ps) - 3 to array.size(ps) - 1
            o := o + (o == "" ? "" : " │ ") + array.get(ps, i)
        dy.log := o

// how many layers put a price in a location for side d (edge, or the 50 % band after an initiation in that direction)
alignedAt(int d, float px, bool contOk) =>
    int n = 0
    for L in layers
        if L.on
            int lc = locAt(L, px)
            if (d == -1 and lc == 2) or (d == 1 and lc == -2) or (contOk and lc == 0)
                n += 1
    if contOk and inLeg50 and not na(dr.leg50) and not na(dr.legOrigin) and not na(dr.legExt)
        float legH = math.abs(dr.legExt - dr.legOrigin)
        if legH > 0 and math.abs(px - dr.leg50) <= legH * inContPct / 100
            n += 1
    n
edgeAt(int d, float px) =>
    int n = 0
    for L in layers
        if L.on
            int lc = locAt(L, px)
            if (d == -1 and lc == 2) or (d == 1 and lc == -2)
                n += 1
    n
locWord(int lc) => lc == 2 ? "sell location" : lc == -2 ? "buy location" : lc == 0 ? "50 % band" : lc == 1 ? "upper half" : lc == -1 ? "lower half" : "not ready"

closeTrade(float px, string why) =>
    float rr = (px - t.entry) * t.dir / t.r
    ev.exit := true
    ev.why := why
    ev.r := rr
    ev.dir := t.dir
    st.n := st.n + 1
    st.wins := st.wins + (rr >= 0.05 ? 1 : 0)
    st.sumR := st.sumR + rr
    if why == "TP"
        st.nTp := st.nTp + 1
    else if why == "EOD"
        st.nEod := st.nEod + 1
    else if why == "BE"
        st.nBe := st.nBe + 1
    else
        st.nStop := st.nStop + 1
    dy.todayR := dy.todayR + rr
    logEv((why == "TP" ? "target " : why == "EOD" ? "flat " : why == "BE" ? "breakeven " : "stop ") + (rr >= 0 ? "+" : "") + str.tostring(rr, "0.0") + "R")
    t.lastR := rr
    t.lastWhy := why
    t.dir := 0

openTrade(int d, string locTxt) =>
    float edge = d == 1 ? rm.bot : rm.top
    float swingStop = d == 1 ? (not na(dr.swLo) and dr.swLo < edge ? dr.swLo : edge) : (not na(dr.swHi) and dr.swHi > edge ? dr.swHi : edge)
    float anchor = inStopMode == "Last swing beyond the range" ? swingStop : edge
    float slPx = d == 1 ? math.min(anchor - inStopBuf * atrU, close - syminfo.mintick) : math.max(anchor + inStopBuf * atrU, close + syminfo.mintick)
    t.dir := d
    t.entry := close
    t.sl := slPx
    t.sl0 := slPx
    t.r := math.abs(close - slPx)
    float tpR    = close + d * gridR * t.r
    float tpInit = na(rm.initExt) ? tpR : rm.initExt
    float tpZone = L1.on and not na(L1.top) ? (d == 1 ? L1.sellLo : L1.buyHi) : tpR
    float tpRaw  = inTpMode == "Initiation extreme" ? tpInit : inTpMode == "Opposite zone (layer 1)" ? tpZone : tpR
    t.tp := (tpRaw - close) * d >= t.r ? tpRaw : tpR
    t.bar := bar_index
    t.beHit := false
    t.locTxt := locTxt
    dy.trades := dy.trades + 1
    st.nMit := st.nMit + 1
    logEv((d == 1 ? "▲ long " : "▼ short ") + fmt(close) + " · " + locTxt)
    if d == 1
        ev.sigL := true
    else
        ev.sigS := true

if barstate.isconfirmed and not na(atr)
    // ── the day
    if newDay
        dy.trades := 0
        dy.todayR := 0.0
        dy.log := ""
        dy.dayNo := dy.dayNo + 1
        st.days := st.days + 1
    // ── direction: swings confirm, breaks commit
    if not na(dph)
        dr.swHi := dph
        dr.swHiBar := bar_index - inDirLeg
        dr.hiBroken := false
    if not na(dpl)
        dr.swLo := dpl
        dr.swLoBar := bar_index - inDirLeg
        dr.loBroken := false
    bool bosUp = not na(dr.swHi) and not dr.hiBroken and close > dr.swHi
    bool bosDn = not na(dr.swLo) and not dr.loBroken and close < dr.swLo
    if bosUp and bosDn
        bosUp := close >= open
        bosDn := not bosUp
    int prevState = dr.state
    if bosUp
        dr.hiBroken := true
        dr.bias := 1
        dr.breakBar := bar_index
        dr.breakTime := time
        dr.breaks := dr.breaks + 1
        dr.initiated := math.abs(close - open) >= inInitAtr * atrU
        dr.legOrigin := nz(dr.swLo, low)
        dr.legExt := high
    if bosDn
        dr.loBroken := true
        dr.bias := -1
        dr.breakBar := bar_index
        dr.breakTime := time
        dr.breaks := dr.breaks + 1
        dr.initiated := math.abs(close - open) >= inInitAtr * atrU
        dr.legOrigin := nz(dr.swHi, high)
        dr.legExt := low
    if dr.bias == 1 and not na(dr.legExt)
        dr.legExt := math.max(dr.legExt, high)
    else if dr.bias == -1 and not na(dr.legExt)
        dr.legExt := math.min(dr.legExt, low)
    dr.leg50 := na(dr.legOrigin) or na(dr.legExt) ? na : (dr.legOrigin + dr.legExt) / 2
    bool inside = not na(dr.swHi) and not na(dr.swLo) and close < dr.swHi and close > dr.swLo
    dr.state := dr.bias != 0 and bar_index - nz(dr.breakBar, bar_index) > inSideBars and inside ? 0 : dr.bias
    ev.dirChange := dr.state != prevState
    // ── manage an open trade (stop first, then target, breakeven, end of window)
    if t.dir != 0
        int d = t.dir
        bool stopHit = d == 1 ? low <= t.sl : high >= t.sl
        if stopHit
            closeTrade(t.sl, t.beHit and t.sl == t.entry ? "BE" : "SL")
        else if d == 1 ? high >= t.tp : low <= t.tp
            closeTrade(t.tp, "TP")
        else
            if gridBe > 0 and not t.beHit and (d == 1 ? high >= t.entry + gridBe * t.r : low <= t.entry - gridBe * t.r)
                t.beHit := true
                t.sl := t.entry
                ev.be := true
                logEv("breakeven")
            if inEodFlat and winEnd and t.dir != 0
                closeTrade(close, "EOD")
    // ── RIMC: range → initiation → mitigation
    bool tight = wH - wL <= inRimcAtr * atrU
    rm.lastPhase := rm.phase
    if rm.phase == 0
        if tight
            rm.phase := 1
            rm.top := wH
            rm.bot := wL
            rm.startBar := bar_index - inRimcBars + 1
            rm.lastIn := bar_index
            rm.initDir := 0
            rm.initBar := na
            rm.initExt := na
            rm.n := rm.n + 1
            rm.endWhy := ""
            st.nRanges := st.nRanges + 1
            ev.rangeFormed := true
    else if rm.phase == 1
        float h = rm.top - rm.bot
        bool insideBox = close <= rm.top and close >= rm.bot
        if insideBox
            float nTop = math.max(rm.top, high)
            float nBot = math.min(rm.bot, low)
            if nTop - nBot <= inRimcAtr * atrU
                rm.top := nTop
                rm.bot := nBot
            rm.lastIn := bar_index
        else if close > rm.top + inInitMult * h or close < rm.bot - inInitMult * h
            rm.phase := 2
            rm.initDir := close > rm.top ? 1 : -1
            rm.initBar := bar_index
            rm.initExt := rm.initDir == 1 ? high : low
            st.nInit := st.nInit + 1
            ev.initiated := true
        else if bar_index - rm.lastIn > inInitWithin
            rm.phase := 0
            rm.endWhy := "no initiation"
    else
        int d = rm.initDir
        rm.initExt := d == 1 ? math.max(rm.initExt, high) : math.min(rm.initExt, low)
        bool insideClose = close <= rm.top and close >= rm.bot
        bool touched = d == 1 ? low <= rm.top : high >= rm.bot
        bool mitHit = inMitMode == "First touch" ? touched : insideClose
        bool through = d == 1 ? close < rm.bot : close > rm.top
        if through
            rm.phase := 0
            rm.endWhy := "fell back through the range"
        else if mitHit
            float mid = (rm.top + rm.bot) / 2
            bool contOk = inContOn and dr.state == d
            int  nAl = alignedAt(d, mid, contOk)
            int  nEd = edgeAt(d, mid)
            bool dirOk = inGridDir == "Off" or dr.state == d
            int  nearBox = L1.on ? locAt(L1, mid) : L2.on ? locAt(L2, mid) : L3.on ? locAt(L3, mid) : 9
            bool locOk = nAl >= gridLay and not (d == 1 and nearBox == 2) and not (d == -1 and nearBox == -2)
            string skipWhy = not dirOk ? "direction is " + (dr.state == 0 ? "sideways" : dr.state == 1 ? "bullish" : "bearish") : not locOk ? (nAl == 0 ? "no " + (d == 1 ? "buy" : "sell") + " location" : "only " + str.tostring(nAl) + " of " + str.tostring(inLayersReq) + " layers") : not inWin ? "outside the window" : t.dir != 0 ? "in a trade" : dy.trades >= inMaxTrades ? "trades per day used" : not inRimcOn ? "ledger off" : ""
            rm.phase := 0
            rm.endWhy := skipWhy == "" ? "mitigated → entry" : "mitigated · " + skipWhy
            if skipWhy == ""
                openTrade(d, (nEd > 0 ? "edge" : "50 %") + (nAl >= 2 ? " · stacked ×" + str.tostring(nAl) : ""))
            else
                ev.mitigated := true
                ev.skipped := true
                ev.skipWhy := skipWhy
                ev.dir := d
                st.nSkip := st.nSkip + 1
                logEv("skip · " + (not dirOk ? "direction" : not locOk ? "location" : not inWin ? "window" : t.dir != 0 ? "in trade" : dy.trades >= inMaxTrades ? "budget" : "ledger off"))
        else if bar_index - rm.initBar > inMitWithin
            rm.phase := 0
            rm.endWhy := "no mitigation"
    // ── location events (price entering a zone in the direction's favour)
    int sellNow = edgeAt(-1, close)
    int buyNow  = edgeAt(1, close)
    int sellPrev = edgeAt(-1, close[1])
    int buyPrev  = edgeAt(1, close[1])
    ev.enterSell := sellNow > 0 and sellPrev == 0
    ev.enterBuy  := buyNow > 0 and buyPrev == 0
    bool eqNow = false
    bool eqPrev = false
    for L in layers
        if L.on
            eqNow := eqNow or locAt(L, close) == 0
            eqPrev := eqPrev or locAt(L, close[1]) == 0
    ev.enterEq := eqNow and not eqPrev and dr.state != 0 and dr.initiated
    ev.stacked := (dr.state == -1 and sellNow >= 2 and sellPrev < 2) or (dr.state == 1 and buyNow >= 2 and buyPrev < 2)
    int nearNow = L1.on ? L1.loc : L2.on ? L2.loc : L3.on ? L3.loc : 9
    int rcNow = dr.state == 0 ? 0 : dr.state == -1 ? (alignedAt(-1, close, inContOn) >= inLayersReq and nearNow != -2 ? -2 : -1) : (alignedAt(1, close, inContOn) >= inLayersReq and nearNow != 2 ? 2 : 1)
    ev.lookSell := rcNow == -2 and dr.readPrev != -2
    ev.lookBuy  := rcNow == 2 and dr.readPrev != 2
    dr.readPrev := rcNow

// ─────────────────────────────────────────────────────────────────── THE READ (display only)
int   sellN = alignedAt(-1, close, inContOn and dr.state == -1)
int   buyN  = alignedAt(1, close, inContOn and dr.state == 1)
int   sellE = edgeAt(-1, close)
int   buyE  = edgeAt(1, close)
bool  eqAny = false
for L in layers
    if L.on and L.loc == 0
        eqAny := true
int   nOn = (L1.on ? 1 : 0) + (L2.on ? 1 : 0) + (L3.on ? 1 : 0)
string dirWord = dr.state == 1 ? "bullish" : dr.state == -1 ? "bearish" : dr.bias == 0 ? "no direction yet" : "sideways"
string sinceTxt = na(dr.breakTime) ? "" : " since " + str.tostring(hour(dr.breakTime, inTz), "00") + ":" + str.tostring(minute(dr.breakTime, inTz), "00")
int    nearLoc  = L1.on ? L1.loc : L2.on ? L2.loc : L3.on ? L3.loc : 9
int    readCode = t.dir != 0 ? 5 : dr.state == 0 ? 0 : dr.state == -1 ? (sellN >= inLayersReq ? (nearLoc == -2 ? -4 : -2) : buyE > 0 ? -3 : -1) : (buyN >= inLayersReq ? (nearLoc == 2 ? 4 : 2) : sellE > 0 ? 3 : 1)
// -2 look for sells · -1 bearish, wait for a location · -3 bearish in a buy location (low probability) · -4 a sell location on a higher layer but the nearest layer has price at its LOW — wait for the pullback · +2/+1/+3/+4 the mirror · 0 stand aside · 5 in a trade
string stackTxt = (dr.state == -1 ? sellN : buyN) >= 2 ? " · STACKED ×" + str.tostring(dr.state == -1 ? sellN : buyN) : ""
string stateWord = t.dir == 1 ? "LONG OPEN" : t.dir == -1 ? "SHORT OPEN" : readCode == 0 ? (dr.bias == 0 ? "NO DIRECTION YET" : "SIDEWAYS · WAIT FOR DIRECTION") : readCode == -2 ? "LOOK FOR SELLS" + stackTxt : readCode == 2 ? "LOOK FOR BUYS" + stackTxt : readCode == -3 ? "BEARISH IN A BUY LOCATION · LOW PROBABILITY" : readCode == 3 ? "BULLISH IN A SELL LOCATION · WAIT FOR THE CHANGE" : readCode == -4 ? "BEARISH · SELL LOCATION ABOVE, BUT " + (L1.on ? L1.name : L2.on ? L2.name : L3.name) + " IS AT ITS LOW · WAIT FOR THE PULLBACK" : readCode == 4 ? "BULLISH · BUY LOCATION BELOW, BUT " + (L1.on ? L1.name : L2.on ? L2.name : L3.name) + " IS AT ITS HIGH · WAIT FOR THE PULLBACK" : readCode == -1 ? "BEARISH · WAIT FOR A SELL LOCATION" : "BULLISH · WAIT FOR A BUY LOCATION"
color  stateCol  = t.dir == 1 ? th.up : t.dir == -1 ? th.down : readCode == -2 ? th.down : readCode == 2 ? th.up : readCode == 0 ? th.flat : readCode == -3 or readCode == 3 or readCode == -4 or readCode == 4 ? th.accentHi : th.accent
float  openR     = t.dir != 0 ? (close - t.entry) * t.dir / t.r : na
string sizeTxt   = inRiskUsd > 0 and t.dir != 0 and t.r > 0 ? str.tostring(math.floor(inRiskUsd / t.r)) + (syminfo.type == "stock" or syminfo.type == "fund" ? " shares" : " units") + " for " + str.tostring(inRiskUsd, "#") + " risk" : ""
string chipTxt   = t.dir != 0 ? (openR >= 0 ? "+" : "") + str.tostring(openR, "0.0") + "R now" + (t.beHit ? " · stop at breakeven" : "") : dy.trades > 0 ? "today " + (dy.todayR >= 0 ? "+" : "") + str.tostring(dy.todayR, "0.0") + "R" : rm.phase == 2 ? "initiated " + (rm.initDir == 1 ? "▲" : "▼") : rm.phase == 1 ? "range forming" : "day " + str.tostring(dy.dayNo)
string rimcTxt   = rm.phase == 1 ? "range " + fmt(rm.bot) + " – " + fmt(rm.top) + " (" + str.tostring(bar_index - rm.startBar + 1) + " bars) · waiting for an initiation ≥ " + str.tostring(inInitMult, "0.0") + " × its height" : rm.phase == 2 ? "initiated " + (rm.initDir == 1 ? "▲" : "▼") + " from " + fmt(rm.bot) + " – " + fmt(rm.top) + " · waiting for the mitigation (" + str.tostring(math.max(0, inMitWithin - (bar_index - nz(rm.initBar, bar_index)))) + " bars left)" : "idle — " + (rm.endWhy == "" ? "no range yet" : "last: " + rm.endWhy)
string tpModeTxt = inTpMode == "R multiple" ? str.tostring(inR, "0.0") + "R" : inTpMode == "Initiation extreme" ? "initiation extreme" : "opposite zone"
int    locTint   = sellE > 0 ? 1 : buyE > 0 ? -1 : 0
int    sellFade  = inFocus == "Both sides" ? 0 : inFocus == "Buys only (discount)" ? 100 : inFocus == "Sells only (premium)" ? 0 : dr.state == 1 ? 14 : 0
int    buyFade   = inFocus == "Both sides" ? 0 : inFocus == "Sells only (premium)" ? 100 : inFocus == "Buys only (discount)" ? 0 : dr.state == -1 ? 14 : 0
string gateTxt   = (inNeedDir ? "direction " + (dr.state == 0 ? "✗ " + dirWord : "✓ " + dirWord) : "direction not required") + " · location " + (dr.state == -1 ? (sellN >= inLayersReq ? "✓ sell" : "✗ needs a sell location") : dr.state == 1 ? (buyN >= inLayersReq ? "✓ buy" : "✗ needs a buy location") : "— no side yet") + (inWinOn ? " · window " + (inWin ? "✓" : "✗") : "") + " · " + str.tostring(dy.trades) + " of " + str.tostring(inMaxTrades) + " trades"

// ─────────────────────────────────────────────────────────────────── CHART · the cloud (per-bar plots + fills), leg 50 %, swings, RIMC boxes, trade levels
// The cloud is drawn bar by bar so you can look back and see where the locations WERE — the "cloud like band".
// Plot colours are inputs (not theme fields) on purpose: a series colour costs a second output and three layers
// of per-bar bands blew the 64-plot budget in v1.0. Nearer layer strong, higher layers paler; the side the
// direction says to look at draws strong, the other side fades (Focus).
int   a1 = inFillA
int   a2 = math.min(97, inFillA + 6)
int   a3 = math.min(97, inFillA + 11)
p1t = plot(inL1On ? L1.top : na, "L1 range high", color = color.new(cSell, 55), linewidth = 1, display = display.pane)
p1s = plot(inL1On ? L1.sellLo : na, "L1 sell zone floor", color = color.new(#000000, 100), display = display.pane)
p1e = plot(inL1On ? L1.eq : na, "L1 50 %", color = color.new(cEq, 30), linewidth = 1, style = plot.style_circles, display = display.pane)
p1b = plot(inL1On ? L1.buyHi : na, "L1 buy zone ceiling", color = color.new(#000000, 100), display = display.pane)
p1o = plot(inL1On ? L1.bot : na, "L1 range low", color = color.new(cBuy, 55), linewidth = 1, display = display.pane)
fill(p1t, p1s, color = inFills and inL1On ? color.new(cSell, math.min(100, a1 + sellFade)) : na, title = "L1 sell zone")
fill(p1b, p1o, color = inFills and inL1On ? color.new(cBuy, math.min(100, a1 + buyFade)) : na, title = "L1 buy zone")
p2t = plot(inL2On ? L2.top : na, "L2 range high", color = color.new(cSell, 72), linewidth = 1, display = display.pane)
p2s = plot(inL2On ? L2.sellLo : na, "L2 sell zone floor", color = color.new(#000000, 100), display = display.pane)
p2e = plot(inL2On ? L2.eq : na, "L2 50 %", color = color.new(cEq, 55), linewidth = 1, style = plot.style_circles, display = display.pane)
p2b = plot(inL2On ? L2.buyHi : na, "L2 buy zone ceiling", color = color.new(#000000, 100), display = display.pane)
p2o = plot(inL2On ? L2.bot : na, "L2 range low", color = color.new(cBuy, 72), linewidth = 1, display = display.pane)
fill(p2t, p2s, color = inFills and inL2On ? color.new(cSell, math.min(100, a2 + sellFade)) : na, title = "L2 sell zone")
fill(p2b, p2o, color = inFills and inL2On ? color.new(cBuy, math.min(100, a2 + buyFade)) : na, title = "L2 buy zone")
p3t = plot(inL3On ? L3.top : na, "L3 range high", color = color.new(cSell, 82), linewidth = 1, display = display.pane)
p3s = plot(inL3On ? L3.sellLo : na, "L3 sell zone floor", color = color.new(#000000, 100), display = display.pane)
p3e = plot(inL3On ? L3.eq : na, "L3 50 %", color = color.new(cEq, 72), linewidth = 1, style = plot.style_circles, display = display.pane)
p3b = plot(inL3On ? L3.buyHi : na, "L3 buy zone ceiling", color = color.new(#000000, 100), display = display.pane)
p3o = plot(inL3On ? L3.bot : na, "L3 range low", color = color.new(cBuy, 82), linewidth = 1, display = display.pane)
fill(p3t, p3s, color = inFills and inL3On ? color.new(cSell, math.min(100, a3 + sellFade)) : na, title = "L3 sell zone")
fill(p3b, p3o, color = inFills and inL3On ? color.new(cBuy, math.min(100, a3 + buyFade)) : na, title = "L3 buy zone")
// the leg's 50 % (the retracement midpoint of the current impulse)
plot(inLeg50 and dr.state != 0 ? dr.leg50 : na, "Leg 50 %", color = color.new(cEq, 20), linewidth = 1, style = plot.style_circles, display = display.pane)
// the trade window (soft time shade, only when the window is on)
bgcolor(inWinOn and inWinShade and inWin ? color.new(cEq, 94) : na, title = "Trade window")
// chart swings (the direction engine's last swing high / low)
plot(inShowSwings ? dr.swHi : na, "Swing high", color = color.new(dr.hiBroken ? #5B6472 : cSell, 55), linewidth = 1, style = plot.style_stepline, display = display.pane)
plot(inShowSwings ? dr.swLo : na, "Swing low", color = color.new(dr.loBroken ? #5B6472 : cBuy, 55), linewidth = 1, style = plot.style_stepline, display = display.pane)
// trade levels
bool inT = t.dir != 0
plot(inT ? t.entry : na, "Entry", color = color.new(#A9B8FF, 20), linewidth = 1, style = plot.style_linebr, display = display.pane)
plot(inT ? t.sl : na, "Stop", color = color.new(#FF4D6D, 20), linewidth = 1, style = plot.style_linebr, display = display.pane)
plot(inT ? t.tp : na, "Target", color = color.new(#22C55E, 20), linewidth = 1, style = plot.style_linebr, display = display.pane)
barcolor(inTint and inT ? color.new(t.dir == 1 ? cBuy : cSell, 15) : inTintLoc and locTint != 0 ? color.new(locTint == 1 ? cSell : cBuy, 40) : na, title = "Trade / location tint")

// layer labels at the right edge
var array<label> zl = array.new<label>()
if barstate.isfirst
    for i = 0 to 6
        array.push(zl, label.new(bar_index, close, "", style = label.style_label_left, color = color.new(th.bg, 100), textcolor = th.txt, size = size.tiny))
if barstate.islast
    int k = 0
    for L in layers
        label ls = array.get(zl, k * 2)
        label lb = array.get(zl, k * 2 + 1)
        bool show = inZoneLabels and L.on and not na(L.top)
        string ageTxt = L.mode == "Rolling window" ? str.tostring(L.nBars * chartSec / 3600.0, "#.#") + " h" : L.mode == "Swing range" ? "swings" : "prev day"
        label.set_xy(ls, bar_index + 2, show ? (L.top + L.sellLo) / 2 : close)
        label.set_text(ls, show ? L.name + " sell ≥ " + fmt(L.sellLo) : "")
        label.set_textcolor(ls, color.new(cSell, math.min(90, k * 20 + sellFade)))
        label.set_xy(lb, bar_index + 2, show ? (L.bot + L.buyHi) / 2 : close)
        label.set_text(lb, show ? L.name + " buy ≤ " + fmt(L.buyHi) : "")
        label.set_textcolor(lb, color.new(cBuy, math.min(90, k * 20 + buyFade)))
        k += 1
    label ll = array.get(zl, 6)
    bool showLeg = inLeg50 and dr.state != 0 and not na(dr.leg50)
    label.set_xy(ll, bar_index + 2, showLeg ? dr.leg50 : close)
    label.set_text(ll, showLeg ? "leg 50 % " + fmt(dr.leg50) : "")
    label.set_textcolor(ll, color.new(cEq, 15))

// RIMC range boxes
var array<box> rBoxes = array.new<box>()
if barstate.isconfirmed and inShowRanges != "Off"
    if ev.rangeFormed
        rm.bx := box.new(rm.startBar, rm.top, bar_index, rm.bot, border_color = color.new(th.flat, 40), border_width = 1, bgcolor = color.new(th.flat, 86))
        array.push(rBoxes, rm.bx)
        int keep = inShowRanges == "Last 10" ? 10 : 60
        while array.size(rBoxes) > keep
            box.delete(array.shift(rBoxes))
    else if not na(rm.bx) and rm.phase != 0
        box.set_right(rm.bx, bar_index)
        box.set_top(rm.bx, rm.top)
        box.set_bottom(rm.bx, rm.bot)
        if rm.phase == 2
            color ic = rm.initDir == 1 ? th.up : th.down
            box.set_border_color(rm.bx, color.new(ic, 30))
            box.set_bgcolor(rm.bx, color.new(ic, 84))
    else if not na(rm.bx) and rm.phase == 0 and rm.lastPhase != 0
        box.set_right(rm.bx, bar_index)
        if rm.endWhy == "mitigated → entry"
            box.set_bgcolor(rm.bx, color.new(t.dir == 1 ? th.up : th.down, 78))
        else
            box.set_bgcolor(rm.bx, color.new(th.flat, 93))
            box.set_border_color(rm.bx, color.new(th.flat, 70))

// gradient risk / reward zones
var array<box> zones = array.new<box>()
var array<box> liveZ = array.new<box>()
gradBand(float top, float bot, color c, int x1, int x2, bool denseTop) =>
    float h = (top - bot) / 4
    for k = 0 to 3
        float bTop = top - h * k
        float bBot = bTop - h
        int alpha = denseTop ? 88 + k * 2 : 96 - k * 2
        box b = box.new(x1, bTop, x2, bBot, border_color = color.new(c, 100), bgcolor = color.new(c, alpha))
        array.push(zones, b)
        array.push(liveZ, b)
if barstate.isconfirmed
    if (ev.sigL or ev.sigS) and inZones
        for b in zones
            box.delete(b)
        array.clear(zones)
        array.clear(liveZ)
        int d = t.dir
        gradBand(math.max(t.entry, t.sl), math.min(t.entry, t.sl), th.down, bar_index, bar_index + 1, d == 1)
        gradBand(math.max(t.entry, t.tp), math.min(t.entry, t.tp), th.up, bar_index, bar_index + 1, d == -1)
    else if (t.dir != 0 or ev.exit) and array.size(liveZ) > 0
        for b in liveZ
            box.set_right(b, bar_index)

// event labels
if inShowSwings and ev.dirChange and dr.state != 0
    label.new(bar_index, dr.state == 1 ? low : high, dr.state == 1 ? "▲ bullish" + (dr.initiated ? " · initiation" : "") : "▼ bearish" + (dr.initiated ? " · initiation" : ""), style = dr.state == 1 ? label.style_label_up : label.style_label_down, color = color.new(th.bg, 20), textcolor = dr.state == 1 ? th.up : th.down, size = size.tiny)
if ev.initiated
    label.new(bar_index, rm.initDir == 1 ? low : high, rm.initDir == 1 ? "I ▲" : "I ▼", style = rm.initDir == 1 ? label.style_label_up : label.style_label_down, color = color.new(th.bg, 30), textcolor = rm.initDir == 1 ? th.up : th.down, size = size.tiny, tooltip = "RIMC initiation: a close beyond the range by at least " + str.tostring(inInitMult, "0.0") + " × its height — waiting for the mitigation")
if ev.sigL
    label.new(bar_index, low, "M ▲ long " + fmt(t.entry) + " · " + t.locTxt + "\nstop " + fmt(t.sl) + " · target " + fmt(t.tp) + (sizeTxt != "" ? "\n" + sizeTxt : ""), style = label.style_label_up, color = color.new(th.up, 12), textcolor = th.bg, size = size.small, tooltip = "Mitigation entry: price came back into the range after a bullish initiation, in a buy location, with the direction bullish. Stop below the range, target " + tpModeTxt + ".")
if ev.sigS
    label.new(bar_index, high, "M ▼ short " + fmt(t.entry) + " · " + t.locTxt + "\nstop " + fmt(t.sl) + " · target " + fmt(t.tp) + (sizeTxt != "" ? "\n" + sizeTxt : ""), style = label.style_label_down, color = color.new(th.down, 12), textcolor = th.bg, size = size.small, tooltip = "Mitigation entry: price came back into the range after a bearish initiation, in a sell location, with the direction bearish. Stop above the range, target " + tpModeTxt + ".")
if ev.skipped
    label.new(bar_index, ev.dir == 1 ? low : high, "mitigated · " + ev.skipWhy, style = ev.dir == 1 ? label.style_label_up : label.style_label_down, color = color.new(th.bg, 15), textcolor = th.flat, size = size.tiny)
if ev.exit
    string rTxt = (ev.r >= 0 ? "+" : "") + str.tostring(ev.r, "0.0") + "R"
    string whyTxt = ev.why == "TP" ? "target" : ev.why == "EOD" ? "flat at the window end" : ev.why == "BE" ? "breakeven" : "stop"
    label.new(bar_index, ev.dir == 1 ? high : low, (ev.dir == 1 ? "exit long · " : "exit short · ") + whyTxt + " " + rTxt, style = ev.dir == 1 ? label.style_label_down : label.style_label_up, color = color.new(th.bg, 15), textcolor = ev.r >= 0 ? th.up : th.down, size = size.tiny)

// ─────────────────────────────────────────────────────────────────── DASHBOARD
posOf(string p) =>
    p == "Top Left" ? position.top_left : p == "Bottom Right" ? position.bottom_right : p == "Bottom Left" ? position.bottom_left : p == "Middle Right" ? position.middle_right : p == "Middle Left" ? position.middle_left : position.top_right
szLead() => inSize == "Small" ? size.small : inSize == "Large" ? size.large  : size.normal
szBody() => inSize == "Small" ? size.tiny  : inSize == "Large" ? size.normal : size.small
szSub()  => inSize == "Small" ? size.tiny  : inSize == "Large" ? size.small  : size.tiny
row3(table tb, int r, string k, string mark, color markCol, string why, color whyCol) =>
    color stripe = r % 2 == 1 ? color.new(th.accent, 94) : th.bg
    table.cell(tb, 0, r, k, text_color = th.flat, text_size = szBody(), text_halign = text.align_left, bgcolor = stripe)
    table.cell(tb, 1, r, mark, text_color = markCol, text_size = szBody(), text_halign = text.align_center, bgcolor = stripe)
    table.cell(tb, 2, r, why, text_color = whyCol, text_size = szBody(), text_halign = text.align_left, text_font_family = font.family_monospace, bgcolor = stripe)
section(table tb, int r, string title) =>
    table.cell(tb, 0, r, title, text_color = th.accent, text_size = szSub(), text_halign = text.align_left, bgcolor = color.new(th.accent, 90))
    table.cell(tb, 1, r, "", bgcolor = color.new(th.accent, 90))
    table.cell(tb, 2, r, "", bgcolor = color.new(th.accent, 90))
    table.merge_cells(tb, 0, r, 2, r)
locColor(int lc) => lc == 2 ? th.sellZ : lc == -2 ? th.buyZ : lc == 0 ? th.accentHi : th.txt
locMark(int lc) => lc == 2 ? "▼" : lc == -2 ? "▲" : lc == 0 ? "◆" : lc == 9 ? "" : "·"
gauge(float pos) =>
    // twelve cells: buy zone · middle · sell zone, the price marked ● — the location at a glance
    int zc = math.max(1, math.round(12 * inZonePct / 100.0))
    int p  = na(pos) ? -1 : math.round(math.min(math.max(pos, 0), 100) / 100 * 11)
    string g = ""
    for i = 0 to 11
        g := g + (i == p ? "●" : i < zc ? "▒" : i >= 12 - zc ? "▒" : "·")
    g
layerRow(table tb, int r, Layer L) =>
    string rng = na(L.top) ? "not ready yet" : fmt(L.bot) + " – " + fmt(L.top)
    string desc = L.mode == "Rolling window" ? str.tostring(L.nBars * chartSec / 3600.0, "#.#") + " h" : L.mode == "Swing range" ? "swings" : "prev day"
    row3(tb, r, L.name + " · " + desc, locMark(L.loc), locColor(L.loc), na(L.top) ? "not ready yet" : gauge(L.pos) + " " + locWord(L.loc) + " · " + str.tostring(L.pos, "#") + " % · " + rng, locColor(L.loc))

var table dash = table.new(posOf(inDashPos), 3, 24, bgcolor = th.bg, frame_color = th.frame, frame_width = 1, border_width = 0, force_overlay = false)
if barstate.islast and inDash
    table.clear(dash, 0, 0, 2, 23)
    int r = 0
    table.cell(dash, 0, r, "LOCATION DESK", text_color = th.accentHi, text_size = szLead(), text_halign = text.align_left, bgcolor = th.bg, tooltip = "Direction first, location second, execution last. Every decision commits on the closed bar.")
    table.cell(dash, 1, r, "", bgcolor = th.bg)
    table.cell(dash, 2, r, syminfo.ticker + " · " + timeframe.period + " · " + hhmm, text_color = th.accent, text_size = szSub(), text_halign = text.align_right, bgcolor = th.bg)
    r += 1
    table.cell(dash, 0, r, (t.dir == 1 ? "▲ " : t.dir == -1 ? "▼ " : readCode == -2 ? "▼ " : readCode == 2 ? "▲ " : "● ") + stateWord, text_color = stateCol, text_size = szLead(), text_halign = text.align_left, bgcolor = th.bg, tooltip = "The read: the chart's direction combined with where price sits in each layer's range.")
    table.cell(dash, 1, r, "", bgcolor = th.bg)
    color chipBg = t.dir != 0 ? color.new(openR >= 0 ? th.up : th.down, 75) : dy.trades > 0 ? color.new(dy.todayR >= 0 ? th.up : th.down, 75) : color.new(stateCol, 80)
    table.cell(dash, 2, r, chipTxt, text_color = th.txtHi, text_size = szBody(), text_halign = text.align_right, bgcolor = chipBg)
    r += 1
    section(dash, r, "DIRECTION · CHART STRUCTURE")
    r += 1
    row3(dash, r, "Structure", dr.state == 1 ? "▲" : dr.state == -1 ? "▼" : "·", dr.state == 1 ? th.up : dr.state == -1 ? th.down : th.flat, dirWord + sinceTxt + (dr.state != 0 and dr.initiated ? " · initiation" : "") + (na(dr.swHi) ? "" : " · swings " + fmt(dr.swHi) + (dr.hiBroken ? "✗" : "") + " / " + fmt(dr.swLo) + (dr.loBroken ? "✗" : "")), th.txt)
    r += 1
    if inLeg50 and dr.state != 0 and not na(dr.leg50)
        bool atLeg = math.abs(close - dr.leg50) <= math.abs(dr.legExt - dr.legOrigin) * inContPct / 100
        row3(dash, r, "Leg 50 %", atLeg ? "◆" : "·", atLeg ? th.accentHi : th.flat, fmt(dr.leg50) + " · leg " + fmt(dr.legOrigin) + " → " + fmt(dr.legExt) + (atLeg ? " · price is here — continuation location" : ""), atLeg ? th.accentHi : th.txt)
        r += 1
    section(dash, r, "LOCATION · " + str.tostring(nOn) + (nOn == 1 ? " LAYER" : " LAYERS") + " · " + (dr.state == -1 ? str.tostring(sellN) + " SAY SELL" : dr.state == 1 ? str.tostring(buyN) + " SAY BUY" : "NO SIDE YET"))
    r += 1
    if L1.on
        layerRow(dash, r, L1)
        r += 1
    if L2.on
        layerRow(dash, r, L2)
        r += 1
    if L3.on
        layerRow(dash, r, L3)
        r += 1
    section(dash, r, "RIMC · RANGE → INITIATION → MITIGATION → CONTINUATION")
    r += 1
    if t.dir == 0
        row3(dash, r, "Setup", rm.phase == 2 ? (rm.initDir == 1 ? "▲" : "▼") : rm.phase == 1 ? "◻" : "·", rm.phase == 2 ? (rm.initDir == 1 ? th.up : th.down) : rm.phase == 1 ? th.accentHi : th.flat, rimcTxt, th.txt)
        r += 1
        row3(dash, r, "Gate", "", th.txt, gateTxt, th.txt)
        r += 1
    else
        row3(dash, r, "Trade", t.dir == 1 ? "▲" : "▼", t.dir == 1 ? th.up : th.down, (t.dir == 1 ? "long " : "short ") + fmt(t.entry) + " · " + t.locTxt + " · " + str.tostring(bar_index - t.bar) + " bars · 1R = " + fmt(t.r), th.txtHi)
        r += 1
        row3(dash, r, "Stop · target", "", th.txt, fmt(t.sl) + (t.beHit ? " (breakeven)" : inStopMode == "Range edge" ? " · beyond the range" : " · beyond the last swing") + " · target " + fmt(t.tp) + " (" + tpModeTxt + ")" + (inWinOn and inEodFlat ? " · flat after " + inWinSess : ""), th.txt)
        r += 1
        if sizeTxt != ""
            row3(dash, r, "Size", "", th.txt, sizeTxt, th.txt)
            r += 1
    if dy.log != ""
        row3(dash, r, "Today", "", th.txt, dy.log, th.txt)
        r += 1
    section(dash, r, "RECORD · PAPER, NO COSTS")
    r += 1
    row3(dash, r, "Setups", "", th.txt, str.tostring(st.nRanges) + " ranges · " + str.tostring(st.nInit) + " initiations · " + str.tostring(st.nMit) + " entries · " + str.tostring(st.nSkip) + " mitigations skipped by the gate", th.txt)
    r += 1
    row3(dash, r, "Closed", "", th.txt, st.n == 0 ? "no closed trades yet" : str.tostring(st.n) + " · " + str.tostring(math.round(st.wins / st.n * 100)) + "% won · avg " + (st.sumR / st.n >= 0 ? "+" : "") + str.tostring(st.sumR / st.n, "0.00") + "R · target " + str.tostring(st.nTp) + " · stop " + str.tostring(st.nStop) + " · BE " + str.tostring(st.nBe) + " · flat " + str.tostring(st.nEod) + (na(t.lastR) ? "" : " · last " + (t.lastR >= 0 ? "+" : "") + str.tostring(t.lastR, "0.0") + "R"), st.n > 0 and st.sumR >= 0 ? th.up : st.n > 0 ? th.down : th.txt)
    r += 1
    table.cell(dash, 0, r, "zones " + str.tostring(inZonePct) + " % · layers " + str.tostring(inLayersReq) + (inNeedDir ? " · direction first" : "") + " · focus " + (inFocus == "Follow direction" ? "follows direction" : str.lower(inFocus)), text_color = th.flat, text_size = szSub(), text_halign = text.align_left, bgcolor = th.bg)
    table.cell(dash, 1, r, "", bgcolor = th.bg)
    table.cell(dash, 2, r, "RIMC " + str.tostring(inRimcBars) + " bars ≤ " + str.tostring(inRimcAtr, "0.0") + " ATR · init ≥ " + str.tostring(inInitMult, "0.0") + "× · target " + tpModeTxt + (inWinOn ? " · " + inWinSess : ""), text_color = th.flat, text_size = szSub(), text_halign = text.align_right, bgcolor = th.bg)

// ─────────────────────────────────────────────────────────────────── CO-PILOT
wrap(string s, int width) =>
    array<string> words = str.split(s, " ")
    string out = ""
    string line = ""
    for w in words
        if str.length(line) + str.length(w) + 1 > width and line != ""
            out := out + line + "\n"
            line := w
        else
            line := line == "" ? w : line + " " + w
    out + line
layersTxt() =>
    string o = ""
    for L in layers
        if L.on and not na(L.top)
            o := o + (o == "" ? "" : ", ") + L.name + " " + locWord(L.loc) + " (" + str.tostring(L.pos, "#") + " %)"
    o
narrNow() =>
    string o = ""
    if t.dir != 0
        o := "in a " + (t.dir == 1 ? "long" : "short") + " from " + fmt(t.entry) + " (" + t.locTxt + ") for " + str.tostring(bar_index - t.bar) + " bars, " + (openR >= 0 ? "+" : "") + str.tostring(openR, "0.0") + "R at this close — stop " + fmt(t.sl) + (t.beHit ? " (breakeven)" : " beyond the range") + ", target " + fmt(t.tp)
    else
        o := "the chart is " + dirWord + sinceTxt + "; price sits at " + layersTxt() + " — " + (readCode == -2 ? "a sell location with a bearish direction: look for sells, not chase" : readCode == 2 ? "a buy location with a bullish direction: look for buys, not chase" : readCode == -3 ? "bearish but in a buy location: selling here is low probability" : readCode == 3 ? "bullish but in a sell location: no chase, and sells need a change of direction first" : readCode == -4 ? "a sell location on a higher layer, but the nearest layer has price at its low — wait for the pullback before selling" : readCode == 4 ? "a buy location on a higher layer, but the nearest layer has price at its high — wait for the pullback before buying" : readCode == -1 ? "bearish, but not at a sell location yet — wait for the pullback (the 50 % band or the red zone)" : readCode == 1 ? "bullish, but not at a buy location yet — wait for the pullback (the 50 % band or the green zone)" : dr.bias == 0 ? "no structure break yet, nothing to lean on" : "sideways: no new break, price inside the swings — wait for direction") + "" + (inLeg50 and dr.state != 0 and not na(dr.leg50) ? "; the leg's 50 % is at " + fmt(dr.leg50) : "") + "; RIMC: " + rimcTxt
    o + (dy.log != "" ? "; today so far: " + dy.log : "")
narrWhy() =>
    "Location: price relatively high inside the observed range is where sells are hunted, relatively low is where buys are — buying low and selling high made mechanical; the 50 % line is where continuations pull back to after an initiation. Direction first: the location says where to be interested, the chart's structure says which side; a red zone with a bullish structure is not a sell, it is a place to wait. Layers: when the 5-minute, 15-minute and 1-hour locations agree, the decision is stronger. RIMC: a range is where orders were built, the initiation shows their intention, the mitigation is price coming back to them — the entry — and the continuation is the move that pays."
narrPlan() =>
    string o = ""
    if t.dir != 0
        o := "Stop first on every closed bar. Target " + fmt(t.tp) + " (" + tpModeTxt + ")" + (inBeAt > 0 ? "; the stop moves to breakeven at " + str.tostring(inBeAt, "0.0") + "R" : "") + (inWinOn and inEodFlat ? "; whatever is open closes on the first bar after " + inWinSess : "") + ". The idea is wrong beyond " + fmt(t.sl0) + "." + (sizeTxt != "" ? " Size: " + sizeTxt + "." : "")
    else
        o := "A trade needs: " + (inNeedDir ? "the chart's direction, " : "") + "a " + (dr.state == 1 ? "buy" : dr.state == -1 ? "sell" : "same-side") + " location on " + str.tostring(inLayersReq) + (inLayersReq == 1 ? " layer" : " layers") + ", a range of " + str.tostring(inRimcBars) + " bars inside " + str.tostring(inRimcAtr, "0.0") + " ATR, an initiation of at least " + str.tostring(inInitMult, "0.0") + " × the range, and the mitigation within " + str.tostring(inMitWithin) + " bars. Then: entry at the " + (inMitMode == "First touch" ? "close of the first bar that touches the range" : "first close back inside the range") + ", stop beyond " + (inStopMode == "Range edge" ? "the far side" : "the last swing") + " plus " + str.tostring(inStopBuf, "0.00") + " ATR, target " + tpModeTxt + (inWinOn ? ", inside " + inWinSess + " " + inTz : "") + ". " + str.tostring(inMaxTrades) + " trade" + (inMaxTrades == 1 ? "" : "s") + " per day."
    o
narrTrack() =>
    st.n < 5 ? "Too few closed trades on this chart to say anything yet (" + str.tostring(st.nRanges) + " ranges, " + str.tostring(st.nInit) + " initiations seen)." : str.tostring(st.n) + " paper trades from " + str.tostring(st.nInit) + " initiations: " + str.tostring(math.round(st.wins / st.n * 100)) + "% won, avg " + (st.sumR / st.n >= 0 ? "+" : "") + str.tostring(st.sumR / st.n, "0.00") + "R; " + str.tostring(st.nTp) + " reached the target, " + str.tostring(st.nStop) + " stopped, " + str.tostring(st.nBe) + " breakeven, " + str.tostring(st.nEod) + " flat at the window end; " + str.tostring(st.nSkip) + " mitigations skipped by the gate. No costs, small sample — a description of the past on THIS chart, not an edge."
narrPosOf(string p) =>
    p == "Top Left" ? position.top_left : p == "Top Right" ? position.top_right : p == "Bottom Right" ? position.bottom_right : p == "Middle Left" ? position.middle_left : p == "Middle Right" ? position.middle_right : position.bottom_left
narrBodySz() => inNarrSize == "Small" ? size.small : inNarrSize == "Medium" ? size.normal : inNarrSize == "Large" ? size.large : szBody()
narrHeadSz() => inNarrSize == "Small" ? size.normal : inNarrSize == "Medium" ? size.large : inNarrSize == "Large" ? size.large : szLead()

var table narrT = na
if barstate.islast
    if not na(narrT)
        table.delete(narrT)
        narrT := na
    if inNarr != "Off"
        array<string> labs = array.new<string>()
        array<string> vals = array.new<string>()
        array.push(labs, "NOW")
        array.push(vals, wrap(narrNow() + " (context, not a trade instruction)", inNarrWrap))
        bool deep = inNarr == "Standard" or inNarr == "Detailed"
        if deep
            array.push(labs, "WHY")
            array.push(vals, wrap(narrWhy(), inNarrWrap))
            array.push(labs, "PLAN")
            array.push(vals, wrap(narrPlan(), inNarrWrap))
        if inNarr == "Detailed"
            array.push(labs, "TRACK REC")
            array.push(vals, wrap(narrTrack(), inNarrWrap))
            array.push(labs, "GLOSSARY")
            array.push(vals, wrap("Location = where price sits inside the observed range: the top part is the sell location (premium), the bottom part the buy location (discount), the 50 % line the equilibrium. Layer = one observation timeframe's range. Stacked = two or more layers agree. Initiation = a break with a real body. RIMC = Range, Initiation, Mitigation, Continuation — the entry is the mitigation, price coming back into the range it left.", inNarrWrap))
        int nr = array.size(labs)
        bool atBottom = inNarrPos == "Bottom Left" or inNarrPos == "Bottom Right"
        int rows = nr + 2 + (atBottom ? 1 : 0)
        narrT := table.new(narrPosOf(inNarrPos), 2, rows, bgcolor = th.bg, frame_color = th.frame, frame_width = 1, border_color = color.new(th.frame, 70), border_width = 1)
        table.cell(narrT, 0, 0, "◆ CO-PILOT", text_color = th.accentHi, bgcolor = color.new(th.accent, 88), text_size = narrHeadSz(), text_halign = text.align_left)
        table.cell(narrT, 1, 0, stateWord + " · " + str.upper(inNarr), text_color = th.accent, bgcolor = color.new(th.accent, 88), text_size = narrBodySz(), text_halign = text.align_right)
        for i = 0 to nr - 1
            table.cell(narrT, 0, i + 1, array.get(labs, i), text_color = th.accent, bgcolor = th.bg, text_size = narrBodySz(), text_halign = text.align_left, text_valign = text.align_top)
            table.cell(narrT, 1, i + 1, array.get(vals, i), text_color = th.txt, bgcolor = th.bg, text_size = narrBodySz(), text_halign = text.align_left, text_valign = text.align_top)
        table.cell(narrT, 0, nr + 1, "", bgcolor = th.bg)
        table.cell(narrT, 1, nr + 1, "Honest: a location is where price is relatively high or low, not a promise. The record has no costs — measure before you trust it.", text_color = th.flat, bgcolor = th.bg, text_size = narrBodySz(), text_halign = text.align_left)
        if atBottom
            table.cell(narrT, 0, nr + 2, " ", bgcolor = th.bg)
            table.cell(narrT, 1, nr + 2, " ", bgcolor = th.bg)

// ─────────────────────────────────────────────────────────────────── STRATEGY BRIDGE (real orders mirror the paper ledger)
// The indicator's openTrade() sets t.dir / t.sl / t.tp and raises ev.sigL / ev.sigS on the mitigation bar; its
// closeTrade() raises ev.exit for a stop / target / breakeven / end-of-window. We mirror both. The stop and target
// are refreshed every bar so the breakeven move (t.sl := t.entry) is honoured.
if ev.exit and strategy.position_size != 0
    strategy.close_all(comment = ev.why)
if ev.sigL
    strategy.entry("L", strategy.long, comment = t.locTxt)
if ev.sigS
    strategy.entry("S", strategy.short, comment = t.locTxt)
if t.dir != 0 and strategy.position_size != 0
    strategy.exit("X", stop = t.sl, limit = t.tp, comment_profit = "target", comment_loss = t.beHit and t.sl == t.entry ? "breakeven" : "stop")
// SYNC guard: if the emulator holds a position the ledger no longer knows about, flatten it and tag it.
if strategy.position_size != 0 and t.dir == 0 and not ev.exit and not ev.sigL and not ev.sigS
    strategy.close_all(comment = "SYNC")

// ─────────────────────────────────────────────────────────────────── ALERTS (confirmed bars only by construction)
payload(string evName, string why) =>
    string js = '{"src":"LocationDesk","symbol":"' + syminfo.ticker + '","tf":"' + timeframe.period + '","event":"' + evName + '","direction":"' + dirWord + '","read":"' + stateWord + '","layers":"' + layersTxt() + '","side":"' + (t.dir == 1 or ev.dir == 1 ? "LONG" : t.dir == -1 or ev.dir == -1 ? "SHORT" : "NONE") + '","entry":' + fmt(nz(t.entry, close)) + ',"sl":' + fmt(nz(t.sl, 0)) + ',"tp":' + fmt(nz(t.tp, 0)) + ',"reason":"' + why + '"' + (na(ev.r) ? "" : ',"r":' + str.tostring(ev.r, "0.00")) + '}'
    string tx = "Location Desk · " + syminfo.ticker + " " + timeframe.period + " · " + evName + " · " + stateWord + " · " + layersTxt() + (why != "" ? " · " + why : "")
    inAlertJson ? js : tx
alertcondition(ev.lookSell, "Read: LOOK FOR SELLS", "Location Desk: bearish direction + a sell location — look for sells")
alertcondition(ev.lookBuy, "Read: LOOK FOR BUYS", "Location Desk: bullish direction + a buy location — look for buys")
alertcondition(ev.enterSell, "Entered a sell location", "Location Desk: price entered a sell location (top of a layer's range)")
alertcondition(ev.enterBuy, "Entered a buy location", "Location Desk: price entered a buy location (bottom of a layer's range)")
alertcondition(ev.enterEq, "50 % pullback after an initiation", "Location Desk: price pulled back into the 50 % band with the direction set — continuation location")
alertcondition(ev.stacked, "Stacked location", "Location Desk: two or more layers put price in the same-side location with the direction agreeing")
alertcondition(ev.dirChange, "Direction changed", "Location Desk: the chart's structure changed (bullish / bearish / sideways)")
alertcondition(ev.rangeFormed, "RIMC range formed", "Location Desk: a range formed — watching for the initiation")
alertcondition(ev.initiated, "RIMC initiation", "Location Desk: price initiated away from the range — the mitigation is the entry")
alertcondition(ev.sigL, "RIMC long", "Location Desk: long at the mitigation in a buy location")
alertcondition(ev.sigS, "RIMC short", "Location Desk: short at the mitigation in a sell location")
alertcondition(ev.skipped, "Mitigation skipped by the gate", "Location Desk: price mitigated the range but the read did not allow the trade")
alertcondition(ev.exit and ev.why == "TP", "Target reached", "Location Desk: target reached")
alertcondition(ev.exit and (ev.why == "SL" or ev.why == "BE"), "Stopped", "Location Desk: stop hit")
alertcondition(ev.exit and ev.why == "EOD", "Flat at the window end", "Location Desk: the trade window ended — position closed")
if ev.lookSell
    alert(payload("LOOK_FOR_SELLS", ""), alert.freq_once_per_bar_close)
if ev.lookBuy
    alert(payload("LOOK_FOR_BUYS", ""), alert.freq_once_per_bar_close)
if ev.enterSell
    alert(payload("ENTER_SELL_LOCATION", ""), alert.freq_once_per_bar_close)
if ev.enterBuy
    alert(payload("ENTER_BUY_LOCATION", ""), alert.freq_once_per_bar_close)
if ev.stacked
    alert(payload("STACKED_LOCATION", ""), alert.freq_once_per_bar_close)
if ev.dirChange
    alert(payload("DIRECTION", dirWord), alert.freq_once_per_bar_close)
if ev.initiated
    alert(payload("RIMC_INITIATION", rm.initDir == 1 ? "up" : "down"), alert.freq_once_per_bar_close)
if ev.sigL
    alert(payload("RIMC_LONG", t.locTxt), alert.freq_once_per_bar_close)
if ev.sigS
    alert(payload("RIMC_SHORT", t.locTxt), alert.freq_once_per_bar_close)
if ev.skipped
    alert(payload("MITIGATION_SKIPPED", ev.skipWhy), alert.freq_once_per_bar_close)
if ev.exit
    alert(payload("EXIT", ev.why), alert.freq_once_per_bar_close)
Why does the twin look or behave differently?
Its cloud, risk zones, dashboard and Co-Pilot start hidden. Its active Measurement grid overrides five normal inputs. Match the grid as well as ordinary settings when comparing scripts. Save the script before changing symbols.
Go deeper, one question at a time.
Complete rules and settings remain here.
How are the bands calculated?
A range has a high, a low and a midpoint. By default, its outer quarters become sell and buy locations; the continuation band extends five percent of the full range either side of its midpoint.
Rolling windows convert the selected timeframe’s bar count into chart bars, capped at four thousand. Swing ranges use the latest confirmed pivot high and low. Previous day uses the feed’s completed daily candle, independently of the trading-window timezone.
The default layers observe one hundred bars at five and fifteen minutes; the hourly layer starts off. Pivot confirmation delays swing references. A zero-height range is not ready. With outer zones expanded to half the range, they meet at the midpoint and the sell classification has priority.
How does direction differ from location?
A strict close beyond an unbroken confirmed chart swing sets bullish or bearish direction. The default pivot confirms five chart candles later; a wick or equal close is not a break.
A breaking body at least half a chart ATR marks a structure initiation. The impulse midpoint moves as the leg’s extreme extends. The read can turn sideways only after more than sixty candles since the break while price is strictly inside stored swings.
Continuation alignment can count an observation midpoint band and the impulse midpoint; it does not require the body-qualified initiation flag. That flag gates the named midpoint alert. A displayed count of two can therefore mean one observation layer plus the impulse midpoint.
First enabled layer means slot order, not automatic timeframe sorting. Its opposing outer zone blocks entry even when higher layers agree. Focus changes emphasis only. Labels such as low probability are interpretations, not measured chances.
Exactly what starts or ends a setup?
The last six candles must span no more than 1.2 chart ATR. Inside closes refresh the wait and can expand the small range while it still fits. A close must exceed an edge by strictly more than one range height to initiate by default.
A pending range expires after more than ten candles since its last inside close, unless that candle qualifies as initiation first. After initiation, a close through the far side invalidates before the return is considered.
First touch uses the wick, but enters at the touching candle’s close. Close-inside mode includes both edges. At the return, the small range’s midpoint is checked against current observation locations. Then direction, location, time window, existing trade, daily allowance and ledger permission determine whether it enters or skips.
A return consumes the setup even when skipped. The thirty-candle return allowance is checked after invalidation and return checks. Detection continues with the ledger off or a trade open, but these can block an entry.
How do I test the entry, stop and target?
1R is the initial distance from entry to stop. A short stop lies above entry; a long stop below. Default stop: the far small-range edge plus 0.1 chart ATR. Last-swing mode uses a swing only if it is further beyond that edge. The stop stays at least one tick beyond entry.
The indicator’s default target is 3R. Alternatives use the initiation extreme, including the returning candle, or the opposite entry-zone boundary of layer one. Missing or nearer-than-1R structure targets fall back to the R target.
- Record both outcomesA stop loses the planned risk distance. A reached target gains its planned distance before costs.
- Include costs and sizeSpread, commission and slippage reduce results. Position size determines the money at risk.
- Test another periodKeep the same rules and include every valid trade, including losses and skipped setups.
A 3R target does not mean three units will be earned. Reaching the target is uncertain. The display-only dollar-size estimate is not contract-aware sizing and does not set the twin’s order quantity.
What happens after entry?
The indicator starts management on later candles. Its paper ledger checks the stop first, then target, then an optional move of the stop to entry, then optional window-end closing. If stop and target share a candle, stop wins. A newly moved stop is not checked against an earlier wick on that same candle.
The trading window starts off. When enabled, end flattening uses the first outside-window candle’s close. Daily entry allowance resets by the selected timezone’s date, Europe/London by default.
The twin uses broker-emulator orders and fills, which can differ from the paper ledger. Its exit bracket is submitted only after a broker position exists; a signal’s displayed plan is not an already attached broker bracket.
How do I read the dashboard and Co-Pilot?
Direction: bullish, bearish or sideways. Location: each layer’s range and the alignment count. RIMC: the small range and return sequence. Gate: the missing entry permission. Record: paper outcomes on loaded history, without costs.
Brief Co-Pilot shows NOW. Standard adds WHY and PLAN. Detailed adds the record and glossary. Bearish in an allowed sell location reads look for sells; that remains a watch state until entry qualifies.
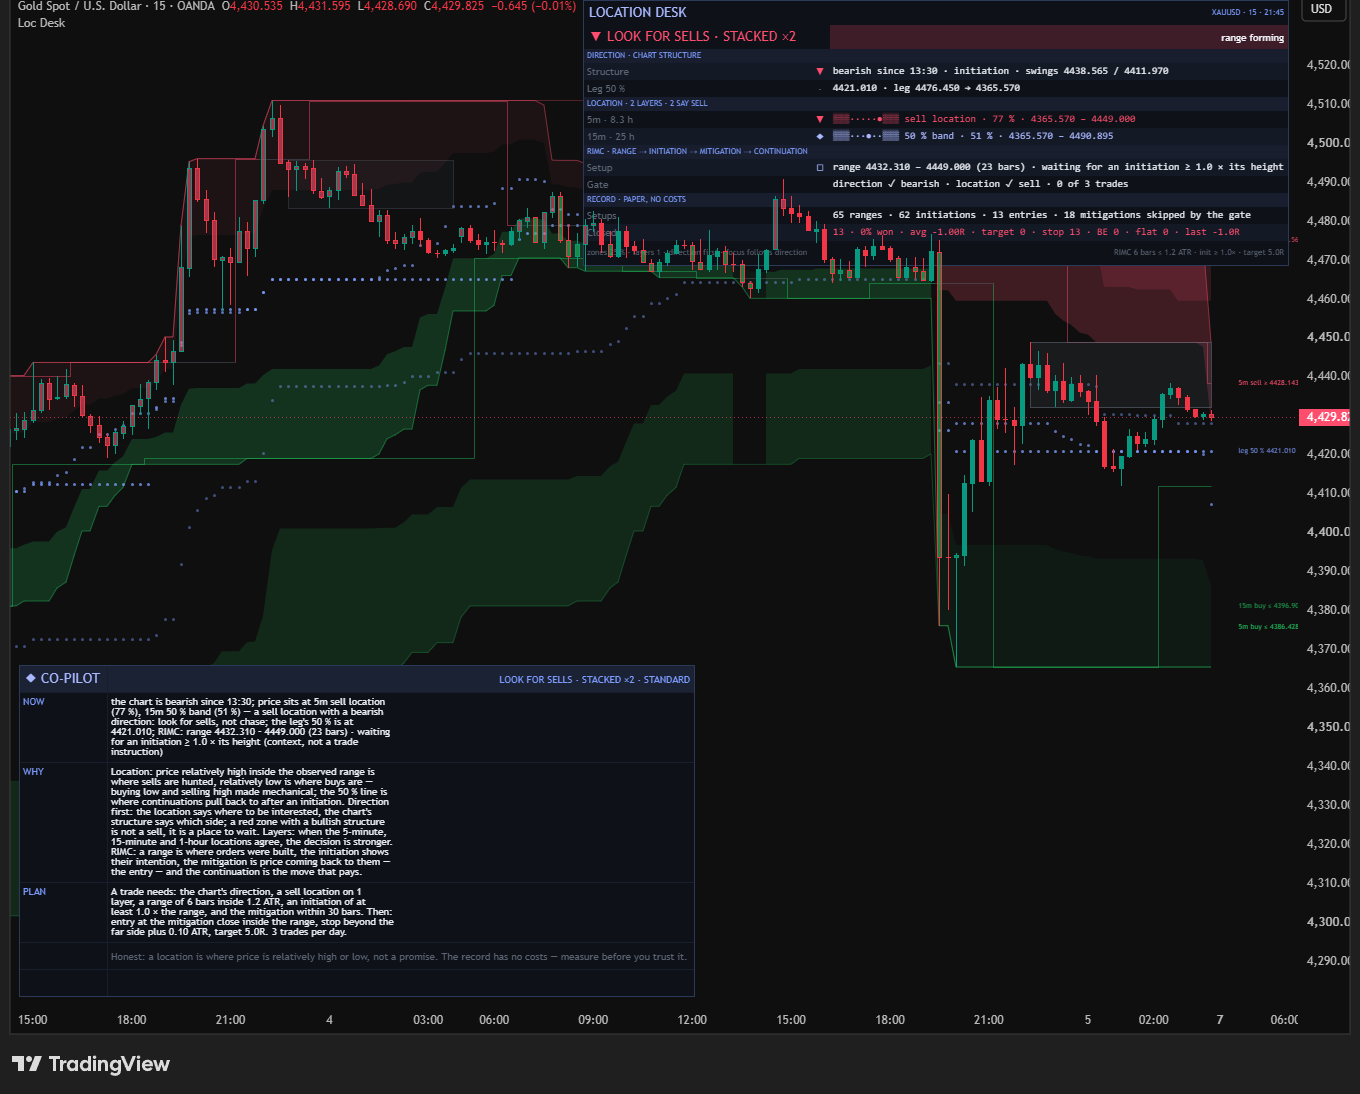
What does every setting change?
All fifty-nine indicator inputs, in source order. Twin differences are marked beside the default.
Observation ranges
Each layer chooses a frame of reference. Bars are converted to chart-bar windows; these are not necessarily exact higher-timeframe candle boundaries.
- Enable layer one
- On
- Layer one timeframe
- 5 minutes
- Layer one range method
- Rolling window
- Layer one history bars
- 100
- Enable layer two
- On
- Layer two timeframe
- 15 minutes
- Layer two range method
- Rolling window
- Layer two history bars
- 100
- Enable layer three
- Off
- Layer three timeframe
- 60 minutes
- Layer three range method
- Rolling window
- Layer three history bars
- 100
- Size of each outer zone
- 25 percent
- Midpoint band half-width
- 5 percent
- Swing-range pivot confirmation
- 5 candles
Direction
Direction uses confirmed chart swings, separately from the observation ranges.
- Chart pivot confirmation
- 5 candles
- Body size marking a structure initiation
- 0.5 ATR
- Age before an inside-swing close can read sideways
- 60 candles
Reading the location
The impulse midpoint can add an alignment. Focus changes emphasis, not entry rules. The twin's grid overrides its direction and alignment settings.
- Required alignment count
- 1
- Allow midpoint continuation locations
- On
- Require matching chart direction
- On
- Show and count impulse midpoint
- On
- Which side receives emphasis
- Follow direction
Entry and exit rules
ATR is the chart's fourteen-candle movement measure. First touch records entry at that candle's close. Indicator defaults are below; the twin's active grid also controls target, breakeven and window.
- Enable paper entries
- On
- Candles defining the small range
- 6
- Largest range height
- 1.2 ATR
- Strict distance beyond the range to initiate
- 1 range height
- Initiation wait allowance
- 10 candles
- Return wait allowance
- 30 candles
- Return rule
- First touch
- Target rule
- R multiple
- Indicator R target
- 3R
- Stop anchor
- Range edge
- Buffer past the stop anchor
- 0.1 ATR
- Move stop to entry at this gain
- 0 · disabled
- Entries allowed per local date
- 3
- Restrict entries to a time window
- Off
- Allowed window, when enabled
- 08:00–10:00
- Window and daily-budget timezone
- Europe/London
- Close at first candle outside enabled window
- On
- Optional display-only size estimate
- 0 · disabled
Appearance
Cloud plot colors are separate from the dashboard theme. Recolor them in TradingView's Style tab.
- Dashboard and explanation palette
- Aurora Neon
- Draw cloud fills
- On · Twin: Off
- Nearest cloud transparency
- 80
- Name the layers at the right edge
- On
- Show chart swing lines and marks
- On
- Small execution boxes to display
- Last 10
- Draw risk and reward zones
- On · Twin: Off
- Tint candles for open-trade direction
- On
- Tint candles at outer locations
- On
- Shade the enabled trading window
- On
Dashboard
Show the read, alignment, setup, gate and cost-free paper record.
- Show dashboard
- On · Twin: Off
- Dashboard position
- Top Right
- Dashboard text size
- Medium
Co-Pilot
Brief shows NOW, Standard adds WHY and PLAN, Detailed adds the record and glossary.
- Amount of explanation
- Brief · Twin: Off
- Explanation position
- Bottom Left
- Explanation text size
- Auto
- Approximate line width
- 64 characters
Alerts
Dynamic messages can use structured fields or readable text.
- Send dynamic messages as JSON
- On
The twin’s five active Measurement grid overrides
These take priority over its corresponding normal inputs. Some displayed labels still read the normal inputs, so check this grid directly. The twin has sixty-four inputs in total.
- Effective R target
- 5R
- Effective direction gate
- On
- Effective alignment count
- 1
- Effective window gate
- Off
- Effective breakeven gain
- 0 · disabled
Which events can send an alert?
The indicator has fifteen named conditions: look for sells/buys, entered sell/buy location, midpoint pullback, stacked location, direction changed, range formed, initiation, long/short entry, mitigation skipped, target reached, stopped and flat at window end.
Dynamic messages have eleven branches: LOOK_FOR_SELLS, LOOK_FOR_BUYS, ENTER_SELL_LOCATION, ENTER_BUY_LOCATION, STACKED_LOCATION, DIRECTION, RIMC_INITIATION, RIMC_LONG, RIMC_SHORT, MITIGATION_SKIPPED and EXIT. They omit midpoint and range-formed events; exits share EXIT with a reason.
Events commit on confirmed bars and dynamic calls use once per bar close. JSON carries src, symbol, tf, event, direction, read, layers, side, entry, sl, tp, reason and optional r. There is no separate stop-to-entry-moved alert. The named stacked event specifically requires two outer-zone layers, unlike the broader displayed count. Use the indicator’s named-condition menu; do not assume the twin exposes the same alert menu.
How do I compare my own results?
- Read direction, location and Gate before changing inputs.
- Follow waiting, entry, skipped and stopped examples.
- Put the twin on a second chart. Align its Measurement grid with the indicator.
- Set realistic quantity, commission and slippage; record symbol, timeframe, history and all settings.
- Change one rule, compare the same history, then check another period.
Twin header defaults: capital one hundred thousand, fixed quantity one, commission 0.02 percent per order and five ticks of slippage. Adapt cost assumptions to your market; stock-style commission alone does not model every forex spread or fee.
What did the measured comparison show?
We compared gold and EURUSD with costs, varying targets, stops, return rules, direction, alignment and the London window. The report keeps the complete grid, cost assumptions and history limits together. A faithful location engine does not establish a mechanical edge.
The lab notes are in review and will be linked here.
What can change the reading?
Rolling ranges can update during a live candle. Direction, paper trades and alert events commit at close. Different feeds, history, timeframes or settings can recalculate the map. The ATR-dependent engine needs enough loaded history before it can run.
The tool does not observe resting orders or predict a reversal. Its paper record has no costs. Trading risk is entirely yours; this is research tooling, not financial advice.
Which chart should I start with?
The published examples use EURUSD and gold. Use standard intraday candles with enough history; observation timeframes at least as large as the entry chart make the layers easier to interpret. The full tool remains free because it is an open-source answer to the community request.
Every change, dated
What shipped and what changed in Location Desk, newest first. Ask for the next change below; what gets built lands here with a date, and on the lab queue on the front page.
Location Desk v1.1.0 Shipped
Compares price with recent ranges, then checks direction.
Direction, location, then execution Lab note Location Desk
The location-bands request is complete: three cloud layers, direction-aware focus, an RIMC entry and a twin with adjustable costs.
- Buy and sell clouds drawn bar by bar on up to three timeframes
- Focus follows structure, with midpoint continuations and stacked locations
- RIMC entry, target and stop switches with a direction gate
- Location gauges, a Co-Pilot and separate bar-close alerts
Something to change in Location Desk?
A small friction or a big idea. Tell us what would make this tool work better for you.
Requests for a new tool go on the same queue: see what is asked for and what is being built.