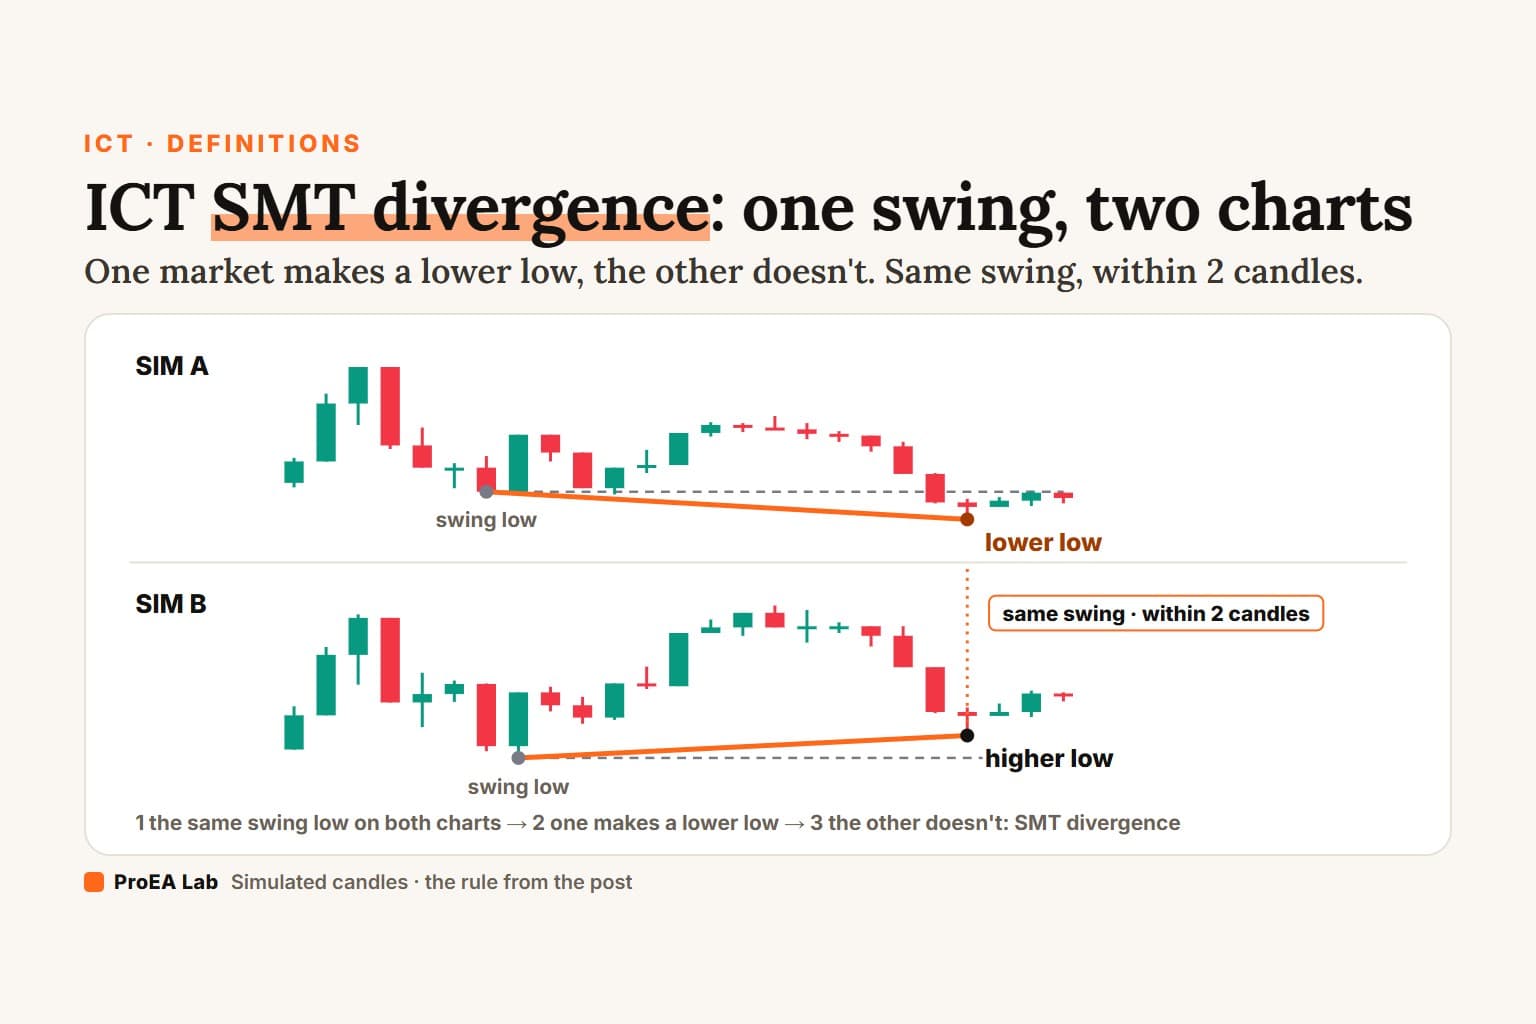
SMT divergence is when two markets that usually move together disagree at the same swing. One makes a lower low while the other makes a higher low (bullish), or one makes a higher high while the other makes a lower high (bearish). In this page's rule both swings are confirmed by 3 candles on each side, sit within 2 candles of each other (30 minutes on 15-minute charts), and each is compared, wick to wick, with its own market's previous swing. For an inverse pair, such as a dollar index against EURUSD, flip one chart first.
Every chart below is a replay of two simulated markets read by one written rule. The swings are the ones from BOS vs CHoCH. The low one market takes and the other doesn't is a liquidity sweep on one chart only.
What is SMT divergence?
Two charts that should agree, and don't. SMT stands for smart money technique (ictkillzone.com also spells it "Smart Money Tool"). innercircletrader.net: "ICT SMT divergence is a market condition where two correlated assets — viewed on the same timeframe — exhibit opposing price structure." (ICT SMT Divergence guide, last updated 3 May 2026, checked 2026-10-04.) ictkillzone.com puts it shorter: it "occurs when two highly correlated assets fail to confirm each other's swing extreme."
The guides read it as one market's stops taken without the other confirming the move. A chart can't show who took them. It shows two swings at the same time, and which one went further.
Simulated 15-minute candles, not market data. Two markets built from one shared random driver plus their own noise. Swings are confirmed by 3 candles on each side; the two swings of a pair must be within 2 candles.
Read as text
- Two simulated markets on 15-minute candles, SIM A and SIM B, move together: their 15-minute returns correlate at 0.89.
- At 16:30 SIM A prints a swing low at 118.67; SIM B prints a swing low at 181.66 1 candle later. That pair is the one to beat.
- At 20:15 SIM A prints a lower low: 118.36 against 118.67 at the pair before.
- At 20:15 SIM B prints a higher low: 182.06 against 181.66 at the pair before.
- The two swings are on the same candle, within the 2 the rule allows. At the 21:15 close, 3 candles after the later one, the rule reads one lower low and one higher low: a bullish SMT divergence.
- At 21:45 SIM A trades below its new low of 118.36, where the guides put the stop.
- The rule names the divergence. It says nothing about what price does next.
How this window was chosen: The first bullish SMT divergence in the simulated run that is easy to see: on each chart the new low sits at least a tenth of the chart's price range from the previous one (below it for the lower low, above it for the higher low), and the two pairs are 8 to 30 candles apart. Films never share a candle.
Use itPut both markets on the same timeframe, one chart above the other, and mark the last swing low (or high) on each. Then wait until both new swings are confirmed.
Watch outA swing is only known 3 candles after it. Until both are in, one market's new low is just a new low.
Which pairs work for SMT divergence?
Markets that usually move together, on the same clock. The guides name EUR/USD and GBP/USD, ES and NQ (S&P 500 and Nasdaq 100 futures), gold and silver, and BTC and ETH, plus inverse pairs: a dollar index (DXY) against EUR/USD, or against gold. innercircletrader.net: "the stronger the correlation between the two assets, the more reliable the SMT divergence will be." TradingFinder gives a floor: "If the correlation level is below 60%, SMT divergence does not have the required validity". Neither shows data behind it.
Our two simulated markets are built to move together: their 15-minute returns correlate at 0.89. Both trade the same hours, so every candle has a partner. Two real markets with different session hours don't, and a missing candle on one chart is a missing comparison.
Where do the guides disagree?
All checked 2026-10-04:
- How close in time. None gives a number. ictkillzone.com (updated September 2026): the two markets' swings "typically align within minutes of each other". TradingFinder (modified 9 Dec 2025) has EUR/USD form "a lower low on a specific date while GBP/USD simultaneously forms a higher low". LuxAlgo's SMT Divergences indicator (22 May 2023) counts one when "a swing on the chart ticker coincides with a swing on a comparison ticker", its swings confirmed after "a set number of candles (3 by default)".
- Wick or close. None says. ictkillzone.com: "The new extreme must be a structural swing point, not just a candle wick."
- Which timeframe. innercircletrader.net: "preferably 15-minute or lower". WritoFinance (7 Jan 2025): "Higher timeframes like H4, daily, or weekly provide stronger signals."
- Which market is the signal. ictkillzone.com: "The trade goes in the diverging asset — the one that made the false extreme." innercircletrader.net calls the asset making the lower low "the manipulating leg", then, for highs, "The asset making the lower high instead of the higher high is the manipulating leg." FXOpen (8 Jan 2026): "The main point is that neither asset leads".
- What confirms it. A market structure shift (ictkillzone.com), a "major structural break like Break of Structure (BOS) or Change of Character (CHOCH)" (WritoFinance), or an order block or fair value gap (TradingFinder).
The rule
SMT divergence rule
Two markets that move together, on the same 15-minute
candles (the same times). Wicks count.
1. Swing: a swing low is a candle whose low is below the
   lows of the 3 candles on each side, known once those 3
   candles have closed. Swing highs mirror it.
2. Same swing: one swing low on each market, at most 2
   candles (30 minutes) apart. A swing with no partner that
   close is skipped.
3. Compare: each market's new swing low with its own low at
   the previous pair.
4. Bullish SMT divergence: one market makes a lower low, the
   other doesn't (a higher or equal low). Bearish: one makes
   a higher high, the other doesn't.
5. Both make a lower low, or neither does: no divergence.
6. Known at the close that confirms the later swing. If
   either new swing has been traded through by then, there
   is no reading.
7. Inverse pair: flip the second chart (Invert scale) first.
8. Failed: the market that made the new extreme trades
   beyond it again.
The parts come from the guides above; the numbers are ours. The swing is the BOS vs CHoCH page's and LuxAlgo's: 3 candles on each side. The 2-candle limit is our number for "within minutes" on 15-minute candles. Wicks count because the swing is a wick. Step 6 drops a pair whose new low is already beaten when the read comes: it isn't the low any more. The failure line is where the guides put the stop: innercircletrader.net, "stop loss beyond the swept extreme of the asset you are trading".
SMT divergence or not?
Compare the same swing, and only that one. One new extreme makes a divergence. Two make agreement: the move confirmed on both charts. And two swings more than 2 candles apart aren't the same swing, so the rule reads nothing, however much the picture looks like a divergence.
Simulated 15-minute candles, not market data. Two markets built from one shared random driver plus their own noise. Swings are confirmed by 3 candles on each side; the two swings of a pair must be within 2 candles.
Read as text
- Two simulated markets on 15-minute candles, SIM A and SIM B, move together: their 15-minute returns correlate at 0.89.
- At 14:15 SIM A prints a swing low at 133.77; SIM B prints a swing low at 233.79 on the same candle. That pair is the one to beat.
- At 17:30 SIM A prints a higher low: 134.21 against 133.77 at the pair before.
- At 17:30 SIM B prints a lower low: 230.89 against 233.79 at the pair before.
- The two swings are on the same candle, within the 2 the rule allows. At the 18:30 close, 3 candles after the later one, the rule reads one lower low and one higher low: a bullish SMT divergence.
How this window was chosen: The first bullish SMT divergence after the first film's, under the same visibility rule.
Use itRead the swings in pairs, at the same time on both charts, and compare each market only with itself.
Watch outComparing one market's low with a later or earlier low on the other chart finds a divergence almost anywhere.
How do you read SMT divergence with DXY?
Flip it. A dollar index moves against EUR/USD, so a lower low on EUR/USD lines up with a higher high on DXY. As it trades, the divergence is a lower low on one chart without a higher high on the other, or the reverse. ictkillzone.com: "If gold sweeps a high but DXY does not make a corresponding new low, the gold move is suspect."
TradingView can turn a chart upside down: "To turn the chart over, you can use Alt+I" (TradingView help, checked 2026-10-04). Flipped, the inverse market's highs become lows, and the pair reads like any other.
Simulated 15-minute candles, not market data. Two markets built from one shared random driver plus their own noise. Swings are confirmed by 3 candles on each side; the two swings of a pair must be within 2 candles. SIM X takes the shared driver with the opposite sign, as a dollar index moves against a dollar pair.
Read as text
- Two simulated markets on 15-minute candles, SIM A and SIM X, move against each other: their 15-minute returns correlate at −0.89.
- At 13:00 SIM A prints a swing low at 156.27; SIM X prints a swing high at 62.79 on the same candle. That pair is the one to beat.
- At 15:15 SIM A prints a lower low: 155.96 against 156.27 at the pair before.
- At 15:30 SIM X prints a lower high: 62.60 against 62.79 at the pair before.
- The two swings are 1 candle apart, within the 2 the rule allows. At the 16:30 close, 3 candles after the later one, the rule reads a lower low on SIM A without a higher high on SIM X: an SMT divergence, bullish for SIM A.
- At 17:00 SIM A trades below its new low of 155.96 again.
- As it trades, SIM X rises when SIM A falls, so SIM A's swing lows line up with SIM X's swing highs. The divergence is a lower low on SIM A without a higher high on SIM X.
How this window was chosen: The first SMT divergence, either way, between SIM A and the inverse market SIM X (read flipped), under the first film's visibility rule.
Use itInvert the inverse market's scale before you compare. Then read it exactly like a pair that moves together.
Watch outAn inverted chart is easy to forget. Its labels still show the real prices, now growing downward.
What if the SMT divergence fails?
Then the market that made the new extreme keeps going: price trades beyond it again. ictkillzone.com: "If price trades back above that wick after you've entered short, the SMT signal has been invalidated — the move may be genuine after all."
Simulated 15-minute candles, not market data. Two markets built from one shared random driver plus their own noise. Swings are confirmed by 3 candles on each side; the two swings of a pair must be within 2 candles.
Read as text
- Two simulated markets on 15-minute candles, SIM A and SIM B, move together: their 15-minute returns correlate at 0.89.
- At 18:30 SIM A prints a swing high at 89.30; SIM B prints a swing high at 149.67 on the same candle. That pair is the one to beat.
- At 01:15 SIM B prints a higher high: 150.19 against 149.67 at the pair before.
- At 01:45 SIM A prints a lower high: 88.94 against 89.30 at the pair before.
- The two swings are 2 candles apart, within the 2 the rule allows. At the 02:45 close, 3 candles after the later one, the rule reads one higher high and one lower high: a bearish SMT divergence.
- At 03:15, 3 candles after the read, SIM B trades above its new high of 150.19. A stop beyond the divergence's high, where the guides put it, is hit.
- The rule read the divergence correctly. Price still went the other way.
How this window was chosen: The first SMT divergence, either way, after the first two films', under the same visibility rule, whose new extreme is traded through again within 4 hours of the divergence being known.
Use itWrite down where the divergence is wrong before you act on it: beyond the new extreme of the market that made it.
Watch outFXOpen: 'Its reliability decreases in highly volatile or choppy environments where correlations break down temporarily.'
Does SMT divergence show up in random prices?
Yes. Our two simulated markets have no orders, no stops and nobody behind them: one shared random driver plus each market's own noise. By this rule they printed 372 SMT divergences (181 bullish, 191 bearish) in 3,247 swing comparisons over 364 simulated days, a count that depends on how we built the simulation and says nothing about how often real markets print one. On the simulated inverse pair, flipped, the rule found 370, again a property of our simulation, not of real markets.
Price traded through the new extreme again within 4 hours after 194 of the 372 divergences, and after 888 of the 1,449 pairs where both markets made the new extreme; both counts come from our simulation's shared drift and say nothing about how often a real divergence holds.
So a gap like that between divergences and confirmed swings can come from plain statistics. It doesn't need anyone hunting stops. In the simulation, 1,165 of SIM A's 4,480 swings had no partner on the other chart within 2 candles, a count that depends on how we built it; the rule skips those swings.
SMT divergence vs liquidity sweep
A liquidity sweep is read on one chart: a wick through a level and a close back. SMT divergence needs two charts, and it's about the swing, not the close: one market takes its low and the other doesn't. A sweep on one chart that its partner doesn't make is both.
The same sweeps have clocks in other ICT models. The Judas swing runs the Asian range between midnight and 05:00 New York; candle range theory (CRT) sweeps one side of a 4-hour candle. Neither needs a second market. The rule here ignores the clock: if you trade only inside the ICT killzones, read SMT there and nowhere else.
How to trade SMT divergence, step by step
- Pick the pair and the timeframe before the session: two markets that move together (or an inverse pair, flipped), same candles.
- Mark the last pair of swing lows (or highs), one on each chart, at most 2 candles apart.
- Wait for the next pair. Both swings have to be confirmed: 3 candles after each.
- Compare each market with itself. One new extreme and one not is the divergence.
- Pick your entry before the read: a fair value gap, an order block, a close through the last swing on the lower timeframe.
- Stop beyond the new extreme of the market that made it. A trade beyond it ends the idea.
- No pair within 2 candles: no reading.
Common mistakes
- Comparing different swings. A low at 10:00 on one chart and 11:15 on the other aren't the same swing.
- Calling it before the swings are confirmed. Until 3 candles close after each, a new low can go lower.
- Forgetting to flip the inverse pair. DXY's higher high is EUR/USD's lower low.
- Mixing sessions. A market that's closed while the other trades has no candle to compare.
- Trusting the shape. Our random simulated prices, with nobody behind them, print about one a day, which says nothing about real markets except that the shape alone proves nothing.
- No stop beyond the extreme. Even in our random simulated prices, which say nothing about real markets, about half the divergences saw that extreme traded again within 4 hours.
Does SMT divergence work?
Which tools check SMT divergence?
None of ours draws an SMT divergence on the chart, and none uses this page's paired-swing rule. Three can require an SMT check against a second market you pick, each off by default. We read the Pine source of each.
An SMT check inside one chart, free. IFVG Desk (1.2.0) can require a synchronized SMT: the previous candle makes a new low (or high) of the 10 candles before it, and the comparison market's candle at the same time doesn't. It compares with ES futures (CME_MINI:ES1!) by default, has an Inverse setting that compares the other side, and lists the check as "SMT vs ES1!" in its panel. Sweep Desk (2.0.0) has the same idea as "Require paired-market SMT": BTCUSDT by default, a 10-candle window, an inverse switch, and the check stays valid for 6 candles. Both read single candles, not two confirmed swings, so they can fire before this page's rule does.
Gold Sweep Desk Pro (USD 49, one-time) compares gold with silver (OANDA:XAGUSD) by default: a candle where gold makes a new high or low of the last 20 candles and silver doesn't. A plan's badge gains "SMT" when such a candle falls between its raid and its sweep, and a switch, off by default, skips plans without one. It has no inverse setting. The SMC AI-Scored Toolkit (v1.4.2) doesn't check SMT; it scores order blocks and fair value gaps.
By hand on TradingView: a two-chart layout ("Select Layout"), with interval, crosshair and time synced, shows the pair as in the films. TradingView's Basic plan allows 1 chart per tab and Essential 2 (TradingView pricing, checked 2026-10-04). On one chart, the Compare tool overlays the second market: "When you add a symbol to a chart, the vertical axis will change from price to percentage" (TradingView help). Mark each market's swings, check they're within 2 candles, and compare each with its own last swing. Alt+I flips an inverse market.
More concepts, each with one rule and its own replays: smart money concepts.
Disclosure
We build IFVG Desk and Sweep Desk and give them away; we sell Gold Sweep Desk Pro, the SMC AI-Scored Toolkit and other indicators. We have no relationship with innercircletrader.net, TradingFinder, ictkillzone.com, LuxAlgo, WritoFinance, FXOpen or TradingView. Nothing here is financial advice.
Use these animations on your site.