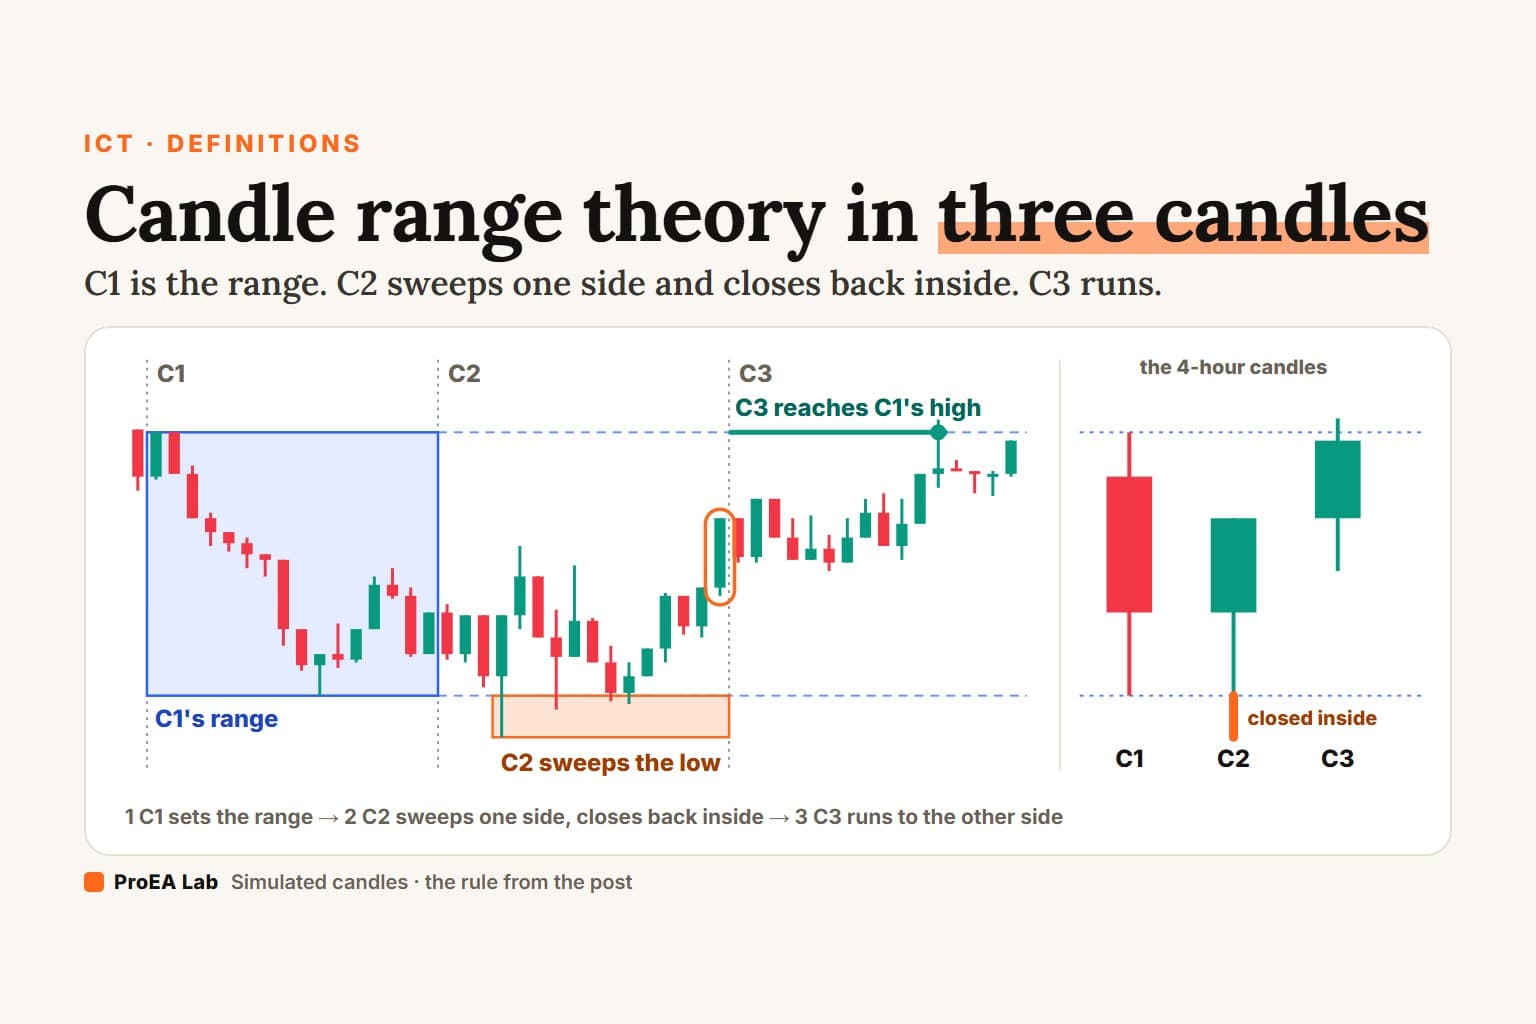
Candle range theory (CRT) is a three-candle read: the high and low of one higher-timeframe candle (C1) are the range; the next candle (C2) trades beyond one side and closes back inside; the expectation is a run to the other side (C3). It is a liquidity sweep read on one candle, decided by that candle's close.
Every chart below is a replay of simulated candles. The 4-hour candles open at 01:00, 05:00, 09:00, 13:00, 17:00 and 21:00 New York time.
The wick is the sweep.
The 4-hour close is the decision.
Until C2 closes, nobody knows if it is a CRT or a breakout.What is candle range theory (CRT)?
Three candles on one timeframe, usually the 4-hour or the daily. C1 sets the range. C2 sweeps one side of it and closes back inside. C3 is expected to run to the other side.
Simulated 15-minute candles, not market data. Times are New York; the 4-hour candles open at 01:00, 05:00, 09:00, 13:00, 17:00 and 21:00. Only C2's 4-hour close decides; C3 gets one 4-hour candle.
Read as text
- Simulated 15-minute candles, New York time. C1 is the 4-hour candle from 05:00 to 09:00: high 99.37, low 98.42. That is the range.
- At 09:45 C2 trades below C1's low, as far as 98.27.
- C2 closes at 13:00 at 99.06, back inside C1's range: a bullish CRT. The target is C1's high, 99.37; C2's low, 98.27, is the level that proves it wrong.
- At 15:45, inside C3, price reaches 99.37, C1's high, without trading below 98.27 first.
- On the 4-hour chart that is three candles: C1's range, C2's wick below it with a close inside, and C3 running to C1's high.
How this window was chosen: The first simulated bullish CRT whose third candle reaches C1's high, so every step shows, with a C1 range at least 4 average 15-minute candles tall and a sweep at least half an average candle below C1's low.
Use itMark C1's high and low the moment it closes. That is the whole range; nothing else on the chart sets it.
Watch outThe Bullish CRT tab was picked because its C3 reaches the other side, so every step shows. The third film shows the ones that didn't.
The guides we read describe the same three steps, checked 2026-10-04:
- innercircletrader.net (updated 13 May 2026): "Candle Range Theory is based on the liquidity raid of the previous candle range and then a run to the next liquidity level."
- ForexBee (updated 21 Sep 2026): the second candle "will falsely break the previous range and then close inside the previous candlestick range."
- TradingFinder (modified 21 Dec 2025) and WritoFinance (updated 22 Sep 2026) tie it to the accumulation, manipulation and distribution of ICT's power of 3.
CRT or breakout: what decides?
C2's close, on its own timeframe. A 15-minute close beyond C1's low inside a 4-hour C2 decides nothing. Neither does a 15-minute close back inside.
Simulated 15-minute candles, not market data. Times are New York; the 4-hour candles open at 01:00, 05:00, 09:00, 13:00, 17:00 and 21:00. Only C2's 4-hour close decides; C3 gets one 4-hour candle.
Read as text
- Simulated 15-minute candles, New York time. C1 is the 4-hour candle from 01:00 to 05:00: high 99.90, low 97.82. That is the range.
- At 05:30 C2 trades above C1's high. Nobody can know yet whether C2 will close back inside or beyond it.
- At 05:45 a 15-minute candle closes above C1's high. On the 15-minute chart that looks like a breakout, but C2, the 4-hour candle, is still open.
- C2 closes at 09:00 at 99.42, back inside C1's range: a bearish CRT. Only that close counts.
- C3 closes at 13:00 at 98.95, having reached neither C1's low (97.82) nor C2's high (100.19).
How this window was chosen: The first simulated CRT, either direction, whose second candle closes beyond the swept side on at least three 15-minute candles before its 4-hour close comes back inside C1's range, with a C1 range at least 4 average candles tall and a sweep at least half an average candle beyond it.
Use itRead the 4-hour close, then decide. Back inside C1's range: a CRT. On or beyond the swept side: a breakout.
Watch outThe lower timeframe flips back and forth while C2 is open. Both tabs fooled the 15-minute chart before the 4-hour close.
innercircletrader.net says the same: "A wick that pokes the level and continues without a close-back is not a CRT, it is just a continuation."
The rule
CRT rule (this page)
1. C1: one closed 4-hour candle. Its high and low
   are the range.
2. C2: the next 4-hour candle trades beyond ONE side
   of the range. Beyond both sides: no CRT.
3. Close: C2 closes strictly inside C1's range.
   On or beyond the swept side: a breakout.
   Only the 4-hour close counts, not 15-minute closes.
4. Direction: C2 swept C1's low = bullish, target
   C1's high. Swept C1's high = bearish, target C1's low.
5. Wrong: price trades beyond C2's extreme, its low
   in a bullish CRT, its high in a bearish one.
6. C3 decides: reached = the target trades first;
   taken = C2's extreme trades first (one candle doing
   both counts as taken); stalled = C3 closes with neither.
Each step comes from a guide above; the combination, and the one-candle deadline for C3, are ours. The films read 15-minute candles inside each 4-hour one.
Where do the guides disagree?
On almost everything after the close:
- What closes inside. innercircletrader.net: "The raiding candle must close back inside the range." WritoFinance says the theory "focuses on analyzing the range of candlestick bodies", then measures a candle's range from its high to its low.
- The target. innercircletrader.net targets "the CRT-High or the next liquidity level above." TradingFinder: "many CRT traders consider the 50% level of the range as the first safe target." ForexBee takes profit at 50% first, then at the range's other end.
- The entry. innercircletrader.net waits for a lower-timeframe market structure shift: "Entering on the raid alone front-runs the setup." Its stop sits "below the low of the candlestick that raided the liquidity or below the MSS-low."
- The clock. WritoFinance lists "1am, 5am, 9am 1pm, 3pm, 9pm" as key times, with no time zone.
What are the 1 am, 5 am and 9 am candles?
Three of the six 4-hour candles of a chart whose day starts at 17:00 New York. TradingView starts gold's 4-hour candles at 17:00 New York: we found that out the hard way in our Fractal Model study. So its 4-hour candles open at 17:00, 21:00, 01:00, 05:00, 09:00 and 13:00.
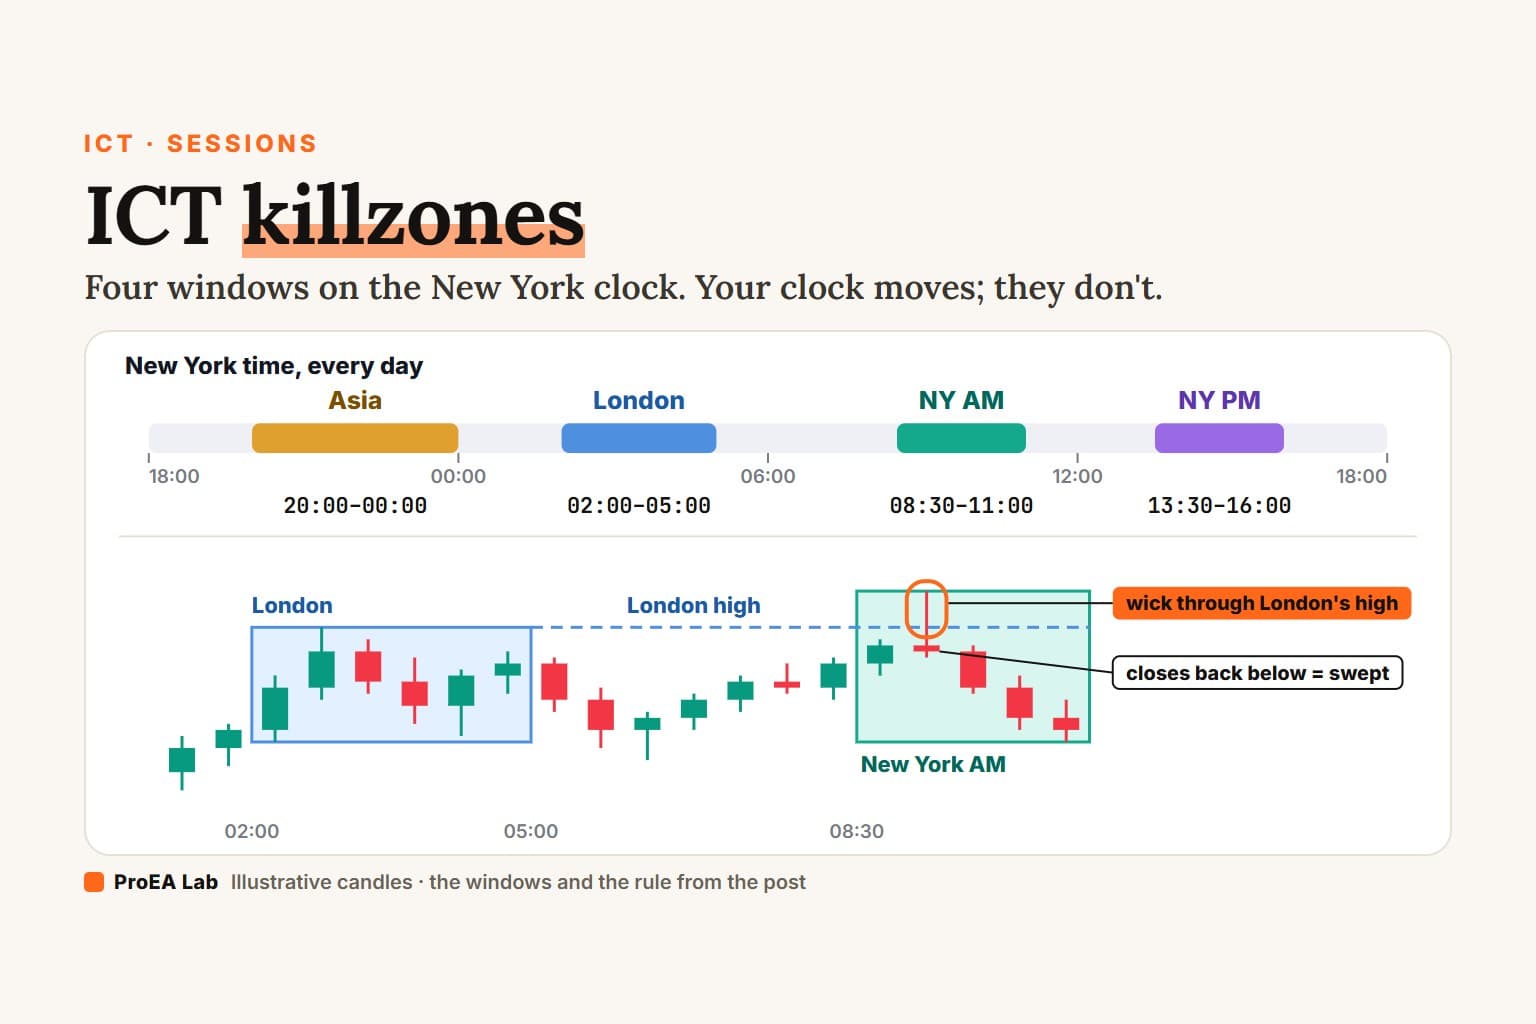
The 01:00 candle holds the London session of the ICT killzones (02:00–05:00); the 09:00 candle holds most of the New York morning. Check your own chart: hover the first 15-minute candle of a 4-hour candle and read its time.
What goes wrong?
Three things, all common. C3 trades through C2's extreme before it reaches the target. C3 goes nowhere. Or C2 sweeps both sides, and there is no direction to read.
Simulated 15-minute candles, not market data. Times are New York; the 4-hour candles open at 01:00, 05:00, 09:00, 13:00, 17:00 and 21:00. Only C2's 4-hour close decides; C3 gets one 4-hour candle.
Read as text
- Simulated 15-minute candles, New York time. C1 is the 4-hour candle from 09:00 to 13:00: high 118.28, low 117.07. That is the range.
- At 13:00 C2 trades below C1's low, as far as 116.53.
- C2 closes at 17:00 at 117.15, back inside C1's range: a bullish CRT, target 118.28.
- At 20:30, inside C3, price trades below 116.53, C2's low, before it reaches C1's high. The read was wrong.
How this window was chosen: The first simulated CRT whose third candle trades beyond C2's extreme before it reaches C1's other side, with a C1 range at least 4 average candles tall and a sweep at least half an average candle beyond it.
Use itBefore C3 opens, write down both prices: the target (C1's other side) and C2's extreme. One of them usually trades first.
Watch outA C2 that sweeps both sides looks like two CRTs at once. By this rule it is none.
Is CRT the same as AMD (power of 3)?
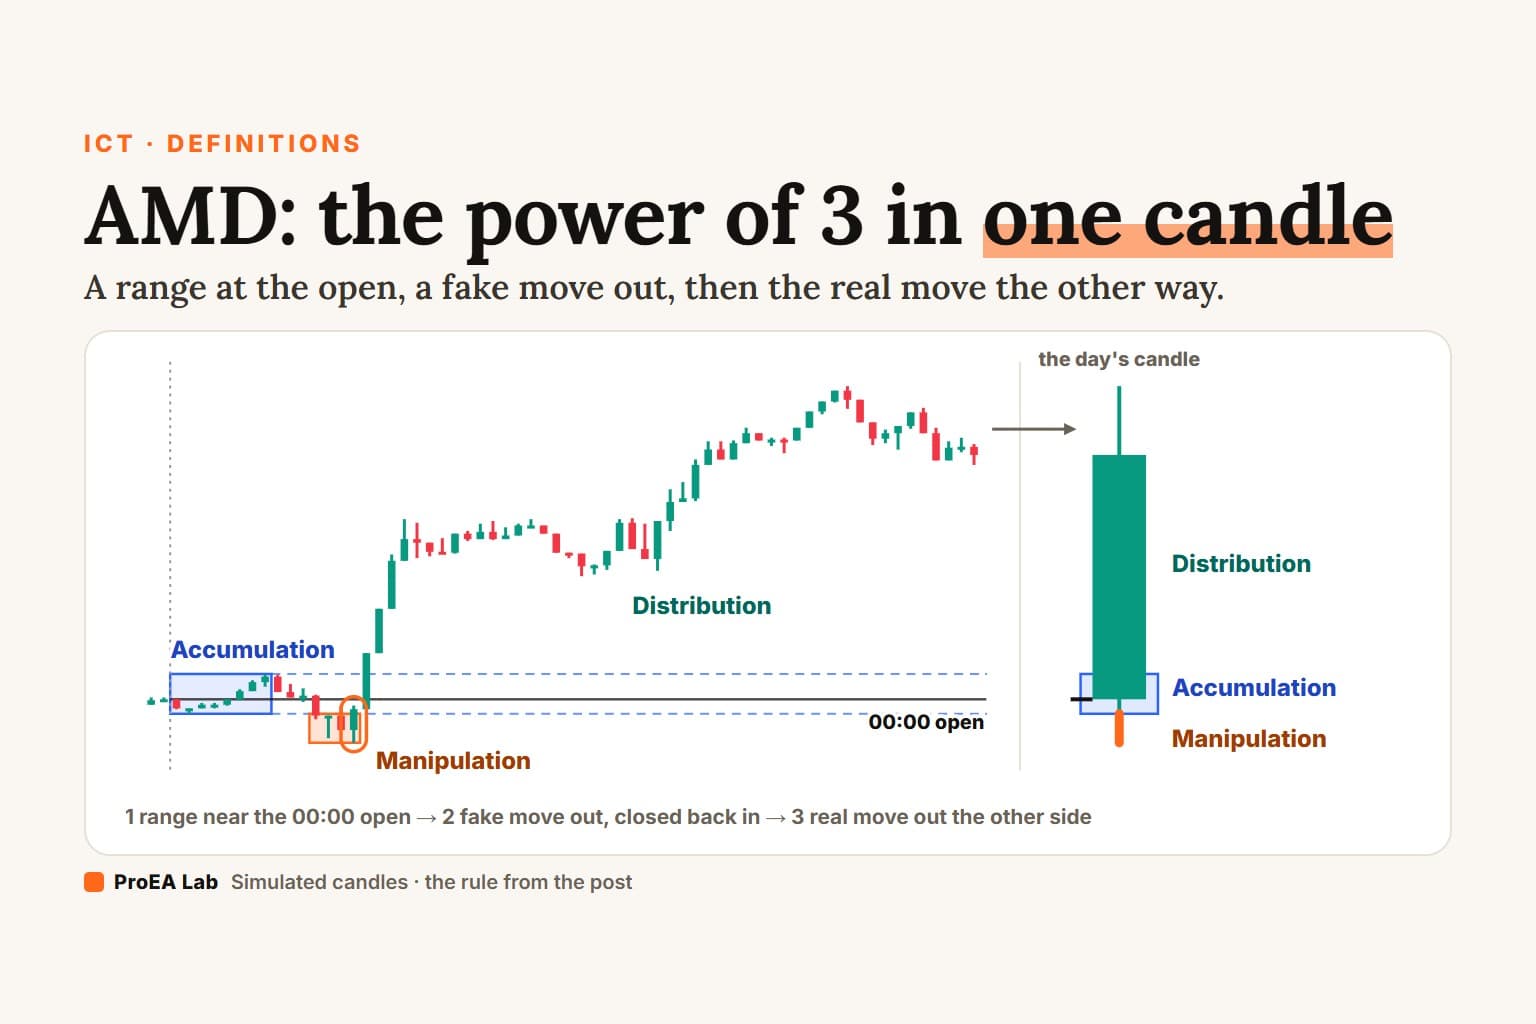
The same shape, at a different scale. AMD (power of 3) reads one day: a range near the open, a fake move out of one side, then the real move out of the other. CRT reads three candles: C1 is the range, C2's sweep is the fake move, C3 is the run. innercircletrader.net calls CRT "basically the application of the ICT Power of 3."
A sweep can also be checked against a second market. When one market takes its low and a market that usually moves with it doesn't, at the same swing, ICT calls it an SMT divergence.
The session version has its own name. ICT's Judas swing takes the Asian range as the range and 00:00 to 05:00 New York as the clock: a run of one side, a close back inside, then a close back through the midnight open.
The daily fade that came before both is turtle soup: a new 20-day low or high that breaks one made at least four sessions earlier, faded on a stop order before the day closes.
What timeframe is best for CRT?
innercircletrader.net: "the daily, H4 and H1 candles produce the cleanest CRT ranges in my own log." We haven't compared timeframes for this rule. Our Fractal Model study did, for its stricter version: after costs it only went down, "and the shorter the timeframe the faster."
How to read a CRT, step by step
- Pick the timeframe (4-hour here) and mark C1's high and low when it closes.
- Watch C2. Note which side it trades beyond first, and whether it also takes the other side.
- Wait for C2's close. Strictly inside C1's range and only one side swept: a CRT. Anything else: none.
- Write down the target (C1's other side) and C2's extreme.
- Watch C3: which trades first? If neither has by C3's close, it stalled.
Common mistakes
- Calling it before C2 closes. A wick beyond C1 is a sweep or a breakout; only the close says which.
- Reading the 15-minute closes as the decision. They flip while C2 is open.
- Taking a two-sided sweep. Both of C1's sides went: no direction.
- Moving the target after the fact. Pick C1's other side or the 50% before C3 opens.
- No level that proves it wrong. C2's extreme is that level.
- Clocks that don't match. "9 am" is a 4-hour open only on a chart whose day starts at 17:00 New York.
Does candle range theory work?
The test that matters is cheap: run the same rule with C3's deadline and your costs, on your market, and count all three outcomes.
How does CRT differ from what we tested?
| This page's CRT rule | Our Fractal Model test (textbook version) | |
|---|---|---|
| The range | C1, one closed 4-hour candle | C1, one closed 4-hour, 1-hour or daily candle |
| The sweep | C2 trades beyond one side | the same |
| The close | C2 closes strictly inside C1's range | the same, or a C3 that holds C2's extreme and closes back through C2's body |
| Extra condition | none | a CISD on the lower timeframe |
| Both sides swept | no CRT | a setup on each side |
| Target | C1's other side | the same |
| Wrong when | C2's extreme trades | a stop at the sweep's extreme |
| Deadline | C3's close | C4's close |
| Costs | none: a read, not a trade | per market, per round trip |
So our test isn't this page's rule. It is the closest test we have, and it found nothing after costs.
Which tools draw CRT?
None of ours draws CRT exactly as this page writes it. Fractal Model Desk comes closest. We checked each tool's Pine source.
The closest: Fractal Model Desk, free. Set its View to Audit. It labels each sweep ("C2 · low swept"), C2's close ("C2 · inside C1" or "C2 · outside C1"), C2's extreme as a dashed line, and "C1 opposite level reached". On a 15-minute chart it reads 4-hour candles and draws them beside price.
Where it differs: it watches through C4, it also accepts a C3 closure, and it keeps a two-sided sweep, noted "Two-sided sweep / direction unresolved". Its default Focus view shows only the two latest setups that also passed its CISD and delivery checks.
ICT Levels Desk, free, draws C1's range for a daily CRT, the previous day's high and low (on by default), and for a 4-hour CRT, the previous 4-hour high and low (P4H · P4L, off by default). It marks a level ⚡ swept when the first chart candle to trade through it closes back: the chart's candle, not the 4-hour or daily close.
Sweep Desk and Gold Sweep Desk, free, both count the previous day's high and low as liquidity and call a raid a sweep when chart candles close back inside. Same difference: the chart candle decides, not the daily one.
For an entry on the pullback once C3 starts to run, ICT's version is the optimal trade entry (OTE): 62% to 79% back into the leg that broke structure. No tool of ours draws it either.
More concepts, each with one rule and its own replays: smart money concepts.
Disclosure
We build Fractal Model Desk, ICT Levels Desk, Sweep Desk and Gold Sweep Desk and give them away under MIT; we sell other indicators. We have no relationship with innercircletrader.net, ForexBee, TradingFinder or WritoFinance. Nothing here is financial advice.
Use these animations on your site.