A trader asked us a simple question.
"Is your Fractal Model Desk like TTrades' fractal model?"
It is built from his public material. So we asked the question behind the question.
Does the model, written as rules, make money?
We wrote the test down first, then ran 108 versions on seven markets from January 2018 to September 2026. Nothing passed.
This article is where the numbers live. The free page carries none of them.
The rule, in one replay
The model starts when one 4-hour candle (C2) sweeps the last one (C1). The 15-minute chart then has to close back through the open of the run that made the extreme (the CISD), and C2 has to close back inside C1. The stop sits at the extreme; the target is C1's other end.
Simulated 15-minute candles, not market data, run through the study's rule. Setup 1 is the first setup whose trade reaches C1's far side, so every step shows; Another setup plays the rest in order, whatever they did. R is after a 0.40 round-trip cost.
Read as text
- C1, the four-hour candle, closes at 12:00 UTC: high 2394.41, low 2382.89.
- 12:15: a candle of C2 trades below C1's low. A long setup starts.
- 15:30: a 15-minute close above 2386.36, the open of the run of down candles that made the low (2377.80).
- C2 closes back inside C1's range: the swing is confirmed.
- 16:00: entry at 2390.96, stop 2377.80, target 2394.41 (C1's high).
- 19:30: the target fills at 2394.41: +0.23R after a 0.40 round-trip cost.
That is the whole skeleton, and it is what we tested. Three timeframe pairs, three entries, three targets and four filters make 108 versions. The part TTrades adds by hand (a point of interest, a daily bias, an objective) cannot be turned into rules, so it was not tested.
How we measured it
The test was written down and fingerprinted (SHA-256) before the first run, so no rule could be bent after we saw a result. We chose on 2018–22, checked on 2023–24, and ran one final test on January 2025 to September 2026.
- Data: 5-minute bars, about 4.7 million of them: XAUUSD, EURUSD, GBPUSD, USDJPY, Nasdaq 100 and S&P 500 CFDs (Dukascopy) and BTCUSDT (Binance).
- Costs per round trip: gold 0.40, EURUSD 1.0 pip, GBPUSD 1.4 pips, USDJPY 1.0 pip, Nasdaq 2.0 points, S&P 0.6, Bitcoin 0.12%. A stressed run used 1.5×. No overnight financing.
- Fills: decide at the close, fill at the next open; if a candle touches both the stop and the target, we count the stop.
Which versions made money?
Almost none, and never the same ones twice. Flip the periods and watch the grid.
Table: all 108 versions, R per trade after costs
| Version | 2018–2022 | 2023–2024 | 2025–26 |
|---|---|---|---|
| 4H on 15m · Early CISD · C1 target · no filter | −0.117 (21,275) | −0.141 (8,733) | −0.113 (7,740) |
| 4H on 15m · Early CISD · C1 target · Time | −0.097 (15,211) | −0.155 (6,149) | −0.110 (5,540) |
| 4H on 15m · Early CISD · C1 target · Fast CISD | −0.123 (18,264) | −0.148 (7,665) | −0.123 (6,772) |
| 4H on 15m · Early CISD · C1 target · Daily bias | −0.141 (11,882) | −0.168 (4,868) | −0.135 (4,306) |
| 4H on 15m · Early CISD · 2.5× leg · no filter | −0.105 (22,168) | −0.124 (9,222) | −0.099 (8,072) |
| 4H on 15m · Early CISD · 2.5× leg · Time | −0.090 (16,066) | −0.139 (6,600) | −0.101 (5,848) |
| 4H on 15m · Early CISD · 2.5× leg · Fast CISD | −0.107 (19,169) | −0.129 (8,120) | −0.114 (7,055) |
| 4H on 15m · Early CISD · 2.5× leg · Daily bias | −0.123 (12,657) | −0.151 (5,259) | −0.119 (4,583) |
| 4H on 15m · Early CISD · 4× leg · no filter | −0.100 (20,540) | −0.118 (8,610) | −0.088 (7,495) |
| 4H on 15m · Early CISD · 4× leg · Time | −0.087 (15,299) | −0.134 (6,317) | −0.081 (5,570) |
| 4H on 15m · Early CISD · 4× leg · Fast CISD | −0.101 (18,127) | −0.126 (7,745) | −0.099 (6,697) |
| 4H on 15m · Early CISD · 4× leg · Daily bias | −0.118 (12,802) | −0.154 (5,375) | −0.104 (4,657) |
| 4H on 15m · Confirmed · C1 target · no filter | −0.091 (12,465) | −0.110 (4,701) | −0.107 (4,279) |
| 4H on 15m · Confirmed · C1 target · Time | −0.075 (7,570) | −0.122 (2,782) | −0.096 (2,552) |
| 4H on 15m · Confirmed · C1 target · Fast CISD | −0.093 (9,004) | −0.110 (3,469) | −0.119 (3,207) |
| 4H on 15m · Confirmed · C1 target · Daily bias | −0.090 (6,689) | −0.126 (2,489) | −0.086 (2,277) |
| 4H on 15m · Confirmed · 2.5× leg · no filter | −0.078 (12,528) | −0.099 (4,782) | −0.080 (4,149) |
| 4H on 15m · Confirmed · 2.5× leg · Time | −0.074 (7,915) | −0.112 (2,935) | −0.080 (2,575) |
| 4H on 15m · Confirmed · 2.5× leg · Fast CISD | −0.080 (8,683) | −0.085 (3,358) | −0.093 (2,920) |
| 4H on 15m · Confirmed · 2.5× leg · Daily bias | −0.076 (6,930) | −0.123 (2,657) | −0.058 (2,285) |
| 4H on 15m · Confirmed · 4× leg · no filter | −0.078 (15,025) | −0.103 (5,847) | −0.074 (5,152) |
| 4H on 15m · Confirmed · 4× leg · Time | −0.074 (9,894) | −0.111 (3,736) | −0.065 (3,350) |
| 4H on 15m · Confirmed · 4× leg · Fast CISD | −0.081 (11,174) | −0.084 (4,407) | −0.083 (3,909) |
| 4H on 15m · Confirmed · 4× leg · Daily bias | −0.070 (8,628) | −0.120 (3,351) | −0.057 (2,920) |
| 4H on 15m · Retest · C1 target · no filter | −0.086 (9,193) | −0.139 (3,299) | −0.101 (2,997) |
| 4H on 15m · Retest · C1 target · Time | −0.053 (5,526) | −0.150 (1,944) | −0.075 (1,793) |
| 4H on 15m · Retest · C1 target · Fast CISD | −0.092 (6,257) | −0.137 (2,273) | −0.116 (2,118) |
| 4H on 15m · Retest · C1 target · Daily bias | −0.064 (4,922) | −0.147 (1,731) | −0.106 (1,569) |
| 4H on 15m · Retest · 2.5× leg · no filter | −0.072 (9,884) | −0.115 (3,684) | −0.077 (3,208) |
| 4H on 15m · Retest · 2.5× leg · Time | −0.049 (6,279) | −0.126 (2,270) | −0.069 (2,004) |
| 4H on 15m · Retest · 2.5× leg · Fast CISD | −0.072 (6,583) | −0.094 (2,464) | −0.101 (2,183) |
| 4H on 15m · Retest · 2.5× leg · Daily bias | −0.070 (5,450) | −0.137 (2,019) | −0.067 (1,752) |
| 4H on 15m · Retest · 4× leg · no filter | −0.081 (11,488) | −0.134 (4,312) | −0.063 (3,786) |
| 4H on 15m · Retest · 4× leg · Time | −0.064 (7,489) | −0.161 (2,710) | −0.050 (2,428) |
| 4H on 15m · Retest · 4× leg · Fast CISD | −0.087 (8,127) | −0.114 (3,089) | −0.073 (2,744) |
| 4H on 15m · Retest · 4× leg · Daily bias | −0.071 (6,526) | −0.143 (2,431) | −0.073 (2,115) |
| 1H on 5m · Early CISD · C1 target · no filter | −0.207 (66,357) | −0.197 (27,075) | −0.142 (24,024) |
| 1H on 5m · Early CISD · C1 target · Time | −0.202 (48,310) | −0.211 (19,519) | −0.142 (17,333) |
| 1H on 5m · Early CISD · C1 target · Fast CISD | −0.210 (57,999) | −0.197 (24,055) | −0.143 (21,409) |
| 1H on 5m · Early CISD · C1 target · Daily bias | −0.219 (37,374) | −0.209 (15,110) | −0.163 (13,466) |
| 1H on 5m · Early CISD · 2.5× leg · no filter | −0.192 (69,471) | −0.195 (28,385) | −0.158 (24,943) |
| 1H on 5m · Early CISD · 2.5× leg · Time | −0.184 (51,490) | −0.194 (20,840) | −0.155 (18,278) |
| 1H on 5m · Early CISD · 2.5× leg · Fast CISD | −0.194 (61,336) | −0.197 (25,390) | −0.155 (22,419) |
| 1H on 5m · Early CISD · 2.5× leg · Daily bias | −0.202 (40,026) | −0.201 (16,225) | −0.164 (14,320) |
| 1H on 5m · Early CISD · 4× leg · no filter | −0.194 (65,009) | −0.189 (26,533) | −0.145 (23,323) |
| 1H on 5m · Early CISD · 4× leg · Time | −0.188 (49,161) | −0.196 (19,963) | −0.143 (17,506) |
| 1H on 5m · Early CISD · 4× leg · Fast CISD | −0.197 (58,196) | −0.191 (24,029) | −0.146 (21,243) |
| 1H on 5m · Early CISD · 4× leg · Daily bias | −0.198 (40,657) | −0.205 (16,565) | −0.157 (14,573) |
| 1H on 5m · Confirmed · C1 target · no filter | −0.165 (47,880) | −0.181 (18,747) | −0.133 (16,833) |
| 1H on 5m · Confirmed · C1 target · Time | −0.161 (29,285) | −0.178 (11,196) | −0.130 (10,097) |
| 1H on 5m · Confirmed · C1 target · Fast CISD | −0.169 (35,704) | −0.191 (14,306) | −0.136 (12,856) |
| 1H on 5m · Confirmed · C1 target · Daily bias | −0.181 (26,522) | −0.198 (10,475) | −0.158 (9,298) |
| 1H on 5m · Confirmed · 2.5× leg · no filter | −0.150 (49,841) | −0.173 (19,505) | −0.142 (17,271) |
| 1H on 5m · Confirmed · 2.5× leg · Time | −0.145 (32,325) | −0.168 (12,321) | −0.142 (11,074) |
| 1H on 5m · Confirmed · 2.5× leg · Fast CISD | −0.156 (35,646) | −0.183 (14,241) | −0.143 (12,671) |
| 1H on 5m · Confirmed · 2.5× leg · Daily bias | −0.162 (28,414) | −0.183 (11,092) | −0.154 (9,862) |
| 1H on 5m · Confirmed · 4× leg · no filter | −0.148 (58,565) | −0.169 (23,221) | −0.128 (20,679) |
| 1H on 5m · Confirmed · 4× leg · Time | −0.145 (38,938) | −0.164 (15,182) | −0.126 (13,661) |
| 1H on 5m · Confirmed · 4× leg · Fast CISD | −0.153 (44,446) | −0.175 (17,941) | −0.132 (16,085) |
| 1H on 5m · Confirmed · 4× leg · Daily bias | −0.150 (34,428) | −0.183 (13,664) | −0.142 (12,106) |
| 1H on 5m · Retest · C1 target · no filter | −0.175 (33,753) | −0.215 (12,746) | −0.154 (11,582) |
| 1H on 5m · Retest · C1 target · Time | −0.178 (21,015) | −0.210 (7,722) | −0.143 (7,078) |
| 1H on 5m · Retest · C1 target · Fast CISD | −0.181 (23,523) | −0.234 (9,083) | −0.161 (8,305) |
| 1H on 5m · Retest · C1 target · Daily bias | −0.178 (18,657) | −0.218 (7,070) | −0.176 (6,398) |
| 1H on 5m · Retest · 2.5× leg · no filter | −0.154 (38,925) | −0.196 (14,872) | −0.155 (13,286) |
| 1H on 5m · Retest · 2.5× leg · Time | −0.153 (25,817) | −0.187 (9,605) | −0.140 (8,749) |
| 1H on 5m · Retest · 2.5× leg · Fast CISD | −0.161 (26,614) | −0.207 (10,412) | −0.154 (9,326) |
| 1H on 5m · Retest · 2.5× leg · Daily bias | −0.159 (22,125) | −0.197 (8,452) | −0.159 (7,598) |
| 1H on 5m · Retest · 4× leg · no filter | −0.167 (43,330) | −0.205 (16,715) | −0.147 (15,057) |
| 1H on 5m · Retest · 4× leg · Time | −0.170 (29,050) | −0.202 (10,979) | −0.137 (9,993) |
| 1H on 5m · Retest · 4× leg · Fast CISD | −0.178 (30,961) | −0.215 (12,223) | −0.147 (11,094) |
| 1H on 5m · Retest · 4× leg · Daily bias | −0.161 (25,126) | −0.208 (9,746) | −0.155 (8,729) |
| Daily on 1H · Early CISD · C1 target · no filter | −0.032 (4,361) | −0.015 (1,731) | −0.064 (1,572) |
| Daily on 1H · Early CISD · C1 target · Time | −0.038 (2,878) | +0.022 (1,110) | −0.010 (1,053) |
| Daily on 1H · Early CISD · C1 target · Fast CISD | −0.045 (3,776) | −0.033 (1,521) | −0.056 (1,371) |
| Daily on 1H · Early CISD · C1 target · Daily bias | −0.070 (2,375) | +0.036 (854) | −0.090 (840) |
| Daily on 1H · Early CISD · 2.5× leg · no filter | −0.044 (4,477) | −0.035 (1,764) | −0.058 (1,600) |
| Daily on 1H · Early CISD · 2.5× leg · Time | −0.059 (2,901) | −0.006 (1,122) | −0.051 (1,061) |
| Daily on 1H · Early CISD · 2.5× leg · Fast CISD | −0.050 (3,882) | −0.037 (1,544) | −0.045 (1,393) |
| Daily on 1H · Early CISD · 2.5× leg · Daily bias | −0.065 (2,402) | −0.013 (874) | −0.088 (853) |
| Daily on 1H · Early CISD · 4× leg · no filter | −0.020 (4,159) | −0.063 (1,646) | −0.046 (1,490) |
| Daily on 1H · Early CISD · 4× leg · Time | −0.035 (2,829) | −0.043 (1,100) | −0.007 (1,012) |
| Daily on 1H · Early CISD · 4× leg · Fast CISD | −0.023 (3,700) | −0.048 (1,470) | −0.051 (1,328) |
| Daily on 1H · Early CISD · 4× leg · Daily bias | −0.061 (2,438) | −0.037 (896) | −0.093 (855) |
| Daily on 1H · Confirmed · C1 target · no filter | −0.037 (2,228) | −0.087 (845) | +0.008 (752) |
| Daily on 1H · Confirmed · C1 target · Time | −0.039 (1,071) | −0.040 (350) | +0.103 (342) |
| Daily on 1H · Confirmed · C1 target · Fast CISD | −0.056 (1,723) | −0.086 (654) | +0.007 (567) |
| Daily on 1H · Confirmed · C1 target · Daily bias | −0.054 (1,191) | −0.070 (426) | −0.018 (429) |
| Daily on 1H · Confirmed · 2.5× leg · no filter | +0.008 (1,857) | −0.090 (718) | +0.028 (643) |
| Daily on 1H · Confirmed · 2.5× leg · Time | +0.000 (783) | −0.113 (237) | +0.114 (270) |
| Daily on 1H · Confirmed · 2.5× leg · Fast CISD | +0.013 (1,321) | −0.103 (526) | +0.014 (444) |
| Daily on 1H · Confirmed · 2.5× leg · Daily bias | −0.034 (1,011) | −0.059 (393) | +0.014 (395) |
| Daily on 1H · Confirmed · 4× leg · no filter | −0.004 (2,347) | −0.085 (921) | −0.009 (788) |
| Daily on 1H · Confirmed · 4× leg · Time | −0.008 (1,121) | −0.040 (378) | +0.112 (383) |
| Daily on 1H · Confirmed · 4× leg · Fast CISD | −0.004 (1,798) | −0.069 (717) | −0.025 (591) |
| Daily on 1H · Confirmed · 4× leg · Daily bias | −0.030 (1,339) | −0.058 (523) | −0.021 (487) |
| Daily on 1H · Retest · C1 target · no filter | −0.020 (1,589) | −0.106 (597) | −0.014 (543) |
| Daily on 1H · Retest · C1 target · Time | −0.034 (737) | −0.080 (222) | +0.157 (220) |
| Daily on 1H · Retest · C1 target · Fast CISD | −0.053 (1,175) | −0.127 (438) | −0.065 (386) |
| Daily on 1H · Retest · C1 target · Daily bias | −0.050 (830) | −0.063 (292) | −0.097 (314) |
| Daily on 1H · Retest · 2.5× leg · no filter | +0.032 (1,449) | −0.084 (566) | +0.071 (507) |
| Daily on 1H · Retest · 2.5× leg · Time | +0.030 (609) | −0.082 (187) | +0.217 (202) |
| Daily on 1H · Retest · 2.5× leg · Fast CISD | +0.020 (990) | −0.106 (395) | +0.051 (336) |
| Daily on 1H · Retest · 2.5× leg · Daily bias | −0.019 (781) | −0.010 (311) | +0.045 (312) |
| Daily on 1H · Retest · 4× leg · no filter | +0.023 (1,737) | −0.093 (683) | +0.010 (597) |
| Daily on 1H · Retest · 4× leg · Time | +0.005 (797) | −0.011 (270) | +0.186 (269) |
| Daily on 1H · Retest · 4× leg · Fast CISD | +0.010 (1,277) | −0.072 (500) | −0.036 (429) |
| Daily on 1H · Retest · 4× leg · Daily bias | −0.022 (958) | −0.062 (381) | −0.052 (367) |
In 2018–22, 9 of the 108 were above zero after costs, all on daily candles, the best at +0.032R per trade over 1,449 trades. Every intraday version was red. The three we carried forward then lost in 2023–24, positive in one market of seven each, so the main test stopped there: no validated edge.
2025–26 flatters the daily row, 15 of 36 above zero. But 34 of those 36 lost in 2023–24. We saw the same with the Engulfing Volume Desk: a rule that follows what markets happened to do, not an edge that carries across years.
Gold only: the final test
Many of our readers trade gold, so we registered a gold-only track too. One version passed 2023–24 on gold: daily candles, retest entry, 4× target, the extreme in the first half of C2 (46 trades, +0.104R per trade). We ran it once on January 2025 to September 2026.
| Costs | Trades | Above zero | Net | R per trade | Profit factor | Deepest fall |
|---|---|---|---|---|---|---|
| Base | 50 | 19 (38%) | −1.09R | −0.022 | 0.96 | 8.8R |
| Stressed, 1.5× | 50 | 19 (38%) | −1.37R | −0.027 | 0.95 | 8.9R |
Random entries with the same stops and targets did better in 58% of 2,000 shuffles. Fail.
What the costs did
Before costs the model is a coin flip. After costs it only goes down, and the shorter the timeframe the faster.
Table: cumulative R at each year end
| Through | Before costs | After costs |
|---|---|---|
| Dec 2018 | +59.9R | −1,553R |
| Dec 2019 | +169R | −3,319R |
| Dec 2020 | +49.1R | −4,924R |
| Dec 2021 | +36.1R | −6,558R |
| Dec 2022 | −15.7R | −7,914R |
| Dec 2023 | −83.4R | −9,492R |
| Dec 2024 | −332R | −11,313R |
| Dec 2025 | −436R | −12,721R |
| Sep 2026 | −318R | −13,546R |
The 5-minute textbook version averaged −0.004R per trade before costs over 83,460 trades. Costs then took about 0.17R from every trade, because a 5-minute stop is small next to a normal spread. It lost in every year from 2018 to 2026.
Against random entries with the same stops, targets and holding time, it was better by under 0.01R per trade (p = 0.01). Real, perhaps, and about twenty times smaller than its cost. The 4-hour and daily versions could not be told apart from random entries at all.
Check it on your own chart
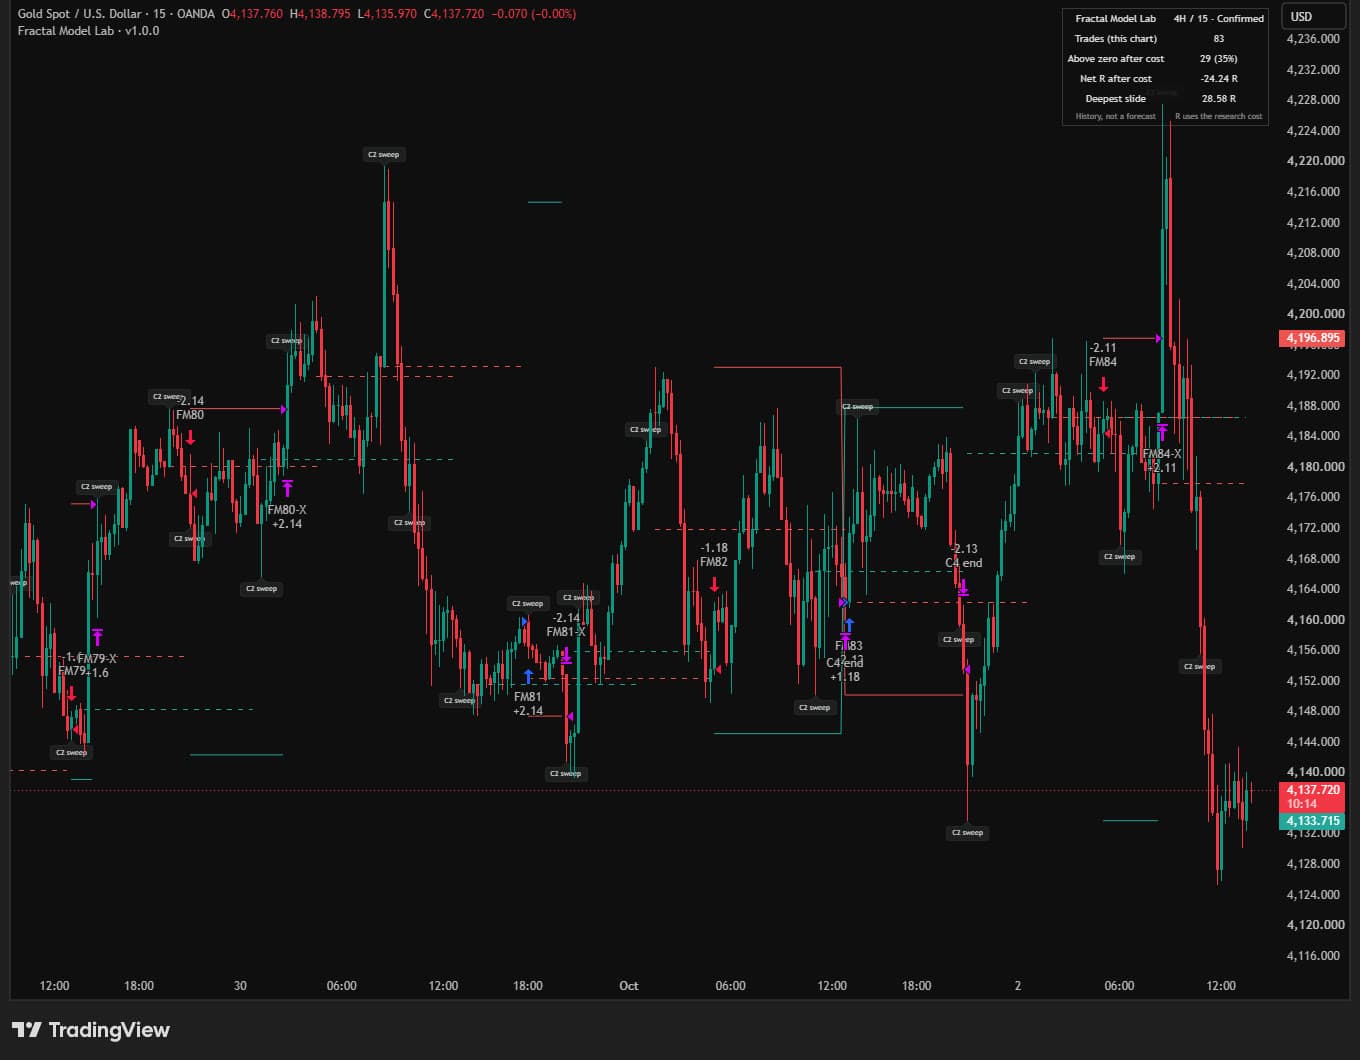
Fractal Model Lab is a free TradingView strategy (Pine v6, MIT) with the same 108 settings. Here it is on the 15-minute gold chart, defaults on, with the study's cost in Properties.
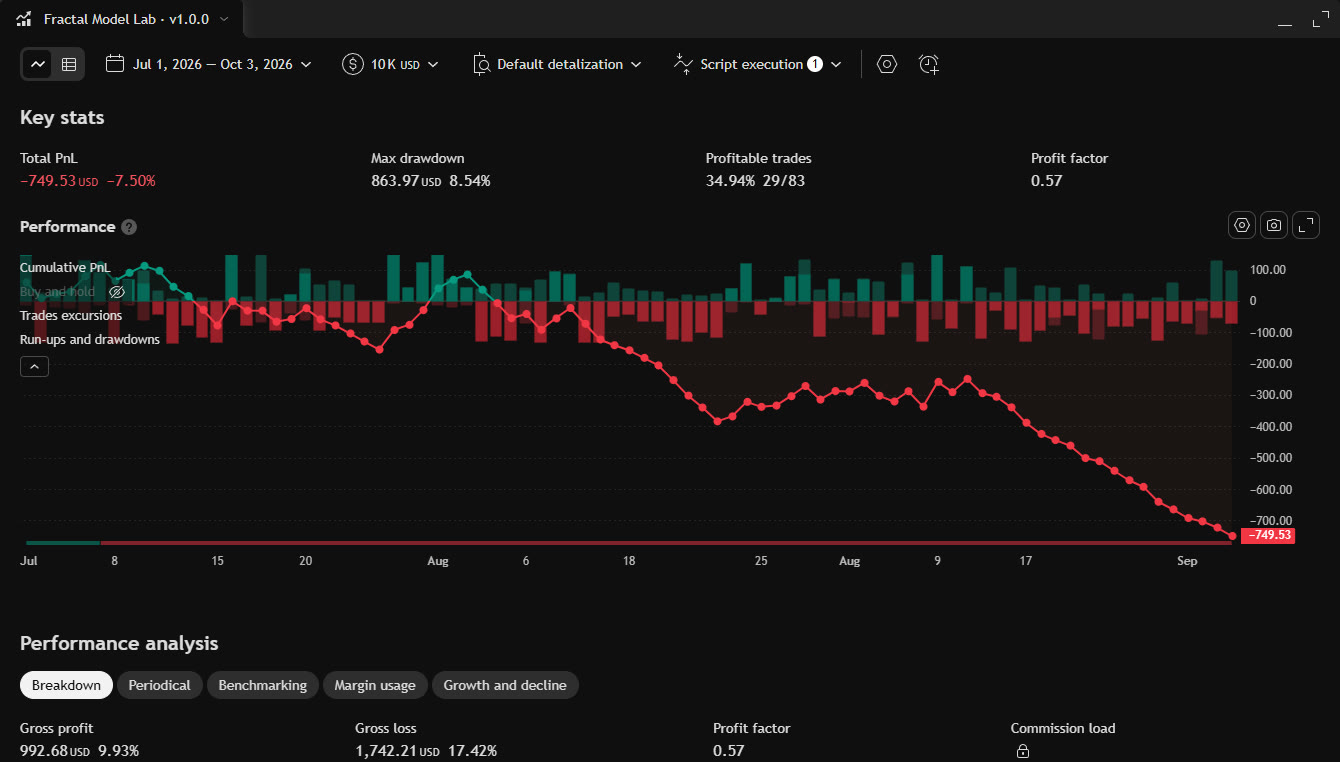
We checked the Lab against our research engine trade by trade on that chart, eight settings on the 15- and 5-minute timeframes: TradingView took 737 trades, and 736 matched the engine's entry time and price, 730 its exit too. The rest are candles where TradingView guesses whether the stop or the target came first, a Labor Day session that closed early, and one same-candle re-entry TradingView did not take.
Two of our own mistakes
That trade-by-trade check caught two errors in our research. Neither changes the verdict, and both are written into the study's amendments next to the plan as it was registered.
- When the 4-hour candles start. We assumed TradingView starts gold's and the indices' 4-hour candles at 18:00 New York. It starts them at 17:00. Re-run that way, the 36 4-hour versions are still 0 of 36 above zero in every period.
- A gap through the stop. On a Sunday open that jumped through both a retest order and its stop, our engine exited at the stop price, a small gain that could not happen. Fixed, 1,502 retest trades moved by at most 0.006R per trade per version, and the gold final test went from −1.09R to −1.14R.
What you can take from it
- The mechanical skeleton carried no edge in 8¾ years of seven markets. That is not a verdict on TTrades, or on a trader who adds the parts that cannot be written down.
- Lower timeframes make it worse. On the 1-hour/5-minute pairing, costs are a large share of every stop. Check yours.
- It is still a clear way to read a chart: which candle swept which, where the run began, whether the close came back. That is what the free desk shows, with no buy or sell signal attached.
We are now following three daily versions forward, on data that did not exist when we registered them (fills from 5 October 2026). Monthly numbers will land here, with no verdict until October 2027.
Limits
One data vendor per market (bid prices; costs stand in for the spread), a fixed cost per market across eight years, no overnight financing, the stop counted first when a candle touches both levels, and our own reading of public TTrades material. Three periods are three samples of history, not a forecast. Nothing here is advice to trade, or not to trade, this model.
Source: ProEA Lab Fractal Model study, protocol fingerprint ad2e6616…0587, engine 33db1554…7c02 (v1 as registered) and 46db28e5…5d66ef (v1.1, amendment A2), registered 2026-10-02 before the first run.