
You did the responsible thing — at least it felt responsible.
Instead of dumping everything into one trade, you spread it around: long EURUSD, long GBPUSD, long AUDUSD, a little gold, a small index position.
Five tickets, 1% risk each.
Clean, disciplined, diversified.
You sleep well.
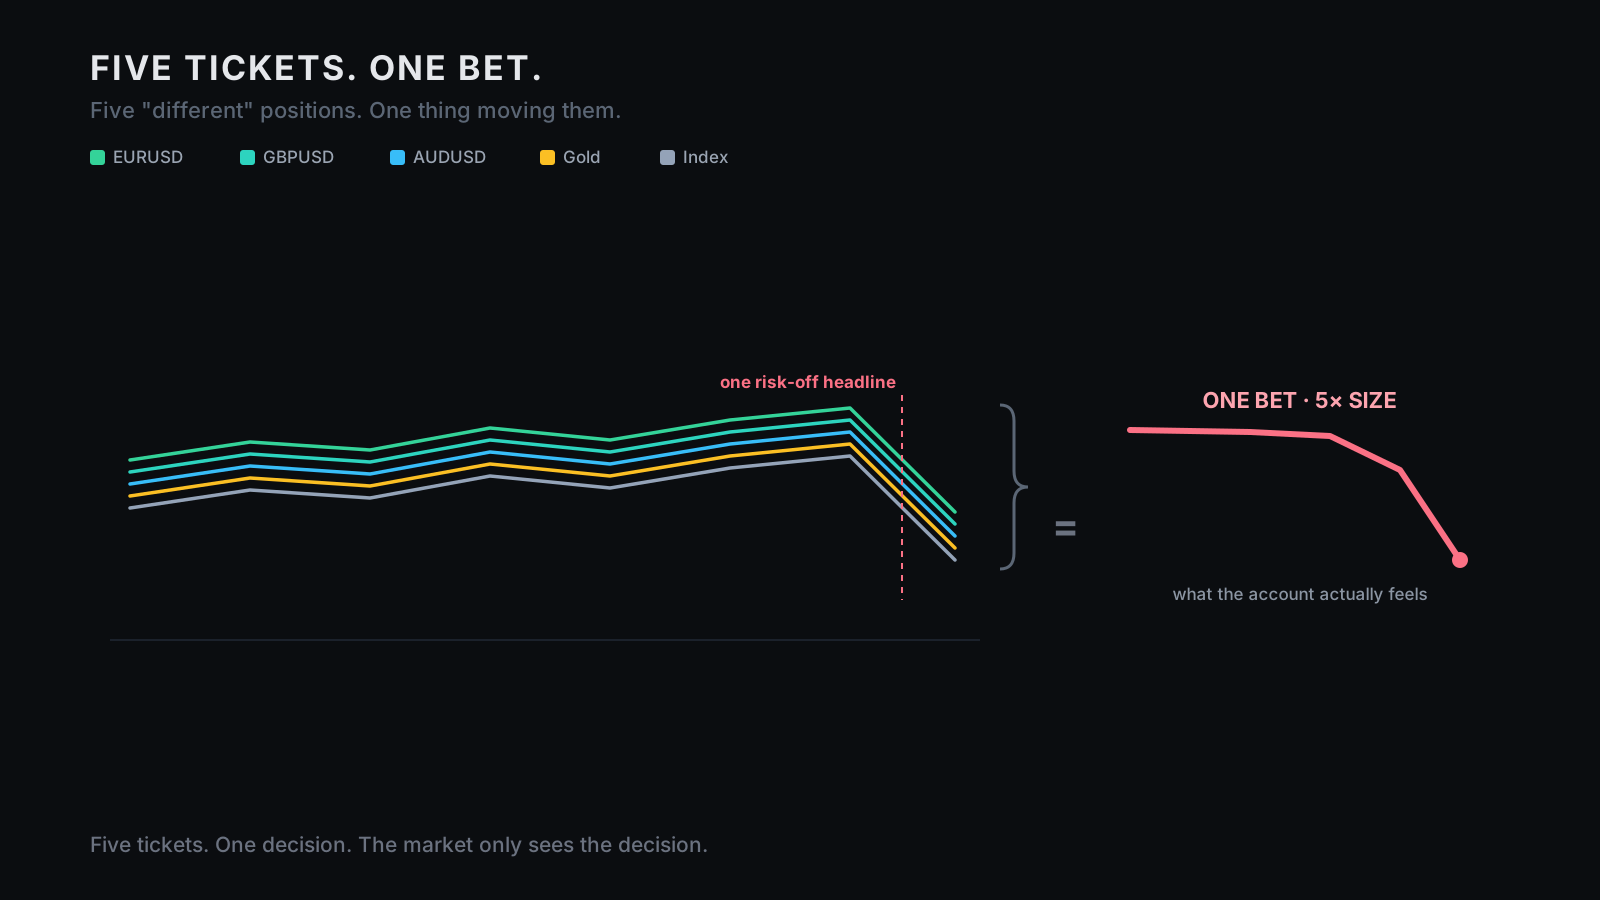
Then a headline hits at 3 a.m. Risk-off. The dollar bids, liquidity thins, and you wake up to five red tickets — all losing, all at once, all for the same reason. You did not lose 1% five separate times. You lost 5% one time, because you never had five trades. You had one trade, five times.
This is one of the quietest account-killers in trading, because it hides behind a word everyone trusts: diversification. More tickets feel like less risk; often they are just the same risk, photocopied. EURUSD, GBPUSD, AUDUSD, gold against the dollar, a risk-on index — on a calm day they look like different charts. On a bad day they are five spellings of the same sentence: short the dollar, long risk. That is not a portfolio. That is one oversized macro bet wearing five tickets.
Diversification is the only free lunch in investing — right up until the bill arrives all at once.
The good news is that you can see this before the market shows you the hard way. It takes about twenty minutes — no new platform, no quant degree, no whispering "covariance matrix" into a candlelit terminal. Just list your positions, name the driver behind each, and count the bets, not the tickets.
Save this before you open your next "hedge." And send it to the friend whose "diversified" book is four majors, gold, and an index — they may not be diversified; they may just be creative at being wrong once.
effective number of bets — the desk-grade way to count independent risk sources, not line items.
Meucci, Managing Diversification ↗where broad stock-return correlations reached after the 2008 Lehman shock and again in the 2020 crash — diversification compressing when it mattered most.
Bundesbank discussion paper (2023) ↗what a multi-ticket book can collapse into when every position shares the same driver.
Effective-bets framework ↗The 60-second version
Risk does not add up by counting positions; it adds up by counting independent bets. Two positions that always move together are not two trades — they are one trade at double size. Five positions driven by the same macro force are not diversification; they are leverage with better stationery.
Most retail traders count tickets — "I have five positions." Desks count drivers — how many different things am I actually betting on? That second question is the one that matters, because the market does not care how many symbols you opened. It cares how many different ways you can be wrong. If all your positions lose on the same headline, the answer is one.
| What you think you have | What you actually might have |
|---|---|
| Five positions, 1% each | One macro bet near 5% |
| A diversified book | The same driver, five times |
| A hedge | A second bet that drifts and costs |
| Independent trades | One decision priced through many symbols |
| Lower risk | Hidden leverage |
I — More tickets is not less risk
Diversification only works when the bets are independent — when one losing tells you little about another losing. Flip five unrelated coins and a bad result on one tells you nothing about the others; that is real spreading of risk. Trading positions are rarely like that. They are tied together by shared drivers — the dollar, rates, risk appetite, liquidity, commodity beta, equity sentiment, central-bank expectations. When the driver moves, everything tied to it moves: sometimes slowly, sometimes violently, sometimes at 3 a.m. while your stop-losses line up like ducks at a shooting range.
So the question is never how many positions do I have open? It is how many different things am I actually betting on? Five tickets on the same idea is not a portfolio. It is leverage with extra commissions. The account does not experience your positions as separate just because the terminal listed them on separate lines — it experiences the combined P&L. If those lines rise and fall together, they are one thing.
II — Correlation is hidden leverage
Correlation describes linear co-movement: +1 and −1 are perfect positive and negative linear relationships; zero correlation does not by itself establish independence. Keep two different risk questions separate.
Return volatility: if each position's P/L contribution has a standard deviation of 1% of the same account baseline over the same period, the standard deviation of their sum is √(1² + 1² + 2ρ × 1 × 1)%. At zero covariance that is about 1.41%; at correlation +1 it is 2%. This is a statistical dispersion measure under those assumptions, not a stop-loss budget, maximum loss or probability that both trades lose.
Cash loss at the entered stops: if each position has a planned stop loss of $100, both stops executing under the stated assumptions means $200 before omitted costs, even if past returns were uncorrelated. Three such positions total $300. Use the open-position risk calculator to sum a single-currency stop scenario and entered cost allowances. It applies no correlation discount and does not estimate execution probabilities, floating equity or margin. Gaps and worse fills can exceed the estimate.
Scale that up and the trap appears. Three correlated 1% trades are one 3% decision; five are one 5% decision — the size you would refuse if it showed up as a single order ticket, but accept when it wears five symbols. Correlation does not show up in MT5 beside your lot size. It does not ask permission. It just sizes your account in the background. You thought you were placing trades; correlation was building the real position.
III — The number that matters
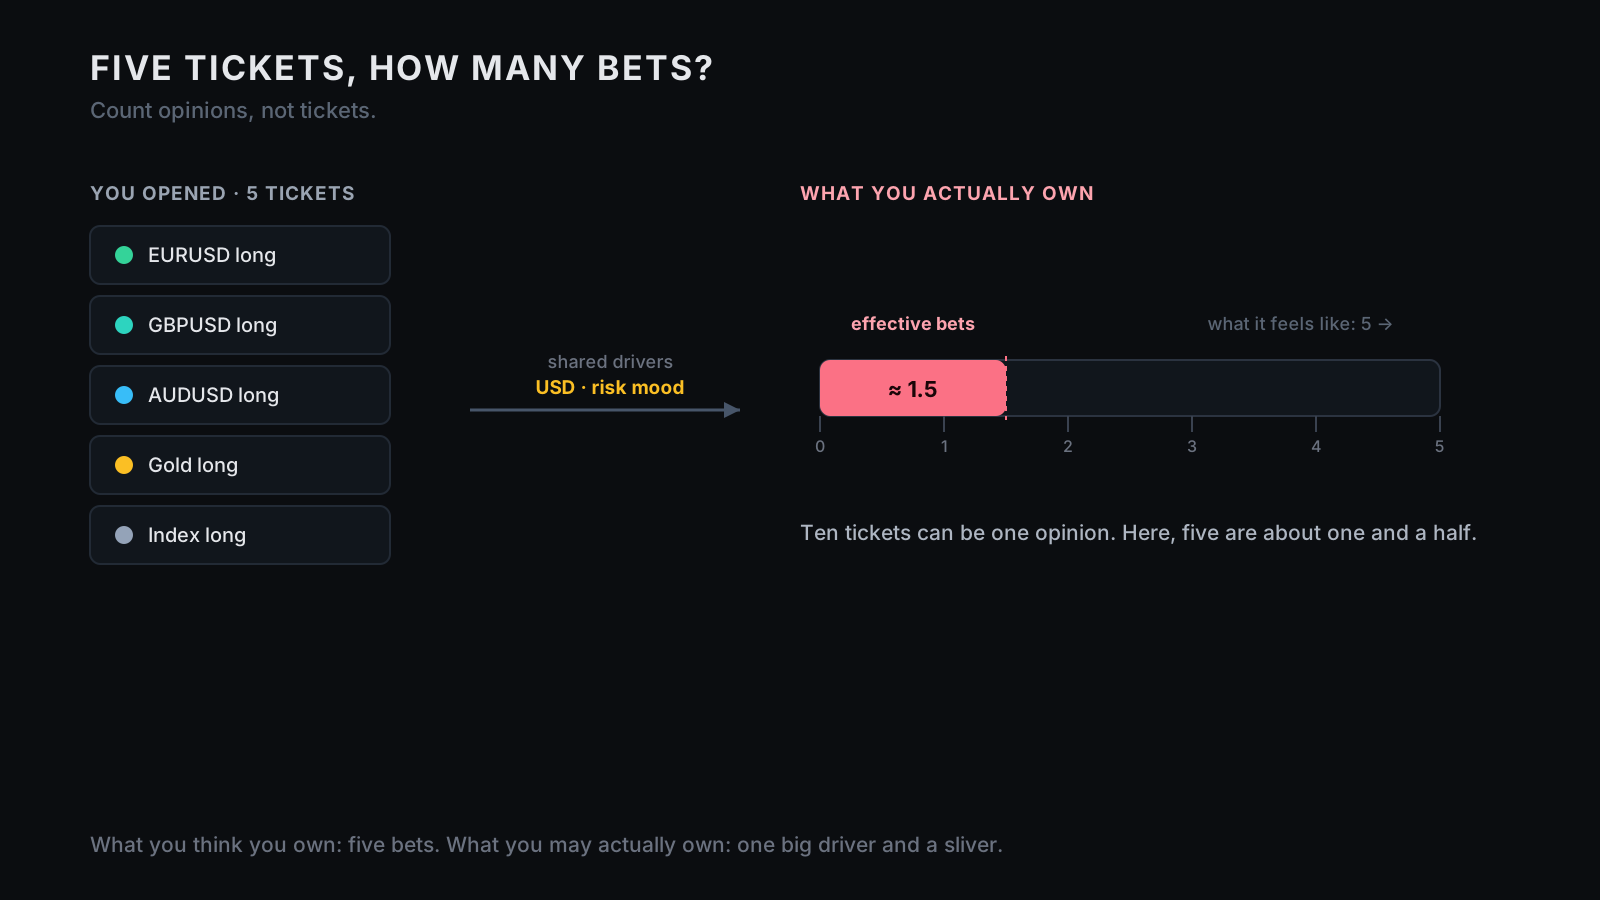
Professional desks do not only count holdings; they count independent sources of risk. One clean lens is the effective number of bets: a portfolio with ten holdings can still behave like one bet, and a portfolio with five holdings can contain five real bets — the difference is not the count, it's the drivers. The formal version (Meucci) decomposes a portfolio into uncorrelated risk sources and measures how evenly risk is spread across them. The practical version is easier — group by what moves the trade, not by the symbol:
| Position | What you're really betting |
|---|---|
| EURUSD long | short USD · long Europe |
| GBPUSD long | short USD · long UK |
| AUDUSD long | short USD · long risk |
| Gold long | short real yields · short USD |
| Index long | long risk appetite |
How many bets is that? Not five. Maybe two. Maybe one and a half. In a bad hour, maybe one. That is the desk-grade trick made retail-simple: count opinions, not tickets — because that is what the market reprices. You can own ten tickets and one opinion, and one opinion can be very expensive when it is wrong.
IV — In a crisis, correlation runs toward one
Here is the cruel part: correlation is not stable, and it moves in the worst possible direction. In calm markets, assets drift apart and your book looks nicely diversified — the spreadsheet smiles. Then stress arrives: liquidity disappears, funds deleverage, cash becomes king, and assets that looked different start moving together. The correlations you were counting on compress, the hedge weakens, and the book becomes one giant trade exactly when you needed it not to.
That is why calm-market correlation is dangerous: it is usually the best version of the relationship, not the worst. In a crisis the market stops asking what symbol is this? and starts asking is this risk, is this dollar-sensitive, can I sell it? That is when diversification gets stress-tested — and often fails. Calm-market correlation is the brochure. The bad hour is the contract.
How many of your open trades would survive the same bad hour?
If the honest answer is "almost none," you do not have a diversified book. You have a comforting layout.
V — The dollar trap
For forex and metals traders, this is structural. Almost every major pair has the US dollar on one side, so a book of long EURUSD, long GBPUSD, long AUDUSD, short USDJPY, and long gold can look like five trades while being one big short-dollar expression. When the dollar catches a bid, all of them can hurt at once — not because the strategy broke, but because the book had one driver.
The same goes for risk assets: long NASDAQ, long AUDUSD, long crypto, long emerging markets, long high-beta stocks are different symbols and one mood — long risk — and when risk appetite falls they do not take turns losing, they go together. The retail screen is dangerous precisely because it organizes by symbol while the account bleeds by driver. MT5 shows you tickets. The market sees factors. That mismatch is where hidden exposure lives.
VI — Negative correlation is not a hedge you can forget
The obvious answer is "I'll hedge with something negatively correlated." Good — sometimes. But negative correlation is a relationship, and relationships change. A hedge that was −0.6 last quarter might be −0.2 this month; one that worked in a low-inflation regime might fail in an inflation shock; a bond hedge that used to cushion stocks can stop cushioning when both are being hit by the same rates problem. Hedges also cost — spread, swap, drag, opportunity cost, complexity.
A hedge you measure is risk management. A hedge you assume is decoration.
If you cannot state what would make the hedge fail, it is not a hedge yet — it is a hope with a negative correlation coefficient attached.
VII — How desks size a correlated book
You do not need a risk department to borrow the discipline. Three rules do most of the work.
1. Size the cluster, not the ticket. Set risk per driver, not only per position — a budget every ticket in that theme shares:
Max short-dollar exposure:   2%
Max long-risk exposure:      2%
Max gold-specific exposure:  1%
If you already have three short-dollar trades open, the fourth does not get a fresh 1% — it borrows from the same cluster. This one rule prevents most accidental 5× bets.
2. Count real bets before adding one. Before opening a trade, ask which existing driver it joins. If the answer is "it's another short-dollar trade," that is not diversification — it is more size. That might be fine, but call it what it is; do not lie to yourself with a new symbol.
3. Size for the bad hour. Do not size from calm correlation — that is the brochure. Assume relationships tighten when volatility rises, and ask: if these all moved against me in the same session, would the damage still fit my plan?
This is one layer of a stack, and the layers connect:
- Position sizing controls the size of one trade.
- Monte Carlo shows the bad-but-normal drawdown.
- Kill-switches define when to stop.
- Correlation auditing shows the real size of the whole book.
You need all four. Otherwise you can be disciplined on every individual ticket and reckless in the combined book — a very common way to look professional right up until the account gets punched.
The AI exposure prompt
Let AI do the arithmetic, not the decision. It can pull the recent returns of your open symbols, build the correlation matrix, and estimate how many independent bets you are really carrying — as long as you read the answer and act on it.
Here are my open positions. For each I give: symbol, direction, size,
stop-loss, % account risk if stopped, and ~60–120 days of daily returns.

Please:
1. Build a correlation matrix for the symbols.
2. Adjust for direction (long EURUSD and short EURUSD are opposite).
3. First sum the planned cash loss at all entered stops plus separately
   stated costs. Do not discount this cash scenario for correlation.
   Separately, if the return data and position weights support it,
   estimate P/L standard deviation at observed and stress correlations.
   State the unit, period, covariance assumptions and missing inputs.
4. Cluster positions by driver: USD, rates, risk-on/off, commodity,
   equity beta, crypto beta, idiosyncratic.
5. Estimate my effective number of bets.
6. Show planned cash loss per driver and flag any above my written limit.
   If a position belongs to multiple drivers, do not double-count it
   in the account total. Do not present either estimate as maximum loss.
7. Do not suggest new trades. Do not optimize. Just show my real exposure.
The last line matters most. You are not asking AI to be a hedge-fund manager; you are asking it to hold up a mirror. Sometimes the mirror is rude. Good — rude mirrors save money.
The 20-minute exposure audit
Run this on your open book right now. It stings in the best way.
Minutes 0–5 — List the drivers. Write every open position, then beside each write what actually moves it — not the symbol, the driver (the same grouping as the table above: EURUSD/GBPUSD/AUDUSD → short USD, gold → short real yields and USD, index → long risk). Already the book looks less diversified. Good — that is the point.
Minutes 5–10 — Group and count. Cluster the positions by driver — USD, risk-on, rates, commodity, idiosyncratic — and count the clusters, not the tickets. That number is your first honest estimate of real diversification.
Minutes 10–15 — Sum the risk per driver. Add the risk of every position in each cluster. If EURUSD, GBPUSD, AUDUSD and gold each risk 1%, your short-dollar cluster is about 4% — and that number matters more than any single ticket. If you would not knowingly risk 4% on one dollar view, you are oversized. Full stop.
Minutes 15–20 — Stress the bad hour. For each cluster, ask: if this driver moved hard against me in one session, what is the total damage? Compare it to your written risk limits; if it breaks them, cut the cluster — not because you know the headline is coming, but because you know it only takes one.
Where this meets ProEA
A single trade's risk is easy to see. A book's risk is where accounts actually die, and it is invisible on any one ticket. This is why inspectability matters: a system that opens multiple positions has to answer for its combined exposure, and those are questions you can only check in the logic, not on an equity curve —
- Does it cap one-direction risk?
- Does it limit same-driver stacking?
- Does it understand when five entries are one opinion?
- Does it halt when the book becomes too one-sided?
MTR is built around source and evidence because this layer should be visible, not promised — you can read whether the system quietly stacks correlated exposure or caps it, and what stops the machine when one direction gets too crowded. That does not make any system safe: a correlation spike can still hurt, a bad hour can still hit, and MTR can lose. But there is a difference between losing from a risk you chose and losing from a risk you did not know you had. Inspectability does not stop the bad hour; it lets you see your real bet before the market shows it to you. The question we'd ask any system, ask ours: when several trades are open, how big is the real bet? (Position size sets the size of one trade; this is the size of all of them at once.)
Disclosure
We sell source and evidence you can inspect — not outcomes, not guarantees. Correlation estimates are backward-looking and unstable; the effective number of bets is a lens, not a law. Diversification reduces some risks and not others, and it can fail in a crisis — assets that look diversified in calm markets can move together in stress, and hedges can drift, decay, cost money, or fail. Trading is risky and leverage magnifies risk; past performance is not future performance. The point is not to promise safety. It is to stop you carrying a 5% bet while believing it is five 1% ones.
Your first 20 minutes
Open your platform. List your positions. Beside each, write the one thing that really moves it. Group the drivers, count the groups, and sum the risk inside the biggest one. If that number scares you more than any single ticket did, the audit worked — you found the bet you did not know you'd made, while you still have time to size it down.
The one line to take with you
Stop counting tickets. Start counting bets. The market does not care how many positions you opened — only how many different things you are actually wrong about.