She built a system that worked — not "worked" in the fake-screenshot way, actually worked.
Two years of backtests, clean rules, no magic-arrow nonsense, a 12% maximum drawdown, a strategy she could explain without sounding like she was selling a Telegram group to a sleep-deprived gambler.
Then she went live. Four months later, she was down 20%. So she did what almost everyone does at the worst possible moment: she turned it off — not because the system was broken, but because her backtest had never shown her a 20% drawdown. The worst she'd ever seen was 12%, so 20% felt like proof: the edge had died, the market had changed, the system was overfit, time to "protect capital." Beautiful words, terrible timing. A few weeks later the system recovered without her. That's the cruelest way to lose money: not because your system failed, but because you quit one that was behaving completely normally.
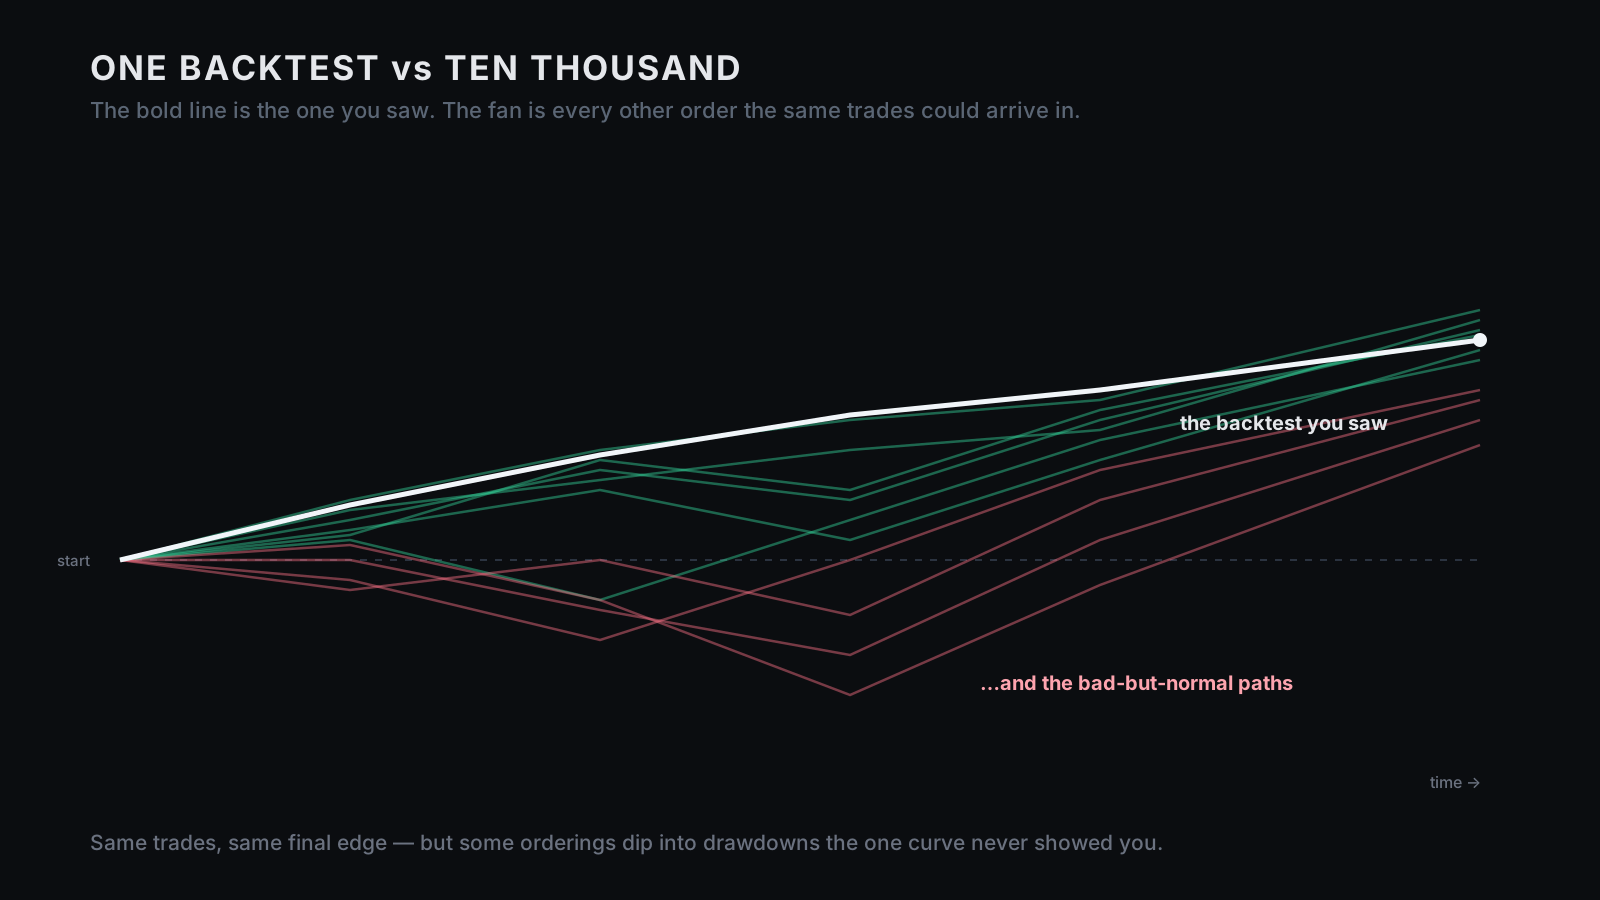
Here's what nobody had taught her. Her backtest was one hand of cards. Same wins, same losses, same edge, same trade list — but if those trades had arrived in a slightly different order, the drawdown could have been 18%, 22%, 25%, maybe worse. The system didn't break at −20%. The single backtest just never introduced her to that version of the future.
Top quants don't trust one equity curve. They don't look at one pretty line and say "nice, ship it." They deal the cards again — thousands of times — reshuffling the same trades, rebuilding the curve, measuring the drawdown, and asking the only question that matters before real money is involved: what does the bad-but-normal future look like? That's Monte Carlo simulation. It sounds like something you need a PhD and an expensive haircut to use. You don't — you can run it on your own trades this afternoon.
Two requests before we start:
- Save this and run the 5-minute version on your own trade history before you trust another backtest drawdown.
- Send it to the trader who just quit a strategy because "it stopped working." It might not have — they may have just met a drawdown their backtest never showed them.
a common safety heuristic: assume your live drawdown can be materially worse than the backtest's.
drawdown safety bufferhow much deeper a reshuffled drawdown ran than the original backtest, in a published example.
BuildAlpha ↗the percentile drawdown professionals size against — the bad-but-normal future, not the lucky path.
Monte Carlo sizing ↗The one-sentence version
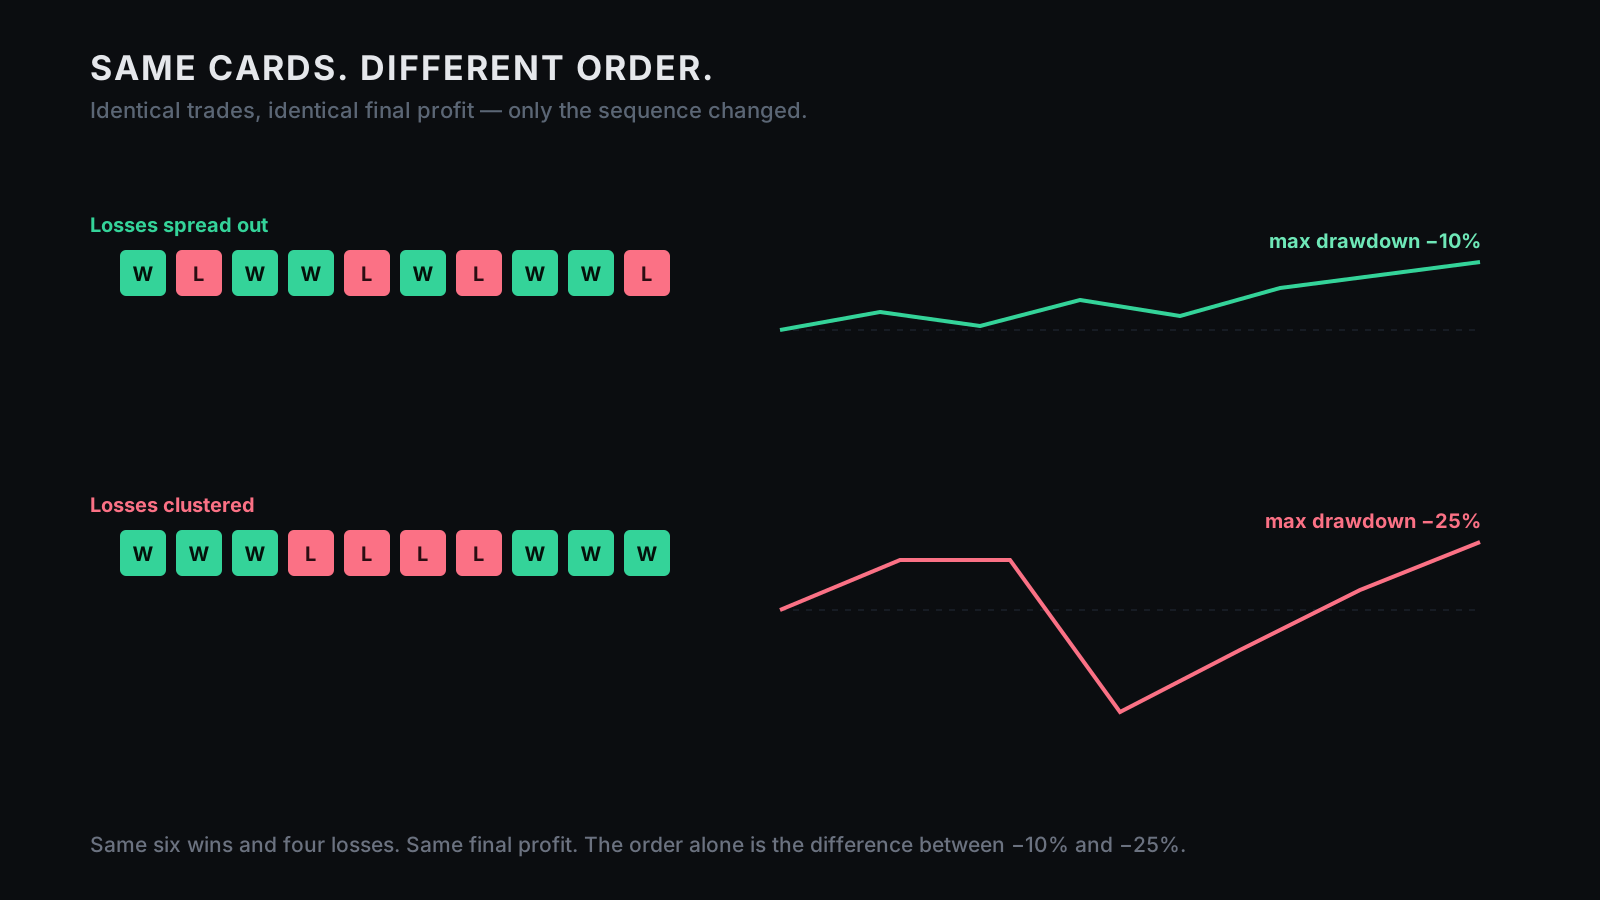
A backtest shows you one possible sequence of your trades — not the truth, not the future, one sequence. If the losses were spread out, the curve looks calm; if the same losses arrive in a cluster, the same strategy suddenly looks broken. Same edge, same trades, different order, different emotional damage.
That's why a single backtest is dangerous: it doesn't show you the full risk of the system, it shows you one historical path through that risk. Monte Carlo fixes this by reshuffling the trades thousands of times, measuring the drawdowns across those alternate paths, and showing you the one you should actually plan for. The backtest says "this is what happened." Monte Carlo asks "what could normally have happened?" — and that second question is where real risk management begins.
I — Your backtest is one hand of cards
Imagine your strategy as a deck of cards: some winners, some losers. A backtest deals that deck once, in the order history happened to give you. Maybe the losers are nicely spread — win, win, loss, win, loss, win — so the curve is smooth, the drawdown small, and confidence activates. Now deal the exact same deck again: same number of winners and losers, same average trade, same final expectancy — but this time five losers land back-to-back. The final profit can be nearly identical. The maximum drawdown can be completely different.
That's path dependency. Most traders judge a strategy by the final number; pros care about the worst moment on the way there, because the worst moment is where humans quit. The return is what sells the backtest. The drawdown is what decides whether you survive it — and drawdown isn't only about the strategy, it's about the order the pain arrives in, which is exactly what a single backtest hides.
This is different from the usual warning. We've written about how a backtest isn't reality because it hides costs and rewards overfitting — that's the curve lying about the numbers. This is sneakier: even a perfectly honest curve, with real costs and no overfitting, is still just one hand. The lie isn't in the numbers. It's in believing the one path is the path.
II — The drawdown you saw may be the lucky one
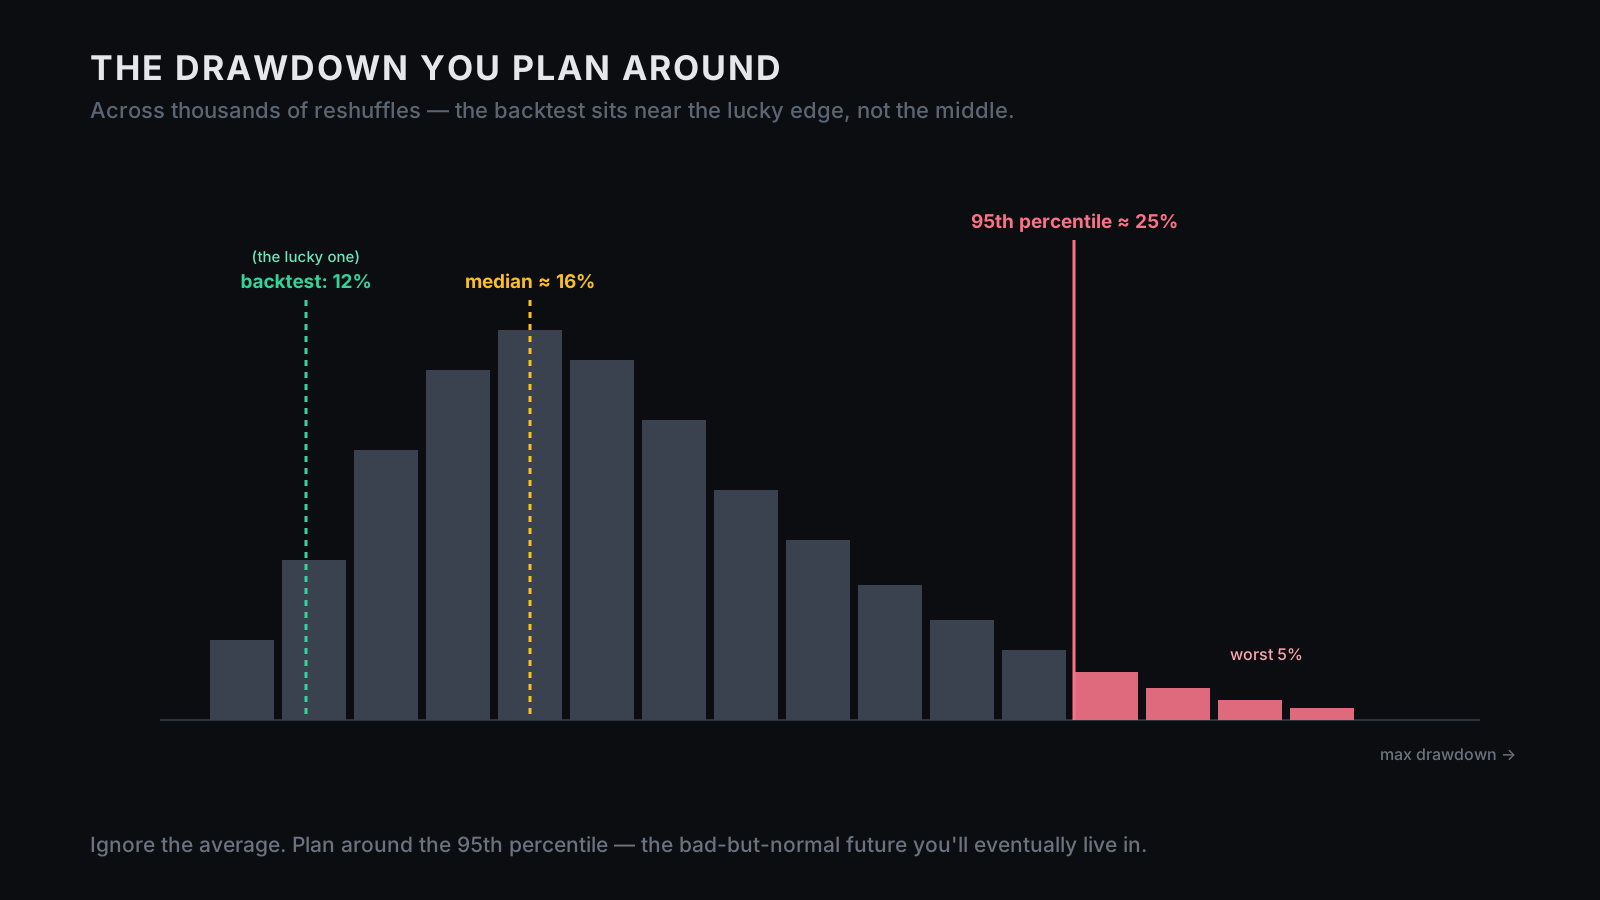
Here's the uncomfortable truth: your backtest's maximum drawdown is not "the maximum drawdown." It's the maximum drawdown of one path — one ordering, one hand. It might be realistic, it might be too pessimistic, but very often — especially in systems where losses can cluster — it's too optimistic, because a single smooth-looking run is by definition one where the losses didn't pile up too badly.
So you saw 12% and decided this is a "12% drawdown system." Then live trading gives you 18%, and something feels wrong. Then 22%, and your brain starts inventing reasons to quit: regime changed, broker's different, edge degraded, better pause and re-optimize. Maybe. Or maybe your backtest simply never showed you the other normal paths.
This is where Monte Carlo gets brutal in the best way. You take the same trades, reshuffle them, and build thousands of alternate curves — then you stop asking "what was the max drawdown in the backtest?" and start asking "what drawdown appears in the worst 5% of normal futures?" That number is usually the one you should have planned for. Not because it will definitely happen, but because if you trade long enough you'll eventually meet an ugly sequence — and if you've never seen it before, you'll mistake normal pain for system failure. We eventually ran this exact exercise against our own published backtest — 10,000 resampled years of one system, script included — and the width still surprised us.
III — Why good traders quit at the bottom
This isn't a math problem first. It's a surprise problem. Most traders don't quit because they're weak; they quit because the drawdown is bigger than the story they were told. If your backtest showed −12%, then −12% feels normal — but at −15% your confidence starts sweating, at −18% you reread the rules, at −20% you open the settings, and at −22% you convince yourself that switching the system off is "risk management." Sometimes it is. Often it's panic wearing a suit.
The system may be doing exactly what it was always capable of doing; you just never simulated that version. (It's the same trap behind quitting a strategy too early, seen through drawdown instead of sample size.) That's why Monte Carlo isn't optional for serious system trading: it doesn't make drawdown disappear, it makes it less surprising — and a drawdown you expected ("this hurts, but it's inside the plan") leads to a completely different decision than one that ambushes you ("this is broken, shut it down"). Same chart, different preparation, different decision. That's the edge Monte Carlo gives you — not a better entry, a better nervous system.
IV — Monte Carlo, explained like you're busy
Monte Carlo sounds complicated because quants are very good at making simple things sound like they need a Bloomberg terminal and a monk robe. The basic version is easy: take your list of trades —
+1.2R -1.0R +0.8R -1.0R +2.1R -1.0R +1.5R
— reshuffle the order, build the equity curve, record the maximum drawdown, and do it again. And again. A thousand times, five thousand times, ten thousand if your computer is bored. At the end you don't have one equity curve; you have a cloud of them — best cases, normal cases, bad cases, ugly-but-possible cases. A distribution.
That's the whole idea. A backtest gives you a story. Monte Carlo gives you a map of possible stories. And the most important output isn't the prettiest curve — it's the drawdown distribution: the median max drawdown, the 95th-percentile max drawdown, the worst, the risk of ruin, the longest losing streak, the probability of ending below where you started. Those are the numbers that tell you whether you can actually trade the system, not just admire it.
V — The pro move: size from the 95th percentile
This is the part that connects directly with sizing. The previous piece answered "how much should I risk per trade?" This one answers "how do I know that number is actually safe?" — and the answer isn't "use 1% because the internet says so." It's: run Monte Carlo at your chosen risk level, then look at the 95th-percentile maximum drawdown. That's your bad-but-normal drawdown — not the apocalypse, not the single worst nightmare, but the one that shows up in the worst 5% of simulated futures. That's the number you size around.
Say you test at 1% risk and the original backtest max drawdown is 12% — looks fine. Then Monte Carlo says:
Median max drawdown:           15%
95th-percentile max drawdown:  27%
Worst simulated drawdown:      38%
Now the conversation changes. If you can genuinely tolerate 30%, 1% may be acceptable. If you know you'll panic at 20%, 1% is too big — so you cut to 0.5%, rerun, and maybe the 95th-percentile drops to 14%. That's a system you can actually follow. The best risk percentage isn't the one that makes the backtest look exciting; it's the one that keeps the 95th-percentile drawdown inside the pain you can truly survive. Don't size for the curve you saw. Size for the path you don't want — because that's the path that decides whether you're a system trader or a curve admirer.
VI — How to run it today
You don't need to code from scratch. You have three routes.
Option 1 · Use a free Monte Carlo tool. Export your trade results from MT4, MT5, TradingView, cTrader, or your journal, paste them into a Monte Carlo simulator, run thousands of randomized sequences, and read the 95th-percentile max drawdown. Not glamorous; very useful.
Option 2 · Spreadsheet shuffle. Put your trade results in a column, add a random-number column, sort by it, rebuild the equity curve, record the max drawdown, repeat. It's clunky, but the first time you watch the same trades produce a much deeper drawdown purely because the order changed, something clicks — and that click is this whole article doing its job.
Option 3 · Let AI build it. This is the one that fits the series — have AI build the tool so you own it and can point it at every system you ever test:
Build me a Monte Carlo simulator for my trading strategy.

Input:
- a list of trade results in R-multiple or % return
- starting balance, risk per trade, number of simulations

For each simulation: shuffle the trade order, build the equity
curve, and record max drawdown, final balance, longest losing
streak, and whether it ended below starting balance.

Run 5,000 simulations. Output:
- original backtest max drawdown
- median, 95th-percentile, and worst simulated max drawdown
- probability of ending below starting balance
- the risk % that keeps my 95th-percentile drawdown under my tolerance

Plot the equity-curve fan and the drawdown histogram.
That's AI used correctly — not to predict the market, not to hallucinate a buy signal, not to become a financial astrologer with better grammar (the same build-it-yourself workflow, pointed at validation). Use AI to build the boring tool that stops you trusting one lucky path. The calculator doesn't need to be sexy. It needs to keep you from quitting at the bottom.
VII — Three top-quant tricks you can steal
Once you're reshuffling trades, three professional habits come almost for free — no math cosplay required.
1 · Use the reshuffle as an edge test. Monte Carlo isn't only a drawdown test, it's an edge sanity check. If most reshuffled paths still end profitably, the edge may be real; if the original backtest looks great but a big share of reshuffled paths end ugly, the system leans more on lucky sequencing than you thought. That doesn't automatically kill it — but it tells you to slow down. A robust edge shouldn't need one perfect historical order to survive; if it only works in one special sequence, that's not a system, it's a magic trick — and magic tricks get expensive once live spreads are involved.
2 · Write the drawdown down before you trade. This sounds too simple, which is why almost nobody does it. Before going live, write it out:
This system can normally draw down ___% (95th-percentile Monte Carlo).
If drawdown stays inside this range, I do NOT shut it off just because
it hurts. I stop only if it breaks a predefined failure rule.
When drawdown arrives, your live brain isn't the brain that approved the backtest. Backtest brain is calm and says "I can handle 30%." Live brain at −15% is sweaty and dramatic and hunting for the exit. Write the number down before the pain starts, so your future panic can't rewrite the plan.
3 · Add a safety buffer. Monte Carlo is better than one backtest, but it isn't God — it only reshuffles the trades you already have, and the real future can contain something your sample never saw: a new volatility regime, worse spread, slippage, a news shock, a correlation spike. So don't size right to the edge of the 95th-percentile number; leave room. If your real tolerance is 30%, don't build a system whose 95th percentile is 29.8% — that's not risk management, that's accounting cosplay. The simulation makes you honest; the buffer keeps you alive when reality is ruder than the simulation.
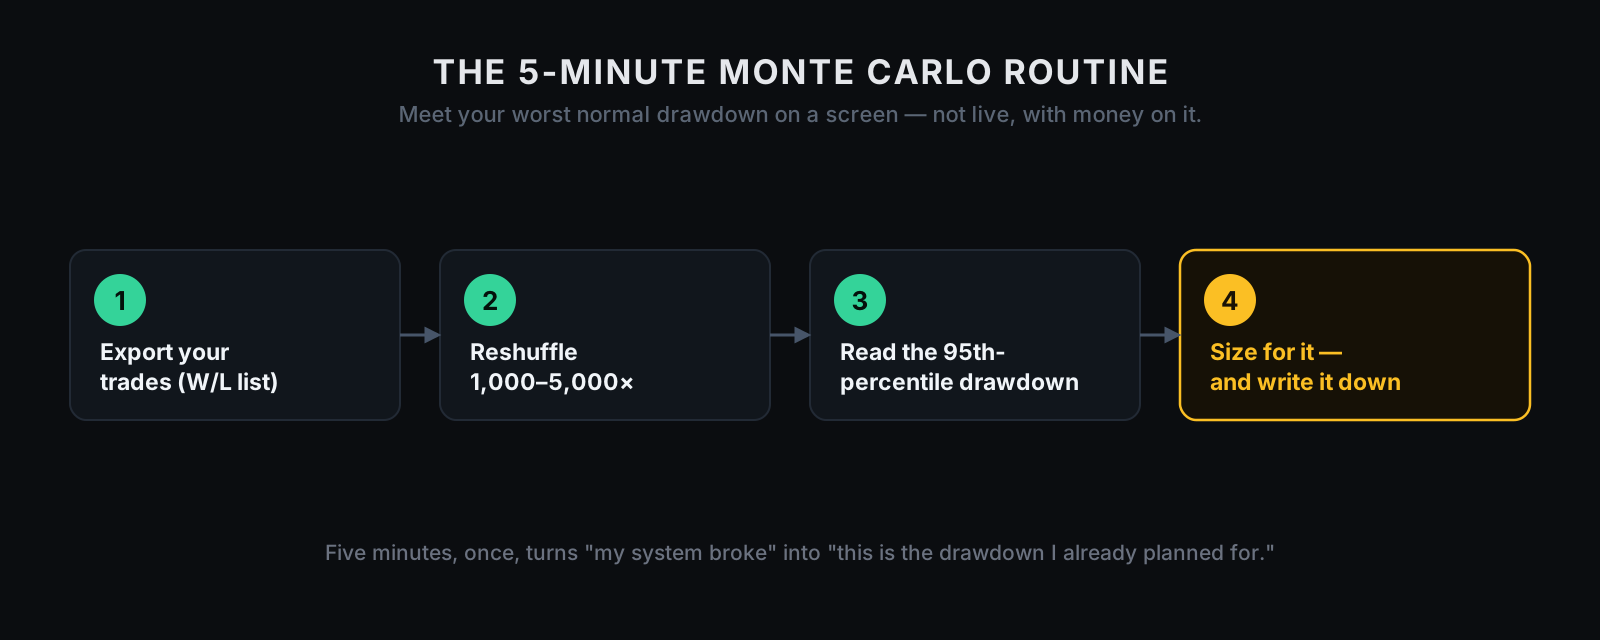
The 5-minute version
Do this before trusting any backtest drawdown again.
Minute 1 · Export the trades. Get a simple list of results, ideally in R-multiple (e.g. +1R, -1R, +2R, -0.5R, +1.4R, -1R). Percentage or dollar P&L is fine too — don't overthink it, just get the list.
Minutes 2–3 · Reshuffle them. Use a free tool, a spreadsheet, or the AI-built simulator. Run at least 1,000 sequences (5,000 if it's easy), each reshuffling the same trades and recording the max drawdown.
Minute 4 · Read the 95th percentile. Ignore the best case, the smooth line, and the backtest number you already liked. Find the drawdown in the worst 5% of runs. That's your planning number.
Minute 5 · Size for it and write it down — not in your head, on the strategy sheet:
Backtest max DD:        12%
Monte Carlo 95th-pct:   24%
Risk per trade chosen:  0.75%
Shutoff rule:           only if DD > 30% or live behaviour breaks validation
Now when the account drops 18%, you don't panic — you recognise it. You already met this future in simulation. That's the whole point.
Where this meets ProEA
This is why a serious system shouldn't just show you a backtest — it should give you the trade-level evidence. A smooth equity curve is easy to admire; a trade list is harder to fake emotionally, because you can stress it, reshuffle it, ask what happens when losses cluster, and go hunting for the future the marketing chart didn't show. So MTR isn't positioned as "look at this curve, trust us." The honest version is "here's the source, here's the evidence, here are the trades — now stress the path."
A published 28-month backtest is useful, but it's still one path, one ordering, one deal of the cards. The real work begins when you pull the trades, run Monte Carlo, find the 95th-percentile drawdown, and choose the risk setting — yours to set — that lets you survive it. You don't size from the prettiest curve; you size from the ugly-but-normal one. A backtest you're only allowed to admire is a screenshot. A backtest you're invited to reshuffle is evidence. And the caveat, stated plainly: Monte Carlo only reshuffles the trades a strategy already made — it can't predict a future the strategy never sampled, and it can't turn a losing system into a winning one. It's proof of method, not proof of profit. MTR can lose like anything else. It just can't hide its drawdown from you, because you hold the cards and you can deal them again.
Disclosure
We sell source and evidence you can inspect — not outcomes, not guarantees. Monte Carlo does not predict the future; it reshuffles the trades you already have, and real markets can produce regimes your sample never contained — slippage, spread widening, broker conditions, liquidity and structural shifts can all make live results worse than simulated ones. Trading is risky, leverage magnifies it, and past performance is not future performance. Monte Carlo doesn't make a strategy safe — it makes hidden path risk visible. That's useful. It isn't magic.
Your first 20 minutes
Don't take our word for it — go reshuffle a real one.
Minutes 0–5 · Get the trades. Export the trade-level results — from MTR's published sample, your own EA in MT5, or your manual journal. Get the sequence.
Minutes 5–10 · Build the simulator. Use the AI prompt above and ask for a simple script, sheet, or web tool. Keep it boring — boring tools are the ones people actually use.
Minutes 10–15 · Find the real drawdown range. Run a couple of thousand reshuffles and compare the original max drawdown to the median, the 95th percentile, and the worst. That gap is the risk your backtest was hiding.
Minutes 15–20 · Set risk you can survive. Go back to position sizing: if the 95th-percentile drawdown is too deep, cut risk per trade until the system is tradeable for a real human. Don't argue with the histogram. The goal isn't maximum return — it's maximum follow-through.
One last thing
The market rarely beats system traders with something impossible. It beats them with something normal that arrived in an order they weren't prepared for — a losing streak, a clustered drawdown, a flat month that was always inside the system's range but never appeared in the one backtest they trusted.
One curve makes you confident. Ten thousand curves make you prepared. And prepared beats confident every time — the fund down the street isn't braver than you, it just already knows the number. Now you can too. Deal the cards again, find the drawdown before it finds you, and size the system so that when the bad-but-normal future shows up, you don't quit at the bottom.