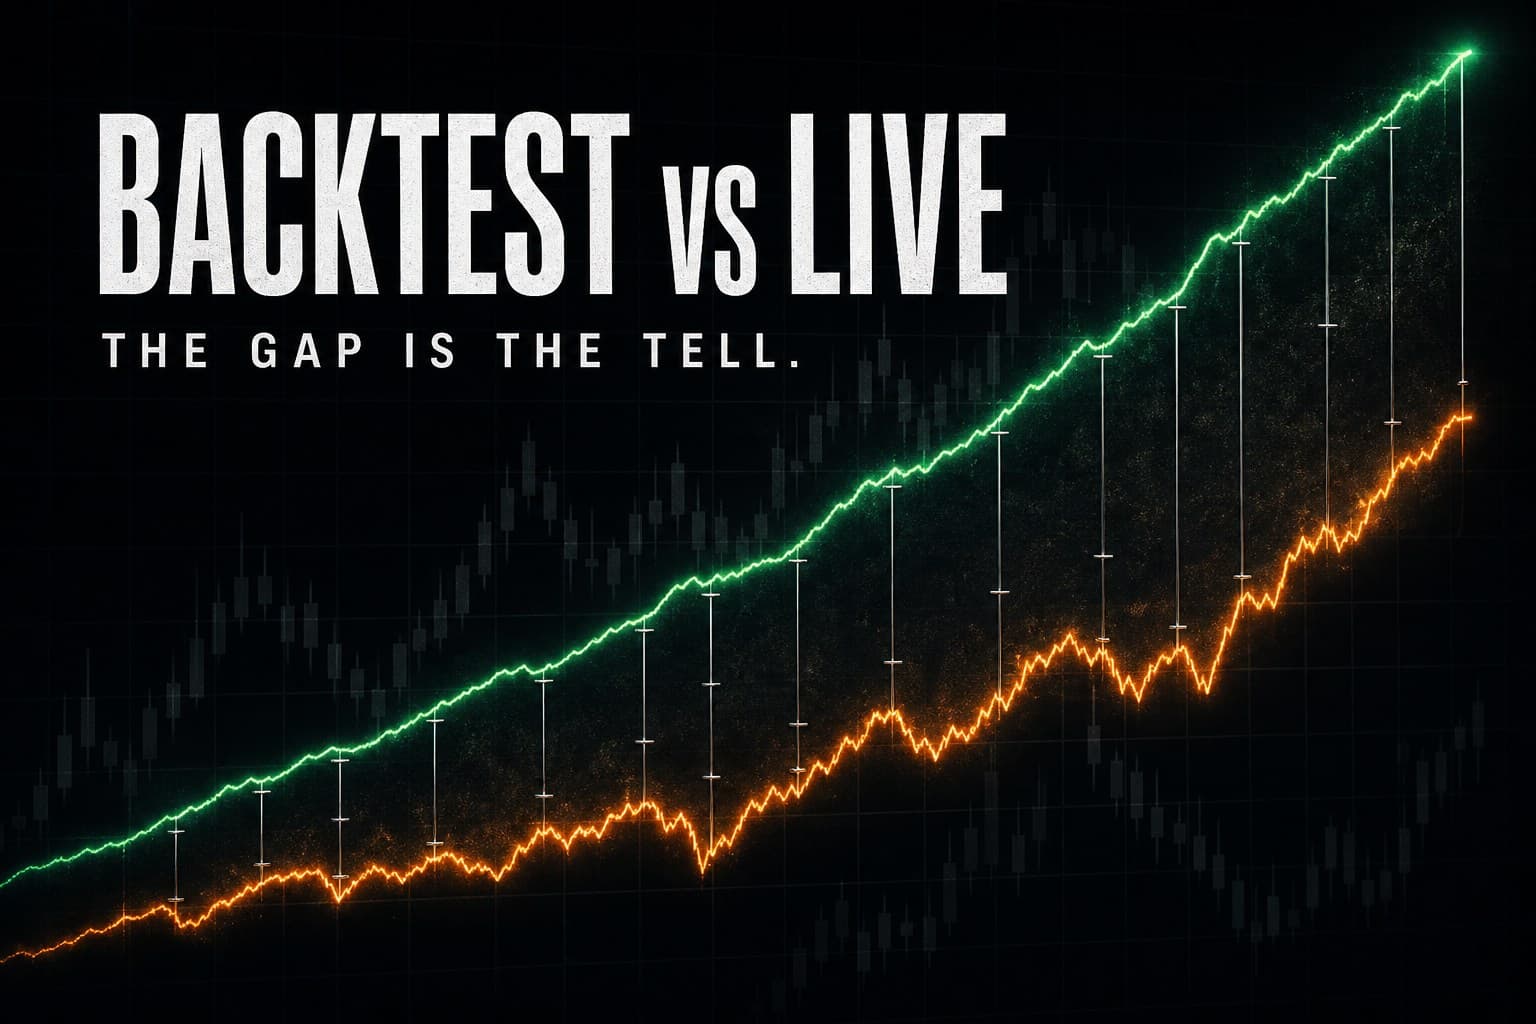
A backtest is an interview, and your settings write the questions.
The defaults ask softballs. Here's how to make the tester hostile — and why only that version is worth trusting.
How do I run a backtest in MT5?
Press Ctrl+R (or View → Strategy Tester), and the tester panel docks at the bottom of the terminal. Work top to bottom through its Settings:
- Expert: Pick the EA from the dropdown. It lists whatever is compiled under MQL5\Experts (install guide here). If the EA came with a .set preset, open it in your browser to see the values it sets before you test with them.
- Symbol and timeframe: Choose the market the EA was built for. Both matter. An M1 scalper tested on H1 is a different system.
- Date: Choose Custom period and set real dates. Include ugly regimes on purpose, especially ranges and news spikes. Make sure the year the trend died is in there.
- Modelling: The setting that decides everything — next section.
- Deposit and leverage: Match your actual account. Margin behaves differently at real size. Finding out live that "it only failed at scale" is ugly.
- Start: It's at the bottom right. The first run on a symbol downloads its price history. The progress bar at the bottom is doing real work, so let it finish.

Which modelling mode should I use?
Match the mode to the decisions your EA makes. MetaQuotes documents these four modes:
| Mode | What to check |
|---|---|
| Every tick based on real ticks | Prefer available broker-recorded ticks for intrabar rules. Spreads can vary within a minute. Missing tick minutes may fall back to generated ticks. |
| Every tick | Generates a tick path from minute history; useful when real ticks are unavailable, but that path is modelled. |
| 1 minute OHLC | Uses a few reference prices per minute. Faster, with less intraminute detail. |
| Open prices only | Calls the EA at bar opens. Useful for compatible bar-open logic and rough scans; stops and pending orders have mode-specific execution limitations. |
A stop-loss is not simply ignored in a coarse mode. The issue is whether the simulated path and order execution represent your rules. If a stop and target lie inside one bar, their ordering matters; recorded ticks offer more evidence than an invented path, but do not guarantee a future live fill. Every tick vs real ticks replays one such minute in each mode.
Check history coverage, gaps and the report's data quality. Start with a manageable date range. Ticks are your broker's ticks, so another feed can produce a different backtest — one reason backtests diverge from live results.

The three settings people skip
Delays. If No Delay is selected, the test assumes ideal execution without an imposed order-processing delay. The tester settings documentation explains the available delay modes and their limits.
A realistic delay can reveal execution sensitivity. Passing that stress test is useful engineering evidence, not proof of a profitable edge.
Forward. Reserve a later slice of the date range before tuning. Develop on the first part, freeze the rules, then evaluate the holdout. Once you use that result to choose another version, it is development feedback; reserve fresh data for the next independent evaluation.
If performance collapses on the holdout, investigate overfitting, regime change, sample uncertainty and implementation differences. The collapse alone does not identify which caused it.
Profit in pips. This is a rough-estimation mode, not a realistic net-profit comparison: MetaQuotes says it omits swap and commission calculations and does not perform margin control. Disable it when evaluating costs and account constraints.
How do I read the result without fooling myself?
Trade count matters, alongside the dates, regimes and dependence between trades. A small sample can reveal execution errors, but its estimated expectancy can be very uncertain; there is no universal count that makes an edge real.
Read the per-trade numbers before the curve. Start with expectancy in R, not dollars, then compare maximum drawdown with what you'd actually sit through.
The curve you're admiring is one path through history. Our Monte Carlo simulator generates paths from an assumed win rate, reward and risk; it does not import and resample your MT5 trade list. For the actual trade record, export MT5 history and inspect it with the report analyzer. Keep those measured results separate from a hypothetical path model.
And the gap between a modelled curve and a live account has structural causes no setting removes. Feed and slippage matter. So does the regime after your data ends. Testing an EA you might buy? The pre-buy test adds the checks a tester can't run, grid and martingale risk among them.
Our EA's page separates its historical simulations and execution-delay tests. The 24 independent monthly simulations use generated ticks and reset the deposit each month; they are not a documented walk-forward study or a continuous account history. Read each dataset's settings and limitations before comparing results.