A trader showed me a system he was proud of: 200 trades, a clean journal, measured in R instead of dollars or win rate — actual expectancy, and a good-looking number, +0.40R per trade. That's the kind of figure that makes a trader sit a little taller; it says this is not random, this is not vibes, this is a system. Then I asked him to do one thing: delete the single best trade and run the numbers again.
The system went to breakeven, and the room got very quiet — not because the spreadsheet broke, but because the truth finally loaded.
He didn't have a +0.40R edge spread across 200 trades. He had one enormous winner and 199 trades that, together, did almost nothing — one great day, one monster trade, one beautiful spike in the equity curve wearing a strategy's clothes. And he had no idea, because the number that was supposed to reveal the edge — expectancy — is also the number that hid the concentration.
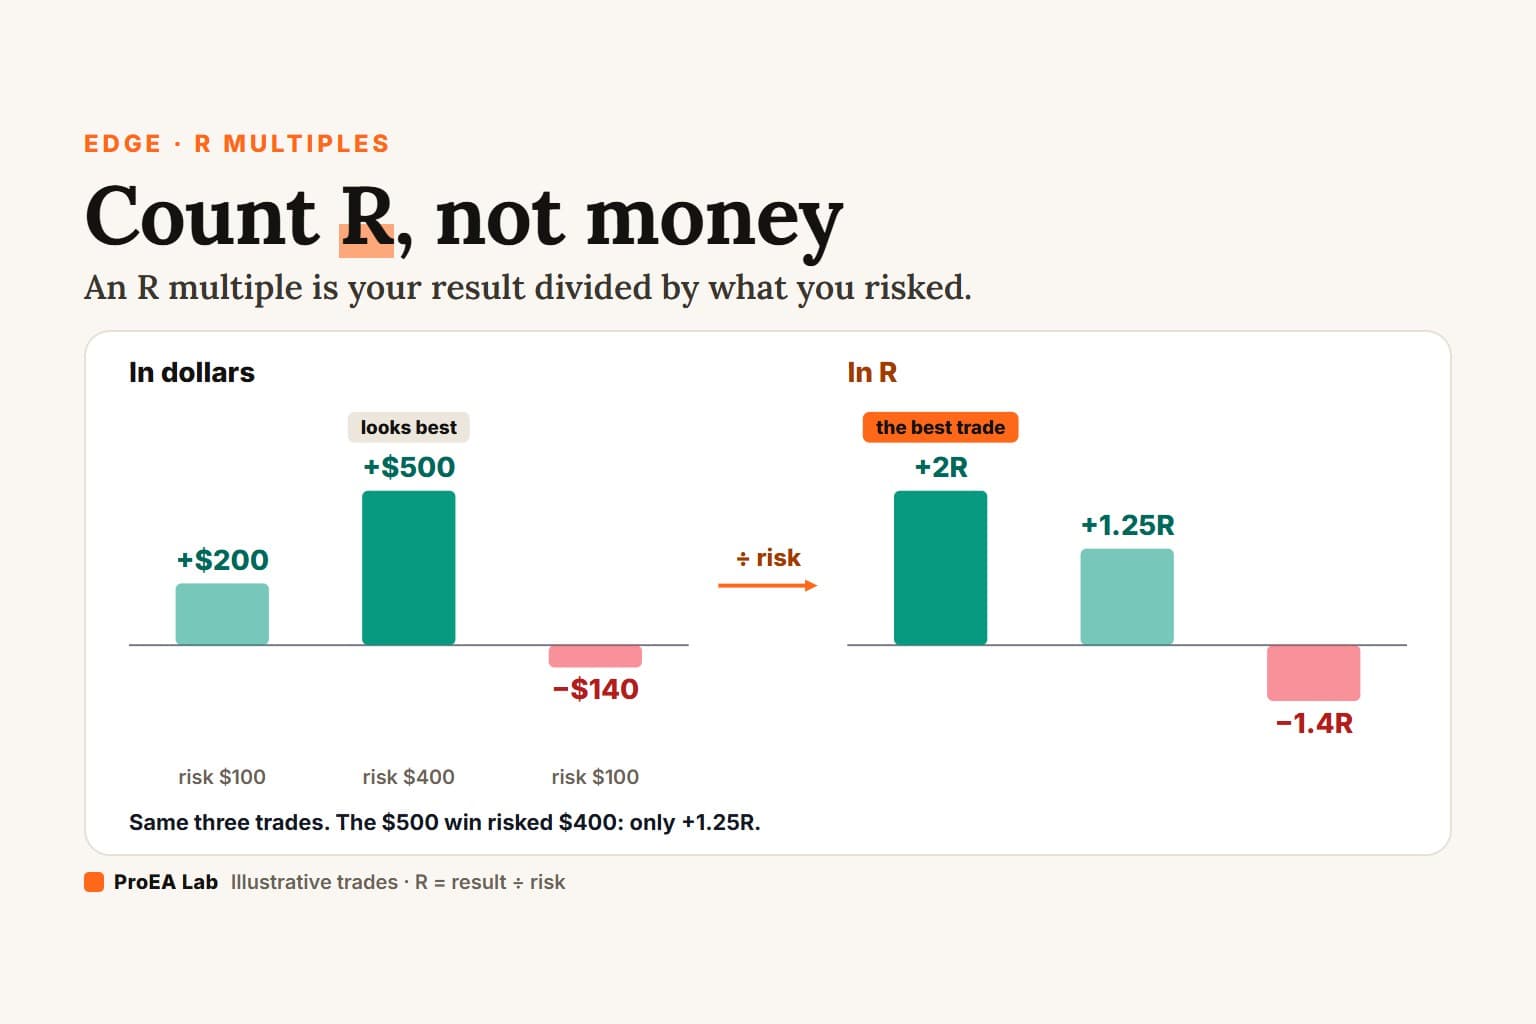
That's the trap waiting one level past the last article. In Stop Counting Money. Start Counting R. we fixed the first problem: dollars and win rate are bad measurement units. Now we fix the second: even the right unit can lie if one outlier is carrying the average. A positive expectancy might mean your system works — or it might mean one trade did all the work and the others were extras in the movie. Same headline, completely different truth, and the fastest way to find out takes about thirty seconds: delete your best trade and look at what's left.
Two requests before we start:
- Save this and run the drop-your-best-trade test on your own history before your next session.
- Send it to the trader who keeps screenshotting one monster win. That trade might be the whole "system."
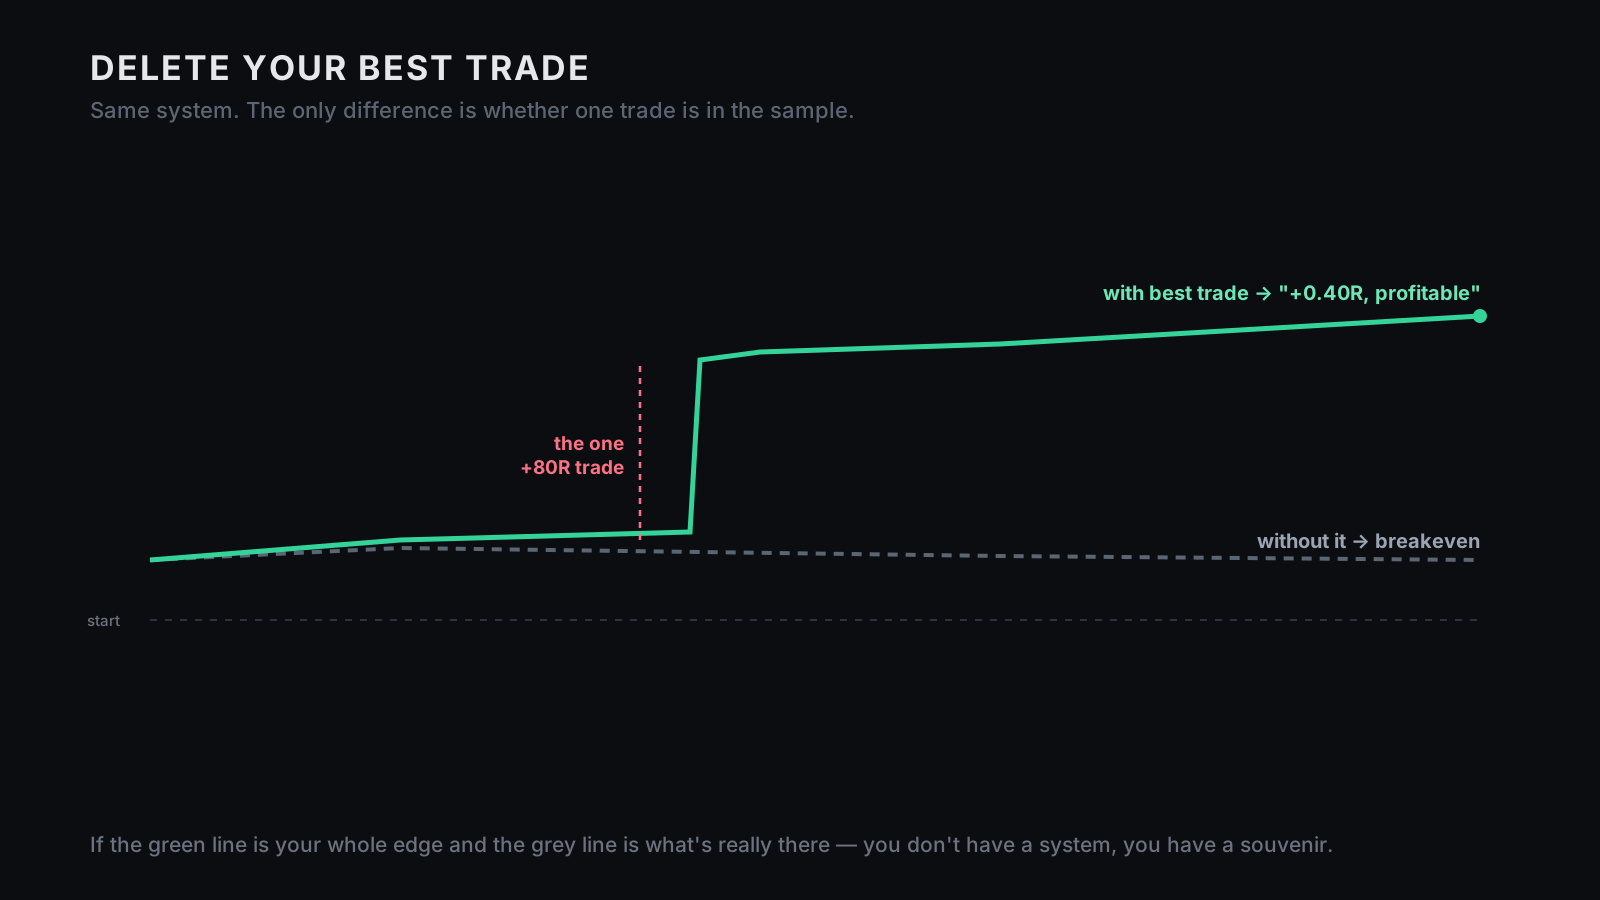
remove the single best winner and recompute — if the edge dies, you may have a lottery ticket, not a system.
outlier robustness check ↗a review zone, not a commandment: if profit factor collapses toward breakeven after dropping top winners, treat the system as fragile.
profit-factor zones ↗tail-driven systems need large samples — a few monster trades don't prove a repeatable fat-tail edge.
tail / skew discipline ↗The one-sentence version
Expectancy is an average, and averages can be hijacked: one huge trade can pull the mean upward so hard that a flat system looks profitable, a noisy one looks skilled, and a lucky moment looks like a repeatable edge. That doesn't make expectancy bad — it's still the right number — it just needs to be stress-tested, and the test is brutally simple:
Remove your best trade → recompute. Then your top 2. Then your top 5%.
If the edge survives, it's probably distributed; if it collapses, it was concentrated. And if one trade disappearing turns your system from "profitable" to "nothing," you didn't build a machine — you witnessed a moment. This article is how to tell the difference, plus the two numbers that expose concentration without deleting anything, and the one honest exception where a few giant winners are the whole point on purpose.
I — One outlier hijacks the average
Here's the math problem hiding inside expectancy. Imagine 200 trades where the first 199 are basically flat — some wins, some losses, a lot of noise, nothing that proves much. Then one monster appears, a +80R freak, and you spread it across the sample:
+80R ÷ 200 trades = +0.40R per trade
Suddenly the system shows a +0.40R expectancy and looks worth studying — and nothing about the other 199 trades changed. The average didn't measure a skill that was present 200 times; it measured one event and smeared it evenly across the row. That's what averages do: they don't care whether the edge appeared everywhere or once, they add everything up and divide. Very elegant, very dangerous.
This is why expectancy is both powerful and incomplete. It answers what was the average result? — and refuses to answer where did the result come from? An edge spread across many trades is a system; an edge carried by one trade is a dependency — and the average reports them as the identical number. Dependency isn't automatically bad, but you have to know you have it.
II — Two systems, same +0.40R, opposite truth
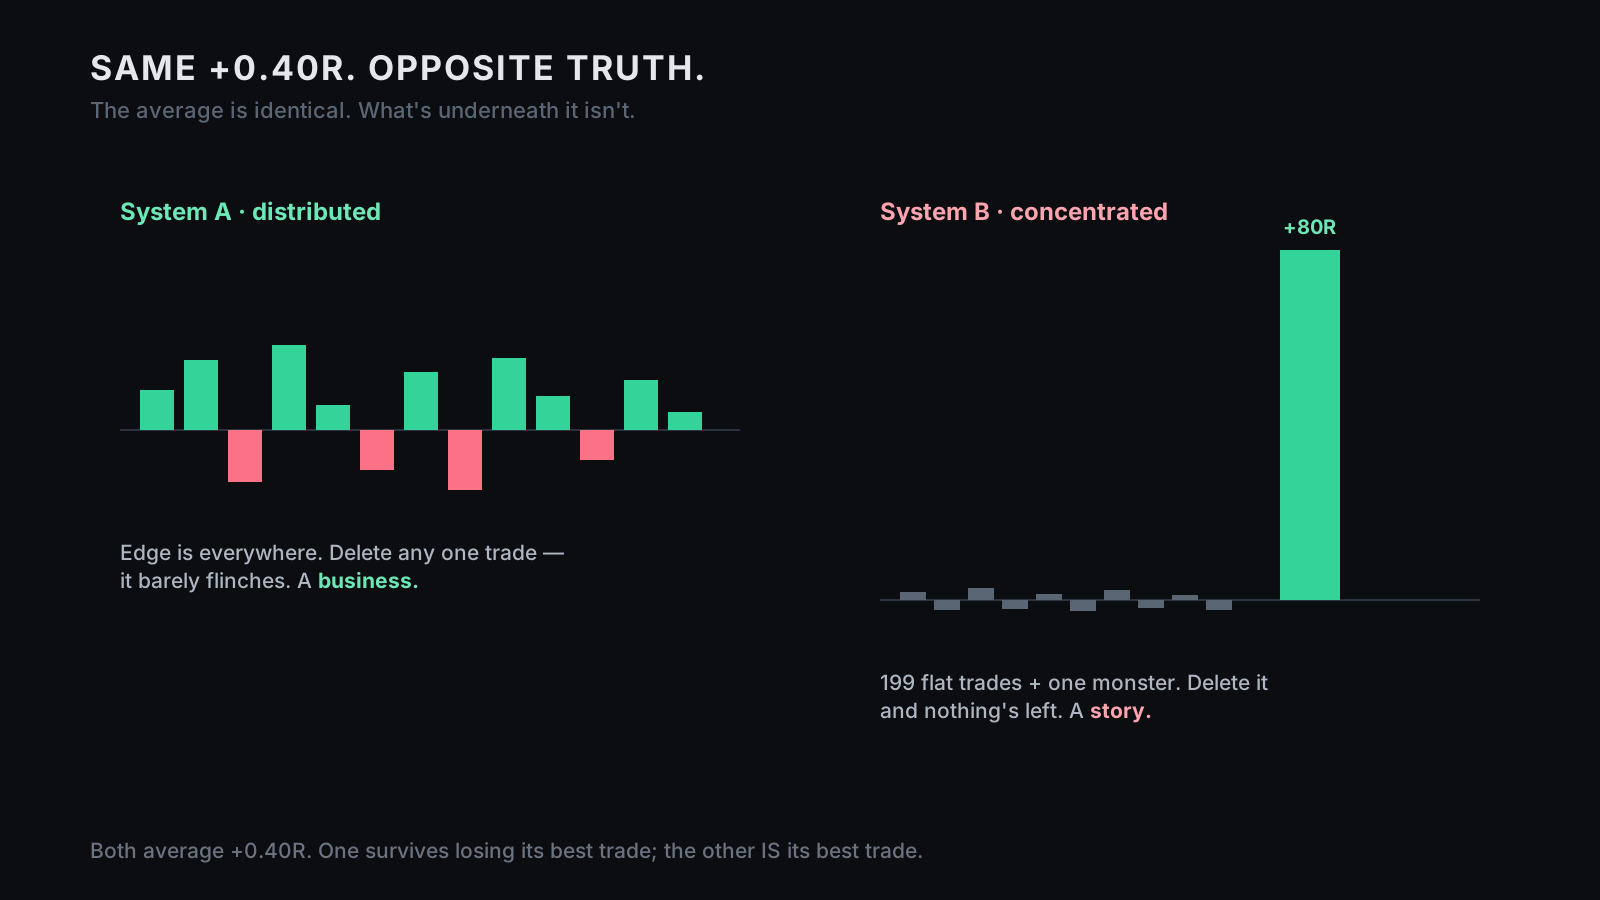
Picture two systems, both 200 trades, both showing +0.40R — same headline, same reason to get excited and start designing a dashboard. But the distributions are opposites:
System A:  +0.3R  +0.5R  −1R  +0.8R  +0.2R  −0.7R  +0.6R …   (edge everywhere)
System B:  199 trades ≈ flat   +   1 trade at +80R           (edge is one trade)
System A made its money in lots of small pieces — no single trade matters, delete any one and it barely flinches. System B was flat-to-negative for 199 trades and caught one rocket that carried the whole average. System A is a business; System B is a story — and the average can't tell you which one you own. System A can lose its best trade and still have a method; System B is the best trade. The average tells you the result; only the distribution tells you the truth.
III — The drop-your-best-trade test
So you stress it, and the test is almost insultingly simple: sort by R, delete the single best trade, recompute expectancy — then the top two, then the top 5% — and watch the number at each step. A robust, distributed edge bends; a fragile, concentrated one snaps the moment its favourite trade is gone:
              Full sample     Drop top 1     Drop top 2
System A      +0.41R          +0.37R         +0.33R     ← bends: still an edge
System B      +0.40R          +0.06R         −0.12R     ← snaps: it WAS the trade
You can run the same check on profit factor, and there's a useful review zone for it — drawn from where profit factor sits between fragile and solid, not from spreadsheet superstition:
Profit factor   full 1.65 →  drop top 1: 1.28  →  drop top 2: 1.05

After dropping the top 1–2 trades:
  comfortably above ~1.2  →  more believable
  near 1.0–1.2            →  fragile / review zone
  below 1.0               →  the outliers were doing the work
Don't turn 1.2 into a holy number — it's a warning line, not a commandment. The point is plain: a system that only works while its best trade stays in the sample hasn't earned your trust yet. Delete your best trade. If there's still an edge, you have a system. If there isn't, you have a souvenir.
IV — Mean vs median
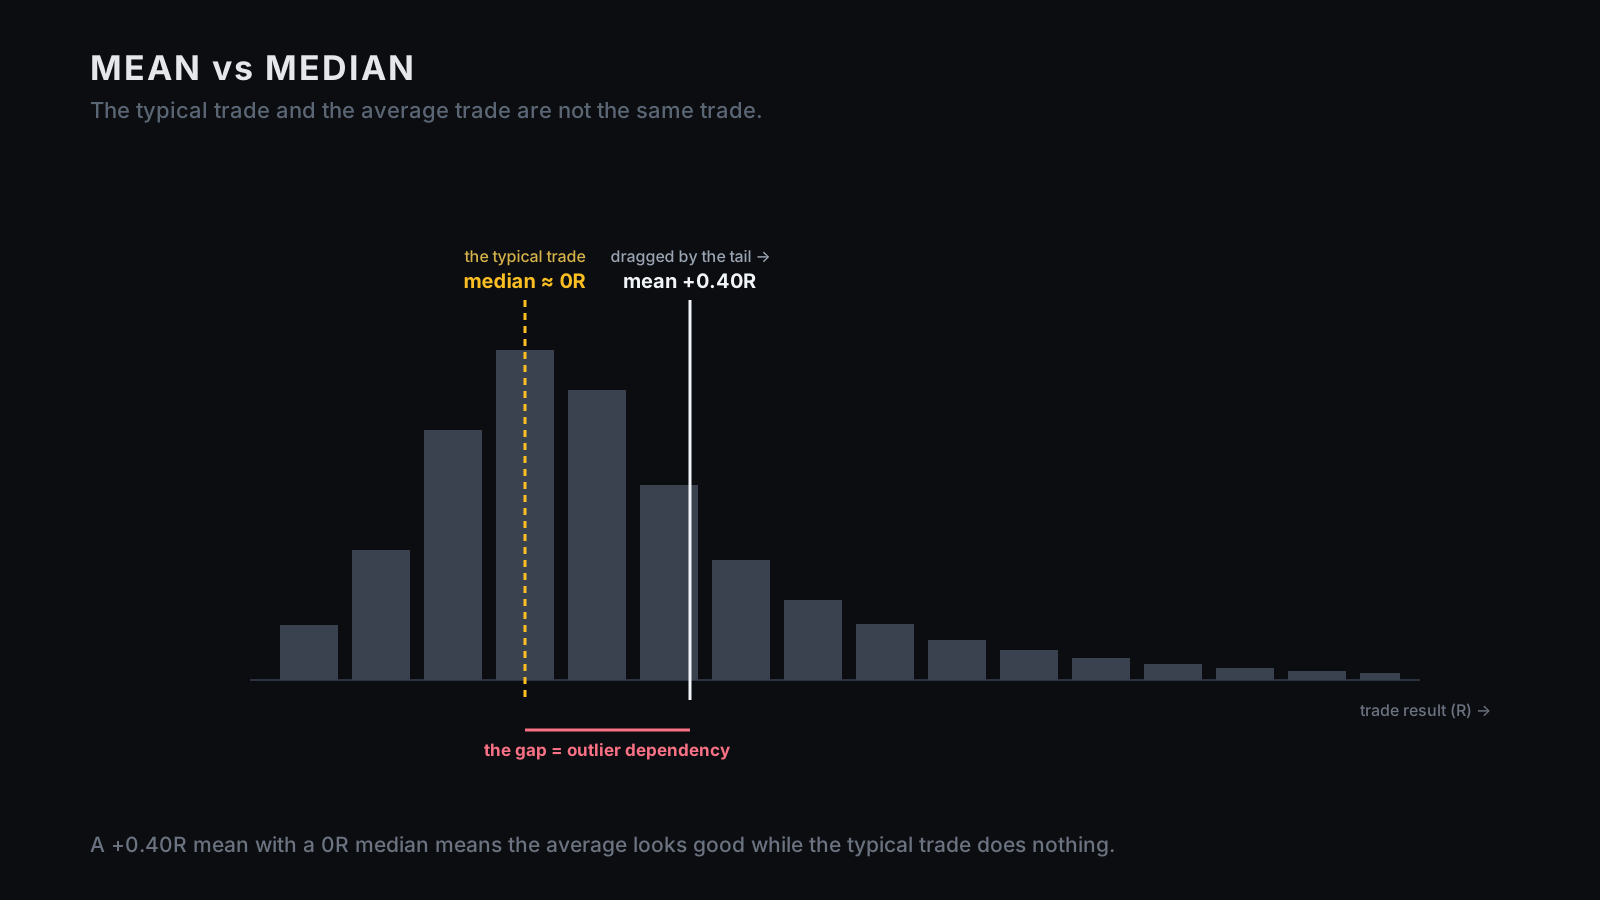
There's an even faster tell that needs no deleting: compare the mean R to the median R. The mean is the average (easily yanked up by a few giant winners); the median is the middle trade — line them all up smallest to largest, and the one in the middle is your genuinely typical result.
Mean R:   +0.40R     Median R:   0.00R    →  average looks good, typical trade does nothing
Mean R:   +0.40R     Median R:  −0.20R    →  the typical trade LOSES; only outliers save it
When mean and median sit close together, the edge is evenly spread; when the mean towers over the median, that gap is the outlier dependency, in two numbers. It's the same reason average net worth in a room is meaningless if one person is a billionaire, while median net worth describes the actual people. The mean tells you what your average trade made; the median tells you what your typical trade made — and when they disagree loudly, your edge is hiding in the tail, not in your hands.
V — Profit concentration
The third lens turns it into one percentage: what share of your total profit came from your top few trades? Add up your winning R, then ask how much of it the top 5% produced:
Total winning R:   +300R
Top 5% winners:    +210R   →   profit concentration = 70%
Five percent of trades producing 70% of the winning R means the system isn't really 200 edges — it's ~10 that mattered and 190 passengers, and profit factor and expectancy hide this completely. That isn't automatically fatal, but it changes what you're actually long: a distributed system says my edge shows up often enough that no single trade defines me, while a concentrated one says most of my edge comes from rare winners, so I must survive long enough to catch them. Those are different businesses — different sizing, different psychology, different stop rules. Profit concentration doesn't tell you whether a system is good or bad — it tells you what creature it is, and you should know the creature before you feed it real money.
VI — When the tail is the point
Now the honest exception, because "outliers carry it" is not always a flaw — sometimes it's the entire design. Trend-following is the classic case: it deliberately takes many small losses (low win rate, lots of −1R), cuts losers, waits, gets chopped, looks stupid for a while — and then one trend appears and it holds the winner enormously. That's not an accident, it's the business model; trend-followers have positive skew (mean above median) on purpose, harvesting the fat right tail. So if you drop a trend-follower's best trades and it weakens, that's not automatically a red flag — you may have removed the exact events the strategy exists to capture.
That's why the test must be judged by design, not by reflex:
mean-reversion / scalping        →  one trade carries it?  WARNING (design ≠ reality)
grid / "recovery" (smooth promise) →  outlier-dependent?     MAJOR WARNING
trend-following / breakout        →  fat right tail?         EXPECTED — but prove it
The honest question was never "do outliers exist?" — it's was this tail part of the design, and can the system capture it repeatably? And that's a much higher bar: a tail-driven edge only reveals itself over hundreds-to-thousands of trades across markets and regimes (the sample-size problem at its most demanding), it needs the capital to keep paying for the next big winner, and the discipline to sit through long droughts because the next monster trend never sends a calendar invite. Designed outliers are a strategy; accidental outliers are luck with a better outfit — know which one you own.
VII — Bootstrap the outlier out
The top-quant version stops deleting one trade by hand and resamples the whole distribution — the Monte Carlo idea pointed straight at the tail. You take your trades in R, draw them at random thousands of times to build thousands of alternate histories, and ask how often the system stays profitable when the monster winners don't land early — or don't land at all. A robust edge survives the vast majority of those resamples; a fragile one only looks good in the orderings where its hero trade shows up. You can go a level deeper and compare runs with the winners progressively removed or capped:
Run A: all trades            Run D: top 5% removed
Run B: top 1 removed         Run E: winners capped at the 95th percentile
Run C: top 2 removed         → compare expectancy · profit factor · max DD · % profitable
Now you've replaced "did the backtest work?" with a distribution. The amateur asks whether the strategy worked; the professional asks how much luck they can remove before the edge disappears. It doesn't guarantee live performance — nothing does — but it breaks weak stories in private, before the market breaks them in public.
The 5-minute version
Run this on the trades you already have, ideally in R.
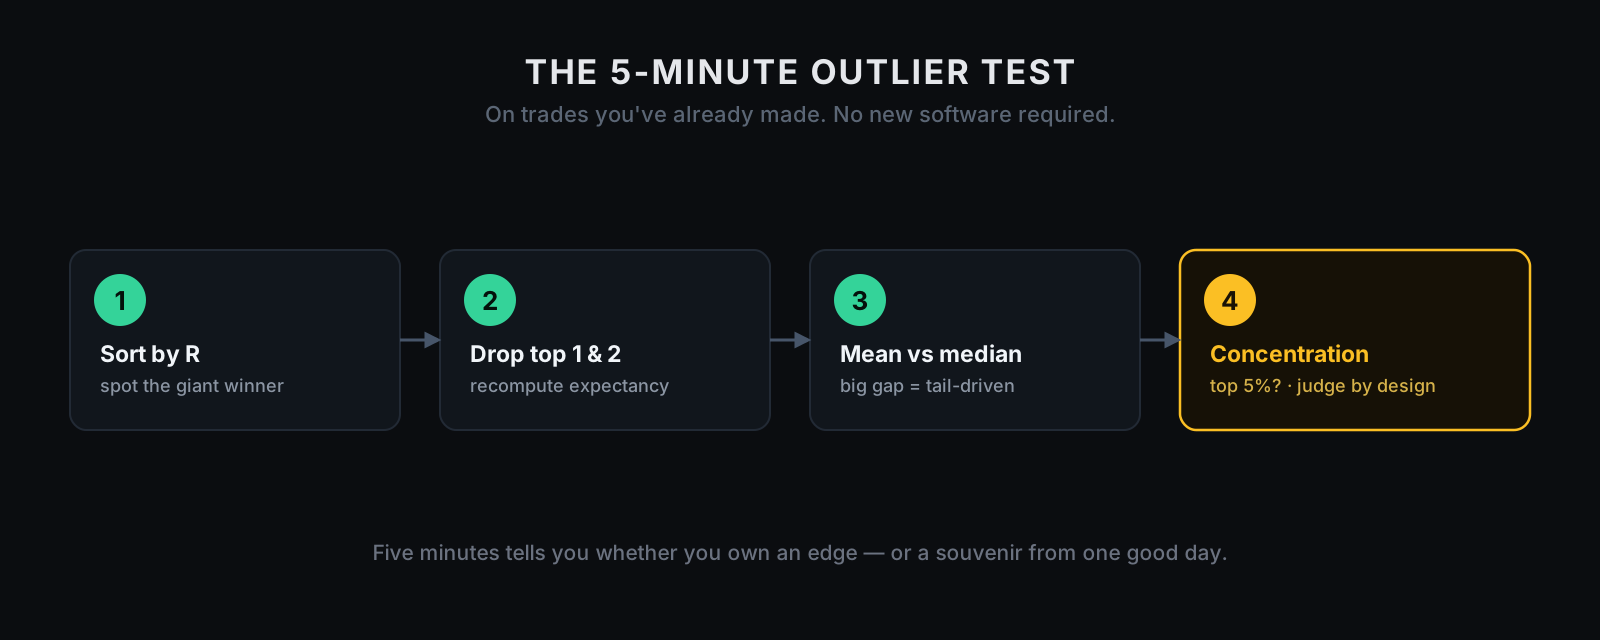
Minute 1 · Sort by R. Order best to worst and look at the top — is one trade two, five, ten times bigger than the rest? That's your suspect (not guilty yet).
Minute 2 · Drop the best and recompute. Delete your single biggest winner, recalculate expectancy, then delete your top two:
Full sample: +0.40R Drop top 1: +0.08R Drop top 2: −0.05R
That isn't a distributed edge — it's one good day with a spreadsheet halo.
Minute 3 · Compare mean vs median. Find the median (middle) trade. If the mean is good but the median is flat or negative, the edge lives in the tail.
Minute 4 · Check the concentration. What share of total winning R came from your top 5%? Write the percentage down — don't round it into something more comfortable.
Minute 5 · Judge by design, then automate. One trade carrying a win-often system is a red flag; for a trend-follower it's expected but needs a big sample. Then hand the audit to AI:
Here's my trade history in R. Run an outlier-dependency audit:
1. Expectancy on the full sample, then after dropping top 1, top 2, top 5%.
2. Profit factor on the full sample and each drop.
3. Mean R, median R, and the mean-minus-median gap.
4. Largest winner as a % of total profit; top 5% winners as a % of total profit.
5. Classify: DISTRIBUTED EDGE · TAIL-DRIVEN BY DESIGN · FRAGILE/OUTLIER-DEPENDENT · INCONCLUSIVE SAMPLE.
6. Flag if: sample < 100; dropping 1–2 trades turns expectancy negative; or mean is
   positive while median is near zero/negative. Does the concentration match the
   strategy type (scalp / mean-reversion / trend / grid / breakout)?
That's the same build-it-yourself workflow, pointed at the question your best trade doesn't want you to ask — a spreadsheet interrogator with no emotional attachment to your favourite trade.
Where this meets ProEA
This is exactly how you should pressure-test anyone's numbers, including ours. A seller can show a big net profit, a strong expectancy, a clean equity curve — but if you can't see the trade-level record, you can't ask the one question that matters: what happens if I remove the best trade? That question is uncomfortable, and it should be. A track record you can only admire can hide all of its concentration behind one number; a track record you can stress has to reveal it (it's the same honest-vs-fake line as a win-rate headline). We publish the 28-month grid as trade-level evidence precisely so you can drop our best trade, recompute, compare mean to median, and check concentration yourself — instead of trusting a headline.
Marketing gives you the number it wants you to see. Evidence gives you the trades and lets you ask rude questions. And the honest caveat, because it cuts both ways: a system can survive the drop-best-trade test and still fail live — costs change, execution worsens, regimes shift — and a concentrated edge can be perfectly legitimate if it's tail-driven by design. Surviving the test makes an edge more believable, not guaranteed; it's proof of method, not proof of profit. But it's the difference between a number you measured and a number you got handed. Measure ours; measure your own.
Disclosure
We sell source and evidence you can inspect — not outcomes, not guarantees. Drop-best-trade checks, mean-vs-median comparisons, profit-concentration analysis, and bootstrap resampling describe a historical sample; they do not predict the future. A distributed historical edge can still decay; a concentrated one can still be a legitimate tail-driven design; a trend-following system can genuinely require rare large winners, while a mean-reversion system carried by one is a warning. Trading is risky, leverage magnifies it, and past performance is not future performance. The point isn't certainty — it's knowing whether your edge was spread across the system or carried by one beautiful accident.
Your first 20 minutes
Don't take our word for it — go delete a trade.
Minutes 0–5 · Stress your own system. Sort your last 50+ trades by R, drop the best one, recompute expectancy, and watch how much it moves. Barely → good. Collapses → pay attention.
Minutes 5–10 · Find the median. Compare mean R to median R; the gap is the part of your "edge" living in the tail — then ask whether that tail was part of the plan.
Minutes 10–15 · Check the concentration. Work out how much of total profit came from your top 5%, and write the real number down.
Minutes 15–20 · Build the audit. Hand the AI prompt your history so the drop-best-trade test, mean-vs-median, and concentration check are one paste away for every system you ever evaluate — and stress MTR's published grid the same way.
One last thing
Your biggest winner feels like proof you've figured it out. Sometimes it is. Often it's the one trade carrying a system that, without it, has nothing — and because it's your favourite number, it's the last one you'll ever question.
So question it first. Delete your best trade and look at what's left: if there's still an edge, you built something; if there's only that one trade, you didn't build a strategy — you witnessed a moment, and gave it a name.