Turtle soup is a failed-breakout trade from Laurence Connors and Linda Raschke's book Street Smarts. When price makes a new 20-day low and the previous 20-day low is at least four sessions old, you place a buy stop just above that old low, good for the day; if it fills, the stop goes just under the day's low. A new 20-day high is the mirror. ICT later used the name for any raid of an old high or low that reverses.
Every chart below replays simulated daily candles read by one written rule, with the day of the raid played 15 minutes at a time. The raid is a liquidity sweep attempt on a 20-day clock.
The Turtles sold the new low.
The soup buys it back.
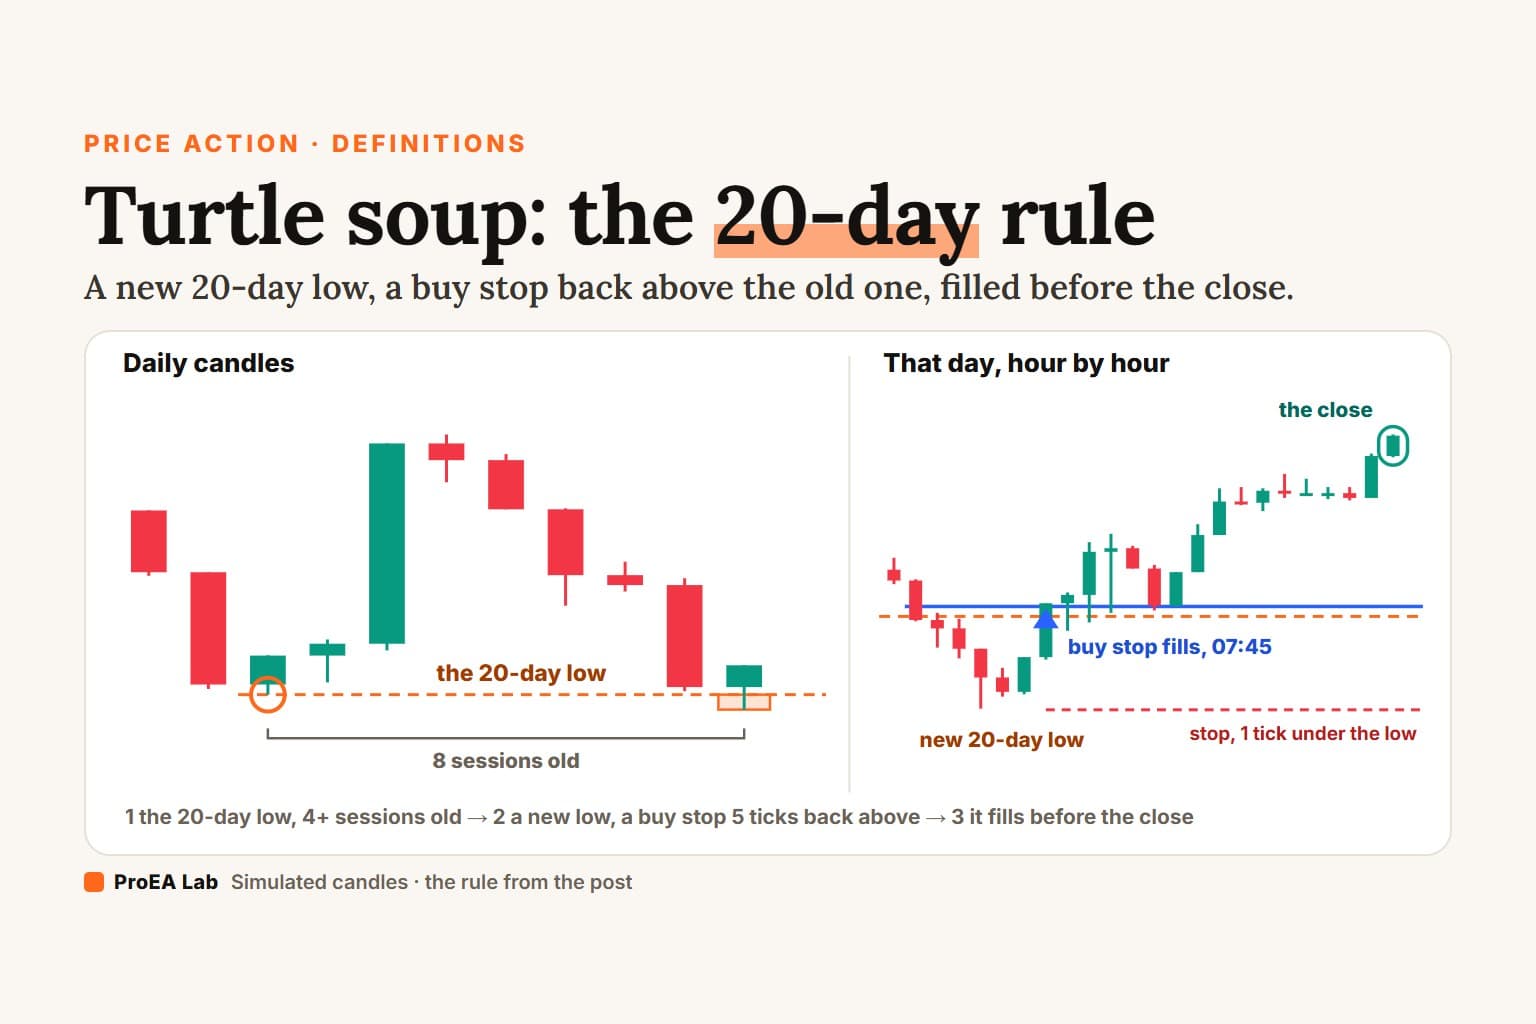
The order fills before the close. The close says what the day was.Simulated daily candles, not market data; the soup's day plays 15 minutes at a time. A tick is 0.01 here: the entry stop sits 5 ticks inside the old extreme, the stop 1 tick beyond the day's extreme at the fill.
Read as text
- Simulated daily candles. Over the 20 sessions before Tuesday Aug 29, the lowest low is 93.08, made 8 sessions before it: the old low.
- In the 01:45 candle (15 minutes, simulated clock) price trades below 93.08: a new 20-day low, where a 20-day breakout entry would sell.
- In the 07:45 candle price trades back above the old low to 93.13, 5 ticks inside it: the buy stop fills, before the day has closed. The stop goes 1 tick under the day's low: 92.30.
- The day closes at 94.59, back above the old low: by the close the break failed, a liquidity sweep. A trader who waits for that close only sees it now.
- 2 sessions later price trades back to the stop at 92.30.
How this window was chosen: The first simulated bullish turtle soup by this page's rule with every step visible: it fills, isn't stopped out that day, and the day closes back above the old low; the raid reaches at least an eighth of an average daily candle below the old low, and the close is at least a tenth of one above it.
Use itBefore the open, mark the old 20-day low and count the sessions since it. Under four, it isn't a turtle soup.
Watch outThe buy stop fills while the day is still open. The close can still go against it.
What is turtle soup in trading?
A fade of the 20-day breakout. LuxAlgo's library says Turtle Soup was "named at the expense of the Turtles, the trend-following group trained by Richard Dennis whose rules bought 20-day channel breakouts" (LuxAlgo, Turtle Soup, no date shown, checked 2026-10-04). Where the Turtles sold a new 20-day low, the soup buys it once it fails. Where they bought a new high, it sells.
The book is Street Smarts: High Probability Short-Term Trading Strategies, by Laurence A. Connors and Linda Bradford Raschke. LuxAlgo and Oxford Strat date it 1995; Wikipedia's text says 1996, and its own citation says 1995. We haven't read the book, so every rule below is quoted from a page that states it, with that page's date.
The original turtle soup rules, and where the sources disagree
The buy side, as four pages state it. All checked 2026-10-04:
| Source | The old low | The entry | The stop |
|---|---|---|---|
| LuxAlgo library (no date shown) | "at least four sessions old" | "a buy stop back above that prior low" | "below the new extreme" |
| MQL5, Alexander Puzanov (5 Dec 2016) | "at least three days have passed since the previous 20-day low" | "5-10 points above the recently broken down price low" | "1 point below this day's low price" |
| TradingView, kulturdesken (3 Jun 2023) | "at least four trading sessions earlier" | "5-10 ticks or 5 to 10 cents above the previous 20-period low" | "one tick or one cent below todays low" |
| Oxford Strat (no date shown) | "at least 3 bars earlier", and the day closes at or below it | "the next bar after the setup at the previous 20-bar low" | three exits, tested |
They agree on the 20 sessions and on fading the break. They split three ways:
- Three sessions or four. "At least three days have passed" can mean the same as four sessions earlier, or one fewer. Oxford Strat says 3 bars.
- How far above the old low. 5 to 10 ticks, points or cents: the smallest price step, so the distance depends on the market. LuxAlgo gives no number.
- Today or tomorrow. Oxford Strat waits for a close at or below the old low, then places the buy stop at the old low on the next bar. MQL5 calls that the next-day variant, Turtle Soup Plus One: "this day's bar should close out of the range", and the stop uses "the appropriate two-day extreme". LuxAlgo: "a next-day variant (Turtle Soup Plus One) allows the reclaim to happen one session later".
The rule
Turtle soup rule
The original, as quoted above. Daily candles.
The buy side; a new 20-day high mirrors it.
1. Old low: the lowest low of the 20 sessions before
   today. On a tie, the latest one.
2. Age: it was made at least 4 sessions before today.
   Younger: not a turtle soup.
3. Raid: today trades below the old low, a new 20-day low.
4. Entry: then a buy stop 5 ticks above the old low,
   good for today only. No fill by the close: no trade.
5. Stop: 1 tick under today's low at the fill.
6. The close names the day: above the old low, the break
   failed (a sweep); at or below it, the break held.
We take LuxAlgo's and the TradingView port's four sessions and the low end of 5 to 10 ticks. Our simulated prices move in steps of 0.01, so a tick is 0.01. MQL5 adds a trailing stop once the trade is in profit; we don't model exits, so the films end at the stop or soon after the day.
Turtle soup, liquidity sweep or breakout?
The close decides, and the soup doesn't wait for it. Three traders watch the same new 20-day low. A breakout trader sells it. The turtle soup buys back above the old low while the day is still open. A trader who reads a liquidity sweep waits for the close: back above the old low is a sweep, below it a breakout.
Simulated daily candles, not market data; the soup's day plays 15 minutes at a time. A tick is 0.01 here: the entry stop sits 5 ticks inside the old extreme, the stop 1 tick beyond the day's extreme at the fill.
Read as text
- Simulated daily candles. Over the 20 sessions before Tuesday May 4, the lowest low is 115.47, made 13 sessions before it: the old low.
- In the 05:00 candle (15 minutes, simulated clock) price trades below 115.47: a new 20-day low, where a 20-day breakout entry would sell.
- In the 08:00 candle price trades back above the old low to 115.52, 5 ticks inside it: the buy stop fills, before the day has closed. The stop goes 1 tick under the day's low: 114.49.
- The day closes at 117.63, back above the old low: by the close the break failed, a liquidity sweep. A trader who waits for that close only sees it now.
- Three readers, one candle: the breakout entry was wrong by the close; the turtle soup was in before the close; the sweep reader waited for the close and saw a sweep.
How this window was chosen: The first simulated turtle soup, either way, after the two above, that fills, isn't stopped out that day and closes back inside the old extreme, under the same visibility rule.
Use itDecide which reader you are before the raid. The stop order fills early; the close comes late.
Watch outinnercircletrader.net: 'Wait for the close before acting.' That's the sweep reader's rule, not the original's.
ICT turtle soup vs the original
ICT kept the picture and dropped the numbers. innercircletrader.net calls it "a stop-hunt and false-breakout trading strategy" that trades "the failed breakout" (ICT Turtle Soup guide, published 26 Oct 2024, updated 7 May 2026, checked 2026-10-04). Its levels are "old highs, equal highs" and "old lows, equal lows", with no 20-day count and no age. Its chart is "15-minute for the parent chart", with a lower timeframe for the entry.
And it decides on the close: "If price closes past the level, the breakout is real. If the wick pierces but the body closes back inside, the Turtle Soup is in play." Then it wants "a Market Structure Shift on the lower timeframe", a CHoCH in BOS vs CHoCH terms: "The fair value gap or order block created by that candle is the entry zone." That is a liquidity sweep read on the close. The original places a stop order and fills before it.
The credit got lost along the way. TradingFinder (modified 27 Oct 2025): "The founder of Turtle Soup Strategy, Michael, designed it as a trading method to hunt liquidity". Under the innercircletrader.net guide, a reader wrote on 7 February 2025: "this is not created by ICT. It is from Linda Raschke and Larry Connors book 'Street Smarts'." The reply, two days later: "But we got it from the Michael."
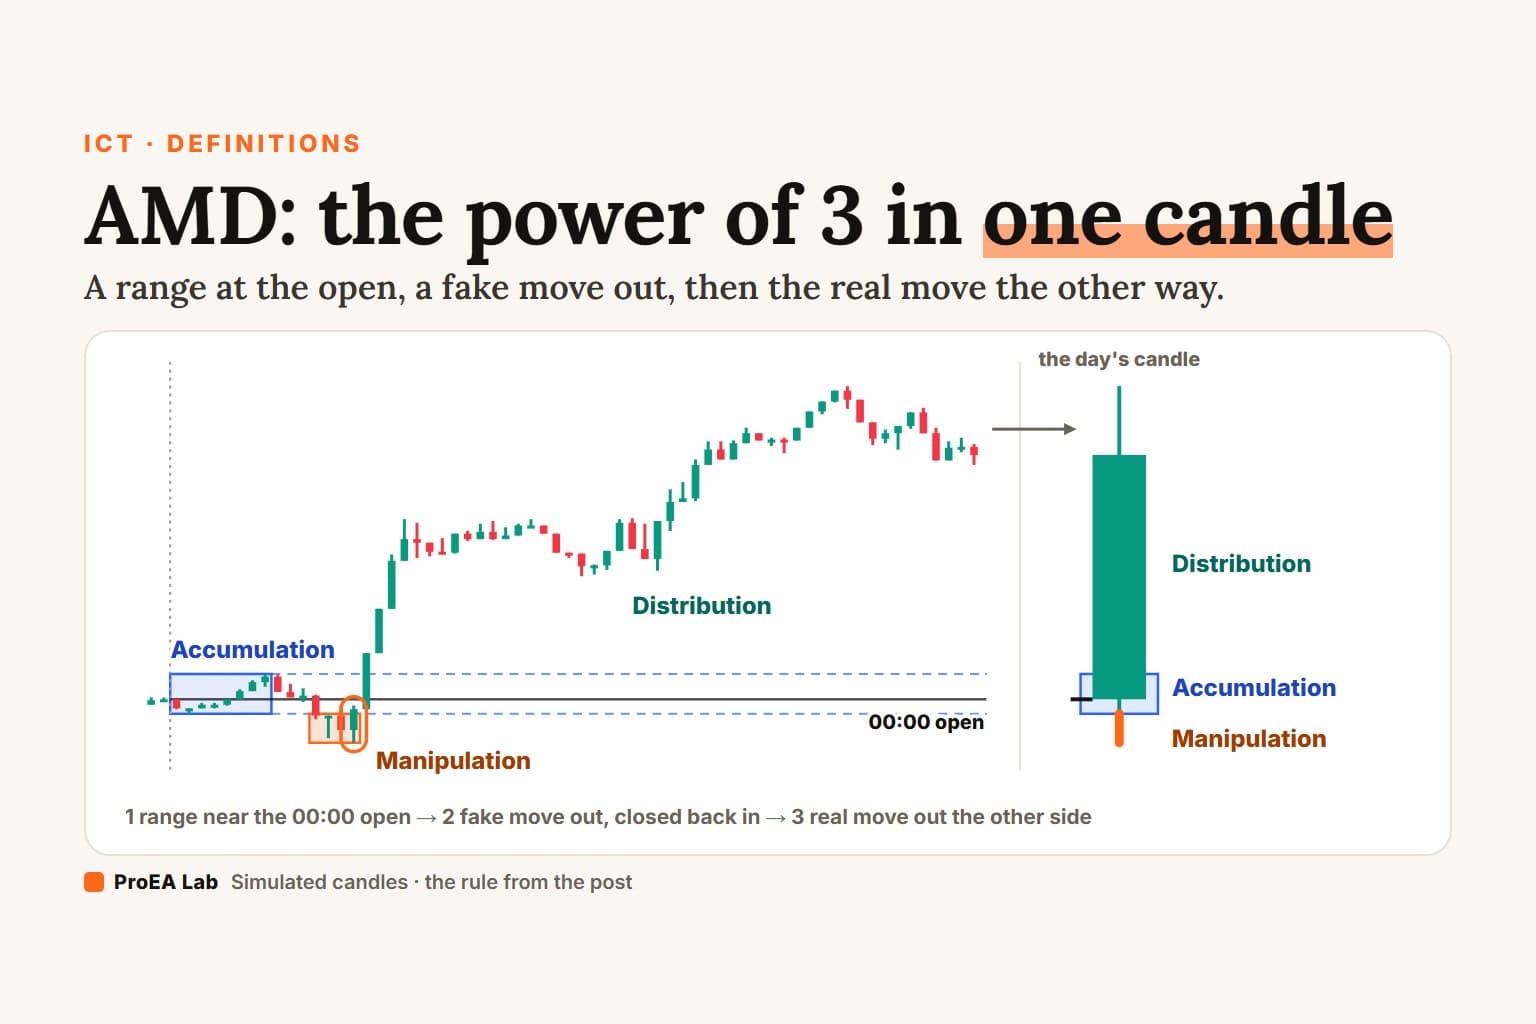
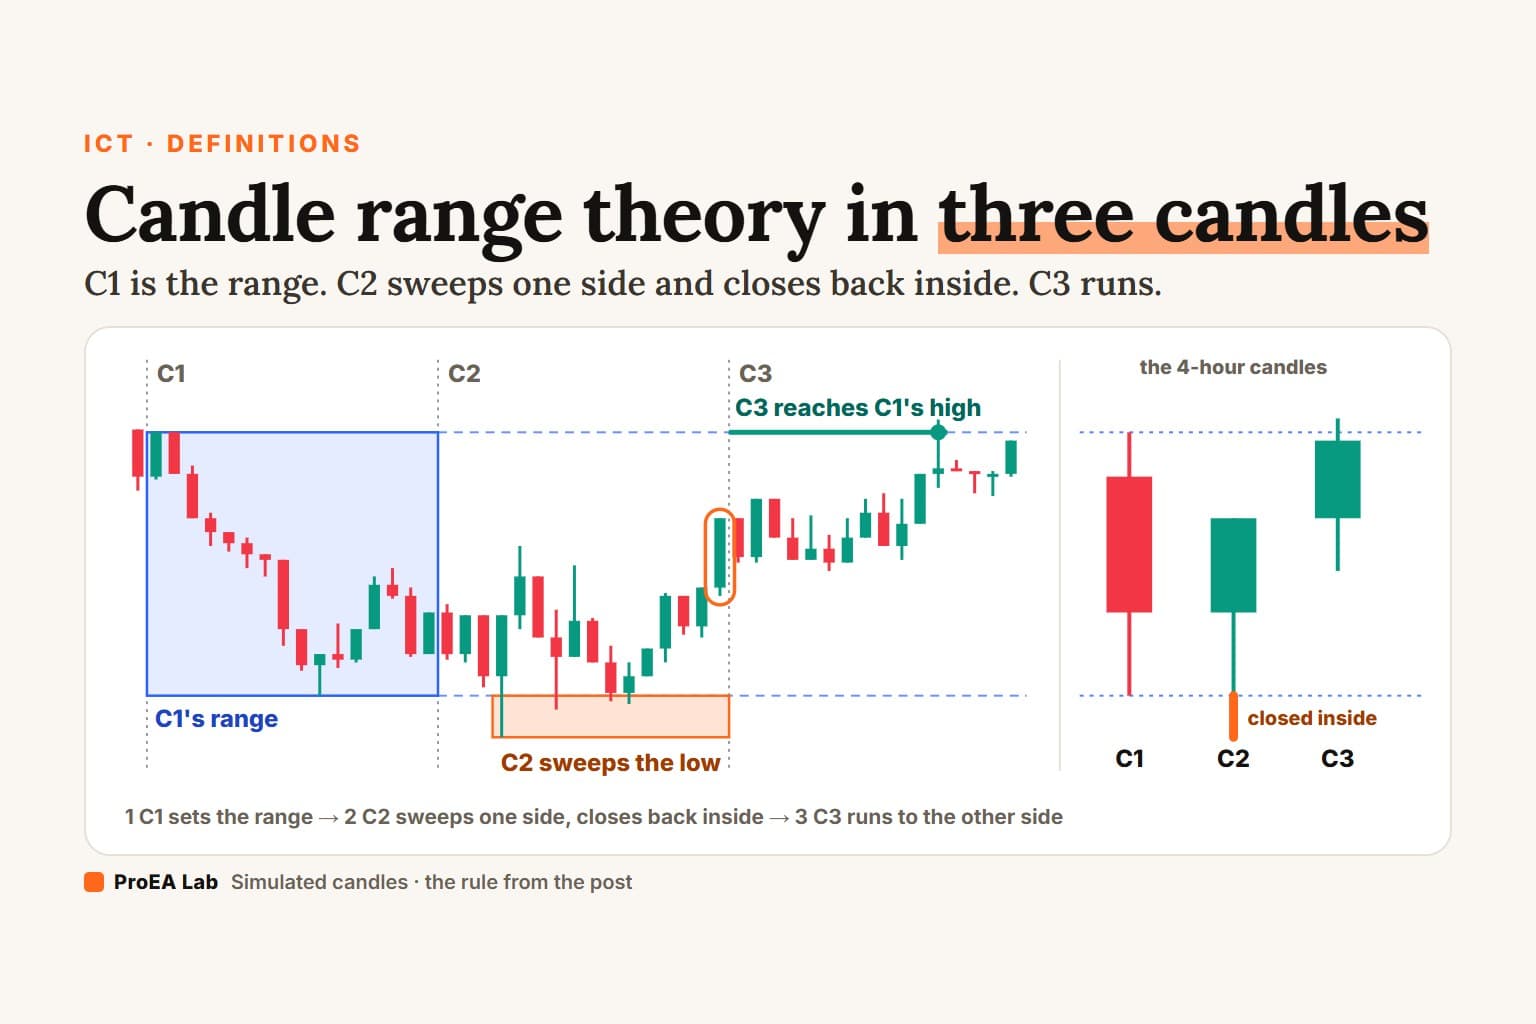
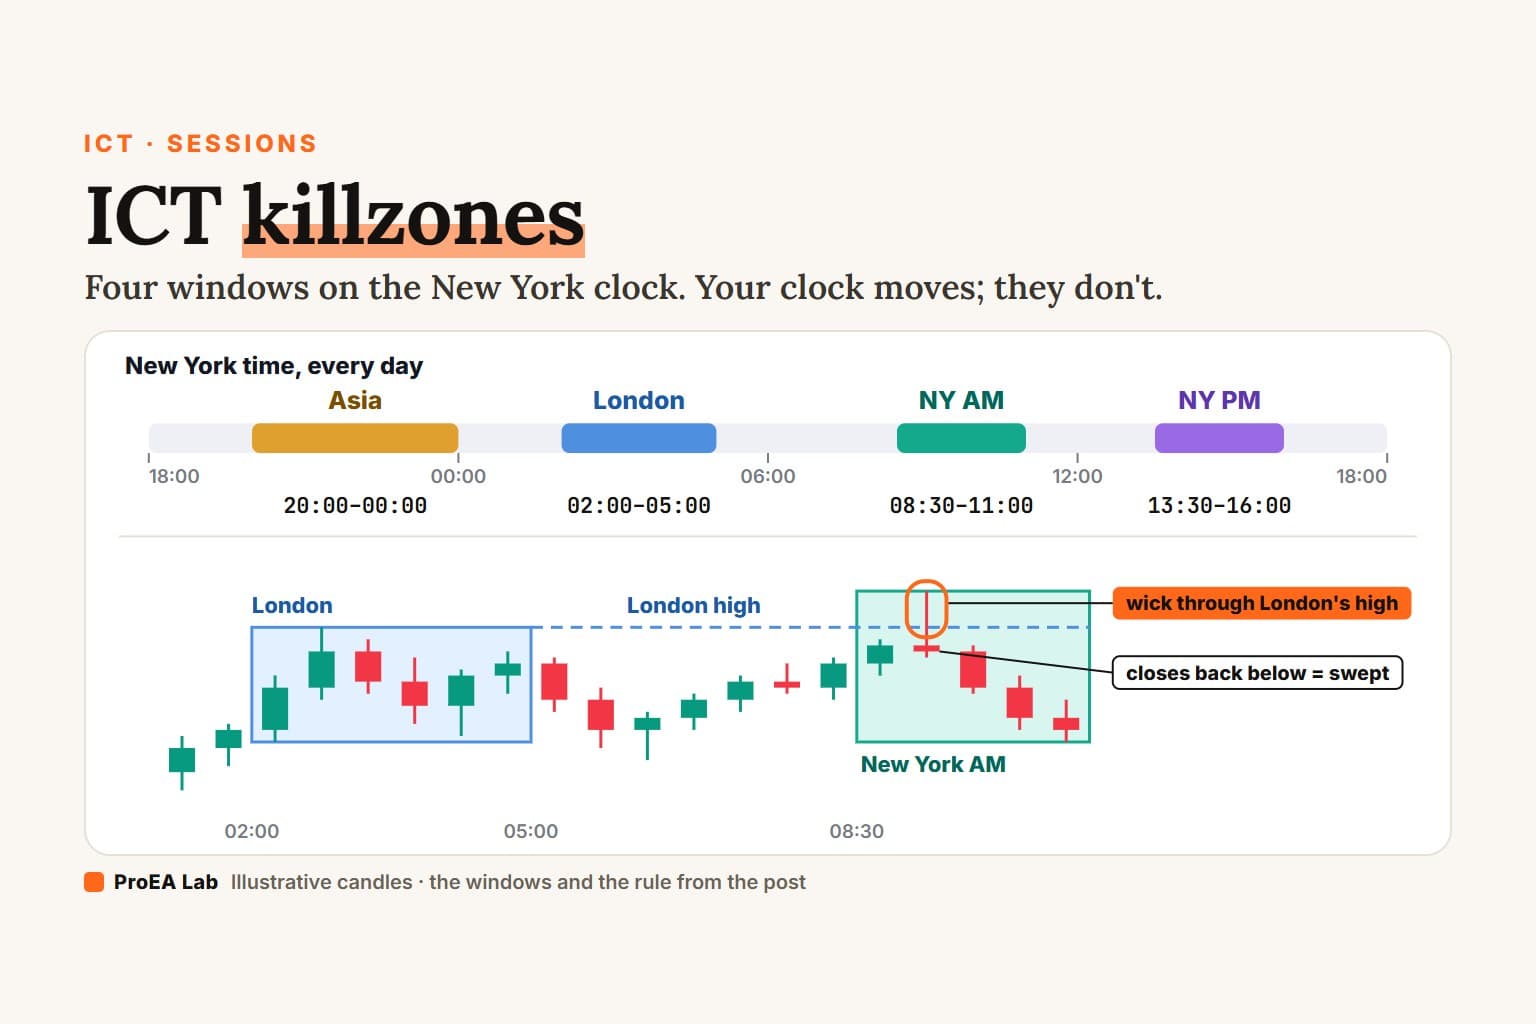
LuxAlgo puts the overlap in one line: "Every turtle soup starts with a sweep; most sweeps are never traded." A sweep of the Asian range on a midnight clock is the Judas swing; a sweep of one 4-hour candle's range, decided by that candle's close, is candle range theory (CRT).
When does turtle soup fail?
Three ways: no fill, a stop-out the same day, or a stop-out later. And a lookalike fails before it starts, because its old extreme is too young.
Simulated daily candles, not market data; the soup's day plays 15 minutes at a time. A tick is 0.01 here: the entry stop sits 5 ticks inside the old extreme, the stop 1 tick beyond the day's extreme at the fill.
Read as text
- Simulated daily candles. Over the 20 sessions before Wednesday Feb 9, the highest high is 133.64, made 13 sessions before it: the old high.
- In the 03:30 candle (15 minutes, simulated clock) price trades above 133.64: a new 20-day high, where a 20-day breakout entry would buy.
- In the 14:45 candle price trades back below the old high to 133.59, 5 ticks inside it: the sell stop fills, before the day has closed. The stop goes 1 tick over the day's high: 135.82.
- In the 21:00 candle price trades back to 135.82: stopped out the same day.
- The day closes at 136.29, above the old high: by the close the break held.
How this window was chosen: The first simulated turtle soup that fills and trades back to its stop the same day, with the entry and the stop at least an eighth of an average daily candle apart.
Use itKnow the exits before the fill: no fill by the close, the stop under the day's low, or your own time limit.
Watch outinnercircletrader.net warns against 'Trading the Turtle Soup in a strong trend.' The four-session age is the original's trend filter.
Does turtle soup show up in random prices?
Often, and it rarely lasts there. Our simulated market is the seeded random candles behind our Judas swing and CRT films, run for ten years: no orders, no stops, nobody behind it. The tally below depends on how we built that simulation and says nothing about how often turtle soup fills or holds in real markets:
| Ten simulated years, 3,637 daily candles | Count |
|---|---|
| New 20-day highs or lows | 1,173 |
| Old extreme only 1 to 3 sessions old: the rule skips it | 959 |
| Turtle soups | 214 |
| Never traded back to the entry stop: no trade | 115 |
| Filled, stopped out the same day | 84 |
| Filled, closed back inside the old extreme | 10 |
| Filled, closed beyond it | 5 |
| Of those 15, back to the stop within five sessions | 11 |
| Days that closed back inside: a sweep by the close | 22 |
In a trend, most new 20-day lows break a low made a day or two before, which is what the age rule is for. And in random prices, a stop one tick under the day's low got hit far more often than the day closed as a sweep.
How to trade turtle soup, step by step
- Before the open, mark the lowest low of the last 20 sessions and count the sessions since it. Four or more: it can be a turtle soup.
- Price trades below it: a new 20-day low. Do nothing yet.
- Place a buy stop 5 to 10 ticks above the old low, for today only. Pick one number and keep it.
- It fills: put the stop 1 tick under today's low. Don't widen it.
- No fill by the close: no trade. That was a breakout.
- Watch the close. Back above the old low is a sweep; below it, the break held and your soup is against the close.
- Plan the exit before the entry. MQL5's version trails a stop once in profit. ICT guides skip the stop order: they wait for the close, a lower-timeframe shift, and a retrace into the gap or order block it leaves.
Common mistakes
- Fading every new 20-day low. Without the age rule, most of them in a trend broke yesterday's low.
- Calling it turtle soup after the close. The original fills on a stop order during the day. A close back inside is a sweep read, a different trade.
- Moving the stop. One tick under the day's low is the rule. A wider stop is a different rule; test it as one.
- Mixing versions. Four sessions or three, today or tomorrow, 5 ticks or 10. Each changes which days count.
- Crediting the wrong source. The numbers come from Street Smarts. Guides that only say "old highs and lows" have no numbers to test.
- Taking a win rate on trust. One guide says it "converts at a 60–70% win rate". It shows no trades behind that.
Does turtle soup work?
Which tools draw turtle soup?
None of our indicators draws a turtle soup, and none of our free Pine source contains the word. Three draw the levels it raids. We read the Pine source of each.
The 20-day levels on your own chart, free. Location Desk has a rolling-window layer: set its timeframe to 1D and its bars to 20 on a daily chart, and its range low and range high lines are the 20-day low and high. Yesterday's value is the old extreme a turtle soup raids; the current candle counts, so the line steps with the raid. It doesn't check the age or place an order. ICT Levels Desk draws the previous day's, week's and (switched off by default) month's highs and lows, and gives a ⚡ swept mark to a candle that trades through one and closes back on that same candle. A turtle soup's old extreme is at least four sessions old, so it is never the previous day's; a previous week's or month's low can be one. Sweep Desk marks raids of confirmed swings, equal highs and lows, killzone sessions and the previous day and week, decided on the candle's close. On a daily chart, an old 20-day low that is also one of its confirmed swings can be one of its pools; it marks the sweep at the close, and the soup's stop order, if it fills, fills before that.
Gold Sweep Desk pools only yesterday's high and low and the Asia and London ranges, so it never has a turtle soup's old extreme. The SMC AI-Scored Toolkit (v1.4.2) doesn't draw turtle soup either; it scores order blocks and fair value gaps, with a sweep of its last swing as one factor.
More concepts, each with one rule and its own replays: smart money concepts.
Disclosure
We build Location Desk, ICT Levels Desk, Sweep Desk and Gold Sweep Desk and give them away; we sell other indicators, including the SMC AI-Scored Toolkit and the Pine Evolution Lab. We have no relationship with LuxAlgo, MQL5, Oxford Strat, innercircletrader.net, TradingFinder or the TradingView author quoted. Nothing here is financial advice.
Use these animations on your site.