1. The edge fade
Watch a failed edge test, then record whether price moves inward or leaves again. A REJ mark alone is not enough to establish a trade.
Value Envelope · Full version · Free
A band shows where estimated trading activity gathers. Watch where candles finish: inside it, outside it, or back inside after a hold.
A chart-reading tool. It does not place trades.
Group activity by price.
The band and busiest-price line move with value.
Price inside, probing or accepted outside.
Value Envelope is a free TradingView indicator that estimates a volume value area and plots how that band changes over time. It marks the point of control and applies candle-close rules for acceptance, rejection and re-entry. Rolling and anchored modes use candle data rather than individual trades at each price.
No. It names a re-entry pattern, not a measured success rate. After accepted movement outside the band, the default rule requires two consecutive closes back inside. A broken sequence resets the count before the label can appear. Read acceptance and re-entry rules
Value Envelope retains each bar's calculated band so you can follow its movement over time. Volume Profile Lite redraws a histogram for the current selected window. Both estimate activity across price rows from candle data. Read how the band is calculated
Auto weighting falls back to one weight per candle when cumulative available volume is zero. This is an activity proxy, not actual volume or time spent at each price. An individual zero-volume candle does not trigger that fallback. Read the weighting settings
Press Play, or build the picture one step at a time. This is the idea behind a volume profile.
These candles show where price moved. The short columns below show how much activity came with each candle.
Illustrative prices. We use six candles, then add two, with fixed price rows. The real indicator’s default uses 200 candles. Activity at each price is estimated.
It gives your plan a location and a sequence to study. Decide your own entry, exit and loss limit. The band does not tell you which trade will win.
It means an area containing a chosen share of estimated activity—70% by default. It is not a valuation of the asset or proof that its price is fair. The busiest line can sit above or below the band’s middle.
Try the same idea three ways. The defaults need three closes outside, then two back inside.
The close is between the upper and lower edges. There is no accepted-outside state yet.
A return requires an earlier hold outside.
This lesson holds the band still so you can follow the counts. On your chart, each candle is compared with its own recalculated band. A close on either edge counts as inside.
The tool counts where a candle closes. A wick can enter the band while the close stays outside. Also, a return needs an earlier established hold—not just one candle outside.
Start with the band and the busiest-price line. Read the event labels after that.
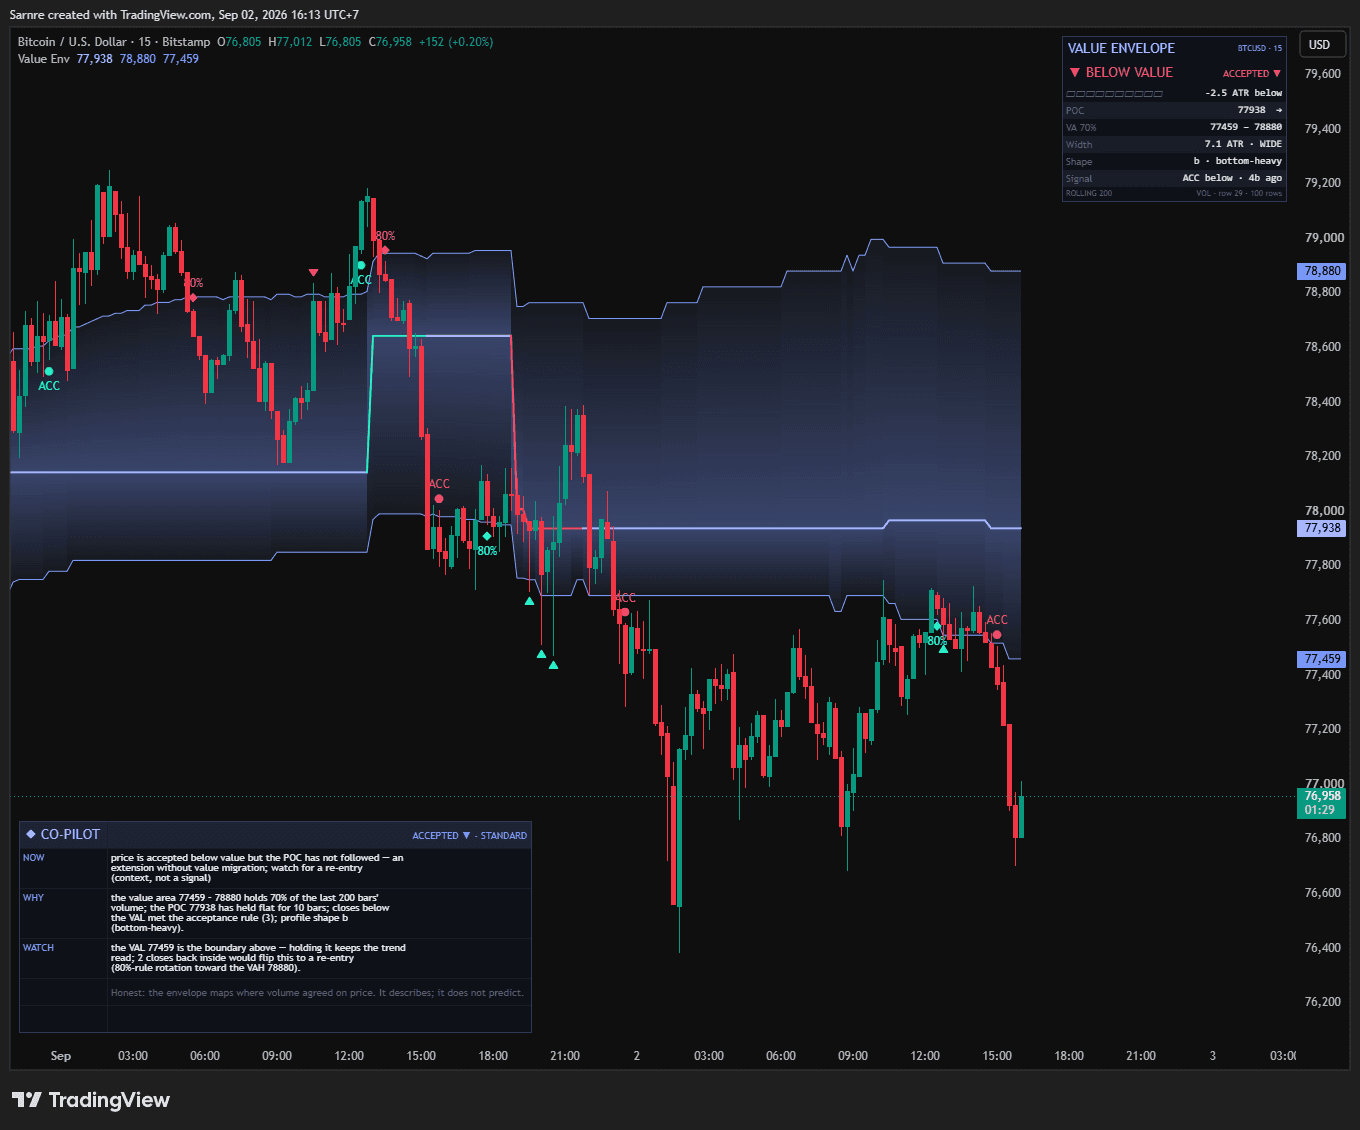
The main activity area. VAH is its upper edge; VAL is its lower edge.
POC marks the busiest price row. It is not necessarily halfway between the edges.
ACC records a hold outside. 80% names the return rule. REJ marks a specific failed-edge test.
“80%” is the rule’s name, not a probability for your chart. It does not mean the opposite edge will be reached eight times out of ten.
This example recalculates the rolling band from fictional candles. Try “More volume here”: the same close can become inside because the boundary moves. Earlier candles keep their own bands.
Price and volume both matter. Edit the same candle to recalculate its profile, then see whether its close completes acceptance or re-entry.
Each earlier candle keeps its own calculated bands. Only the rightmost candle is being edited.
The engine uses absolute price rows, a centre-nearest POC tie and two-row value expansion. Value covers 70 of 100 volume units; the extended area targets 90. Its current bounds are 87 to 100; the occupied range is 87 to 113.
The row height is 1, calibrated from ATR(50) and frozen for this epoch. POC migration reads flat, with a strict threshold of 1.59. POC placement gives shape P. These are calculated context, not orders.
Closes on VAH or VAL count as inside. Re-entry requires prior acceptance and consecutive inside closes. An interrupted count resets. Every historical close is compared with its own band; changing a count setting replays that same history.
Anchor resets, width-rank compression and alert delivery remain in the full manual. No session, feed or future-price simulator is implied here.
Illustrative inputs · changing a slider recalculates this example · no market feed
Copy once. Keep the full indicator. No signup here and no coding needed.
On a TradingView chart, open the Pine Editor and create a new indicator.
Replace the sample code with the source copied below.
Choose Add to chart, then save the script. Start with the default settings.
Copy the code as it is. No coding needed.
// ═══════════════════════════════════════════════════════════════════════════════
//  VALUE ENVELOPE — Market Profile Bands  ·  Pine Script v6
//  "An envelope like VWAP bands — but the boundaries are the MARKET PROFILE's own value area."
//
//  IDEA     A r/pinescript request: dynamic bands built from market-profile boundaries instead
//           of a mean ± σ. Value moves; the bands follow VALUE, not an average.
//  RUNS ON  any liquid chart, any timeframe. No volume on the feed? It becomes a TPO (time) profile.
//  STATUS   testable draft — compiles clean · non-repainting by construction · a CONTEXT tool,
//           not a signal engine (see docs/build-report.md). Decision support, never a prediction.
//
//  WHAT IT DRAWS — every bar, from a profile of the last N bars (or the current session):
//    POC line   the price where the most volume traded = the magnet
//    Value band the Value Area (70% of volume) = the fair-price envelope        ≈ "±1σ"
//    Extended   a wider 90% band = the edge of what the market still accepts    ≈ "±2σ"
//    Range      the full profile high/low = the outermost envelope              ≈ "±3σ"
//  WHAT IT READS — where price sits vs value · rejection / acceptance at the edges · the
//    "80% rule" re-entry · POC migration · value compression · profile shape (P / b / D)
//
//  ENGINE   an incremental volume-at-price histogram: each bar's volume is spread over the price
//           rows it touched; the bar leaving the window is subtracted. O(rows) per bar, so a
//           profile exists on EVERY bar (that is what makes the bands dynamic).
//
//  License: MIT — share freely, keep this header.  © 2026 ProEA Lab · built for r/pinescript
// ═══════════════════════════════════════════════════════════════════════════════
//@version=6
indicator("Value Envelope", "Value Env", overlay = true, max_labels_count = 50)

// ─────────────────────────────────────────────────────────────────── INPUTS · profile engine
gP = "Profile engine"
inMode     = input.string("Rolling", "Profile mode", options = ["Rolling", "Anchored"], group = gP,
     tooltip = "Rolling = the profile is rebuilt from the last N bars on EVERY bar — dynamic bands that glide with the market (the VWAP-band feel). Anchored = the profile restarts at each new day / week / month (like session VWAP) and grows through the period.", display = display.none)
inLen      = input.int(200, "Rolling window (bars)", minval = 20, maxval = 2000, group = gP,
     tooltip = "How many bars of volume build the profile in Rolling mode. 100–300 for intraday, 50–150 on daily charts.", display = display.none)
inAnchorTF = input.timeframe("D", "Anchor period", group = gP,
     tooltip = "Anchored mode only: the profile resets at each new period. Must be HIGHER than the chart timeframe — otherwise the script falls back to Rolling and says so in the dashboard footer.", display = display.none)
inVA       = input.int(70, "Value Area %", minval = 30, maxval = 90, step = 5, group = gP,
     tooltip = "The share of volume that defines VALUE. 70% is the Market Profile standard (about ±1σ of a bell curve).", display = display.none)
inVAX      = input.int(90, "Extended band %", minval = 60, maxval = 99, group = gP,
     tooltip = "A wider band around the same POC — the edge of what the market still accepts. Think ±2σ. Always at least 5% wider than the Value Area.", display = display.none)
inBinAtr   = input.float(0.15, "Row height (× ATR)", minval = 0.05, maxval = 2.0, step = 0.05, group = gP,
     tooltip = "Price resolution of the profile rows as a fraction of ATR(50). Smaller = smoother bands and a finer POC (a little noisier); larger = chunkier, more stable bands.", display = display.none)
inBinTicks = input.int(0, "…or fixed row height (ticks, 0 = auto)", minval = 0, group = gP,
     tooltip = "Force an exact row height in ticks (e.g. 4 = one point on ES). 0 = use the ATR-scaled height above.", display = display.none)
inWeight   = input.string("Auto", "Weighting", options = ["Auto", "Volume", "Time (TPO)"], group = gP,
     tooltip = "Volume = classic volume profile. Time (TPO) = every bar counts once — a true Market Profile / TPO chart. Auto = volume when the symbol has it, TPO when it does not (many FX / CFD feeds).", display = display.none)
inMinBars  = input.int(10, "Min bars before bands show", minval = 1, maxval = 100, group = gP,
     tooltip = "Anchored mode: hide the bands until the new profile has at least this many bars (a 1-bar profile means nothing).", display = display.none)
inRecal    = input.int(1500, "Re-size rows every N bars (Rolling)", minval = 0, maxval = 5000, group = gP,
     tooltip = "The ATR-scaled row height is frozen so the bands stay consistent; every N bars it re-sizes to current volatility and rebuilds. 0 = never.", display = display.none)

// ─────────────────────────────────────────────────────────────────── INPUTS · edge reading
gS = "Reading the edges"
inShowSig    = input.bool(true, "Show edge signals (REJ / ACC / 80%)", group = gS, display = display.none)
inAcceptBars = input.int(3, "Acceptance = N closes outside value", minval = 1, maxval = 10, group = gS,
     tooltip = "N consecutive closes above the VAH (or below the VAL) = the market ACCEPTED price outside value — the trend / imbalance read. 2 = the classic two-period rule (more signals, more whipsaw); 3 = calmer.", display = display.none)
inReentryBars = input.int(2, "80% rule = N closes back inside", minval = 1, maxval = 10, group = gS,
     tooltip = "After acceptance outside value, N consecutive closes back INSIDE fire the 80% rule — the classic Market Profile heuristic that price then tends to rotate across the whole value area. A heuristic, not a statistic for this chart.", display = display.none)
inMigLen     = input.int(10, "POC migration lookback (bars)", minval = 2, maxval = 100, group = gS,
     tooltip = "POC now vs POC N bars ago. A rising POC = value migrating up (buyers accepting higher prices); falling = the opposite.", display = display.none)
inSqueezePct = input.int(20, "Compressed = width rank below %", minval = 5, maxval = 50, group = gS,
     tooltip = "Value-area width ranked against its last 100 values. Below this percentile = COMPRESSED value → expansion watch.", display = display.none)

// ─────────────────────────────────────────────────────────────────── INPUTS · style
gV = "Style"
inView   = input.string("Clean", "View preset", options = ["Minimal", "Clean", "Pro", "Full"], group = gV,
     tooltip = "One-click look. Minimal = POC + value lines only. Clean = + gradient value band + edge signals. Pro = + extended 90% band + price tags. Full = + profile range + regime tint.", display = display.none)
inTheme  = input.string("Aurora Neon", "Theme", options = ["Aurora Neon", "Royal Gold", "Colorblind-safe"], group = gV, display = display.none)
inFill   = input.string("Gradient", "Band fill", options = ["Gradient", "Flat", "None"], group = gV,
     tooltip = "Gradient = densest at the POC, fading to the edges (reads like volume). Flat = one soft tint. None = lines only.", display = display.none)
inLine   = input.string("Smooth", "Line shape", options = ["Smooth", "Step"], group = gV,
     tooltip = "Smooth = connected lines, the envelope feel. Step = the honest staircase (profile rows move in whole bins).", display = display.none)
inPocMig = input.bool(true, "Colour POC by migration", group = gV,
     tooltip = "The POC line turns bull / bear when it moved up / down over the migration lookback; neutral when flat.", display = display.none)

// ─────────────────────────────────────────────────────────────────── INPUTS · dashboard
gD = "Dashboard"
inDash    = input.bool(true, "Show dashboard", group = gD, display = display.none)
inDashPos = input.string("Top Right", "Position", options = ["Top Right", "Top Left", "Bottom Right", "Bottom Left", "Middle Right", "Middle Left"], group = gD, display = display.none)
inSize    = input.string("Medium", "Size", options = ["Small", "Medium", "Large"], group = gD, display = display.none)
inZebra   = input.bool(true, "Row stripes", group = gD, display = display.none)

// ─────────────────────────────────────────────────────────────────── INPUTS · narrative
gN = "Narrative · Co-Pilot"
inNarr     = input.string("Standard", "Narrative depth", options = ["Off", "Brief", "Standard", "Detailed"], group = gN,
     tooltip = "A plain-language read of what the envelope says right now. Brief = headline · Standard = + why + watch · Detailed = + confidence, blind spots and a glossary. Display only — it translates the engine's state, it never adds a signal.", display = display.none)
inNarrPos  = input.string("Bottom Left", "Position", options = ["Bottom Left", "Bottom Right", "Top Left", "Top Right", "Middle Left", "Middle Right"], group = gN, display = display.none)
inNarrSize = input.string("Auto", "Size", options = ["Auto", "Small", "Medium", "Large"], group = gN, tooltip = "Auto = match the dashboard size.", display = display.none)
inNarrWrap = input.int(64, "Line width (characters)", minval = 30, maxval = 120, group = gN, display = display.none)

// ─────────────────────────────────────────────────────────────────── THEME (colour by role)
type Theme
    color bg       = #0B0E14
    color frame    = #B8923A
    color accent   = #D8B14A
    color accentHi = #E8C25A
    color up       = #2BE7C7
    color down     = #FF3B5C
    color flat     = #6B7280
    color txt      = #D7DCE6
    color txtHi    = #ECEFF5

themeOf(string name) =>
    Theme t = Theme.new()                       // defaults = Royal Gold
    if name == "Aurora Neon"
        t.bg       := #0E1118
        t.frame    := #2C3A5A
        t.accent   := #7C9CFF
        t.accentHi := #A9B8FF
        t.up       := #2AF0C8
        t.down     := #FF4D6D
        t.flat     := #5B6472
        t.txt      := #E6E9EF
        t.txtHi    := #F2F4F9
    else if name == "Colorblind-safe"           // Okabe-Ito: orange vs blue, safe for every CVD type
        t.bg       := #0E1014
        t.frame    := #3A4150
        t.accent   := #56B4E9
        t.accentHi := #8ED0F5
        t.up       := #E69F00
        t.down     := #0072B2
        t.flat     := #8C92A0
        t.txt      := #E8EAED
        t.txtHi    := #FFFFFF
    t
Theme th = themeOf(inTheme)

// view preset → which tiers draw (display only — never touches the engine)
bool vClean    = inView != "Minimal"
bool vPro      = inView == "Pro" or inView == "Full"
bool vFull     = inView == "Full"
bool showFill  = vClean and inFill != "None"
bool showGrad  = showFill and inFill == "Gradient"
bool showFlat  = showFill and inFill == "Flat"
bool showSig   = vClean and inShowSig
bool showExt   = vPro
bool showTags  = vPro
bool showRange = vFull
bool showTint  = vFull

// ═══════════════════════════════════════════════════════════════════ ENGINE
// An incremental volume-at-price histogram. `bins` is a contiguous array of rows; `base` is the
// absolute row index of bins[0]; row k covers price [k·w, (k+1)·w). Adding a bar spreads its
// weight over the rows it touched in proportion to overlap; removing subtracts the same amounts.
type Prof
    array<float> bins
    int   base   = 0
    float w      = na
    bool  ready  = false
    float total  = 0.0
    int   pocIdx = -1
    float poc    = na
    float vah    = na
    float val    = na
    float vahX   = na
    float valX   = na
    float pHi    = na
    float pLo    = na

// grow the row array so absolute rows kLo..kHi exist
profEnsure(Prof p, int kLo, int kHi) =>
    if array.size(p.bins) == 0
        p.base := kLo
        for k = kLo to kHi
            array.push(p.bins, 0.0)
    else
        if kLo < p.base
            for i = 1 to p.base - kLo
                array.unshift(p.bins, 0.0)
            p.base := kLo
        int top = p.base + array.size(p.bins) - 1
        if kHi > top
            for i = 1 to kHi - top
                array.push(p.bins, 0.0)

profAdd(Prof p, int k, float x) =>
    int i = k - p.base
    float nv = array.get(p.bins, i) + x
    array.set(p.bins, i, nv < 0 ? 0.0 : nv)

// spread one bar's weight across the rows it touched · sign = +1 add, −1 remove
profBar(Prof p, float h, float l, float v, float sign) =>
    if v > 0 and not na(h) and not na(l) and h >= l and p.w > 0
        int kLo = math.floor(l / p.w)
        int kHi = math.floor(h / p.w)
        profEnsure(p, kLo, kHi)
        if kHi == kLo
            profAdd(p, kLo, sign * v)
        else
            float span = h - l
            for k = kLo to kHi
                float bLo = k * p.w
                float ov  = math.min(h, bLo + p.w) - math.max(l, bLo)
                if ov > 0
                    profAdd(p, k, sign * v * ov / span)

// drop empty rows at both ends so the array IS the profile's price range
profTrim(Prof p) =>
    float tot = 0.0
    if array.size(p.bins) > 0
        tot := array.sum(p.bins)
    if tot <= 0
        array.clear(p.bins)
    float eps = tot * 1e-7
    while array.size(p.bins) > 0 and array.get(p.bins, 0) <= eps
        array.shift(p.bins)
        p.base := p.base + 1
    while array.size(p.bins) > 0 and array.last(p.bins) <= eps
        array.pop(p.bins)

// expand from the POC two rows at a time (the CBOT convention) until `target` weight is covered
profExpand(Prof p, int pi, float target) =>
    int n  = array.size(p.bins)
    int lo = pi
    int hi = pi
    float acc = array.get(p.bins, pi)
    while acc < target and (lo > 0 or hi < n - 1)
        float up = 0.0
        int upN = 0
        if hi + 1 <= n - 1
            up += array.get(p.bins, hi + 1)
            upN := 1
        if hi + 2 <= n - 1
            up += array.get(p.bins, hi + 2)
            upN := 2
        float dn = 0.0
        int dnN = 0
        if lo - 1 >= 0
            dn += array.get(p.bins, lo - 1)
            dnN := 1
        if lo - 2 >= 0
            dn += array.get(p.bins, lo - 2)
            dnN := 2
        bool takeUp = upN > 0 and (dnN == 0 or up >= dn)
        if takeUp
            hi  += upN
            acc += up
        else
            lo  -= dnN
            acc += dn
    [lo, hi]

// POC + value area + extended band + range → written into the Prof fields
profAnalyze(Prof p, float vaFrac, float extFrac) =>
    int n = array.size(p.bins)
    if n > 0
        float tot = 0.0
        float mx  = -1.0
        int   pi  = 0
        float mid = (n - 1) / 2.0
        for i = 0 to n - 1
            float v = array.get(p.bins, i)
            tot += v
            if v > mx or (v == mx and math.abs(i - mid) < math.abs(pi - mid))   // tie → the row nearest the centre
                mx := v
                pi := i
        p.total  := tot
        p.pocIdx := pi
        [lo1, hi1] = profExpand(p, pi, tot * vaFrac)
        [lo2, hi2] = profExpand(p, pi, tot * extFrac)
        p.poc  := (p.base + pi + 0.5) * p.w
        p.val  := (p.base + lo1) * p.w
        p.vah  := (p.base + hi1 + 1) * p.w
        p.valX := (p.base + lo2) * p.w
        p.vahX := (p.base + hi2 + 1) * p.w
        p.pLo  := p.base * p.w
        p.pHi  := (p.base + n) * p.w
    else
        p.total  := 0.0
        p.pocIdx := -1
        p.poc  := na
        p.val  := na
        p.vah  := na
        p.valX := na
        p.vahX := na
        p.pLo  := na
        p.pHi  := na

// ─────────────────────────────────────────────────────────────────── per-bar driver
// (every ta.* lives here at global scope — branches only gate the USE)
float atr    = ta.atr(50)
float cumVol = ta.cum(nz(volume, 0.0))
bool  anchorOK   = timeframe.in_seconds(inAnchorTF) > timeframe.in_seconds()
bool  rolling    = inMode == "Rolling" or not anchorOK
bool  anchorFlip = timeframe.change(inAnchorTF)
bool  useTPO     = inWeight == "Time (TPO)" or (inWeight == "Auto" and cumVol <= 0)
float wgt        = useTPO ? 1.0 : nz(volume, 0.0)
float tick       = syminfo.mintick
float wCal       = inBinTicks > 0 ? inBinTicks * tick : math.max(tick, math.round(math.max(atr, tick) * inBinAtr / tick) * tick)

var Prof prof = Prof.new(bins = array.new<float>())
var array<float> winH = array.new<float>()
var array<float> winL = array.new<float>()
var array<float> winV = array.new<float>()
var int profStart = na

// 1 · rolling window bookkeeping: remember this bar, drop the bar that leaves
float outH = na
float outL = na
float outV = na
if rolling
    array.push(winH, high)
    array.push(winL, low)
    array.push(winV, wgt)
    if array.size(winH) > inLen
        outH := array.shift(winH)
        outL := array.shift(winL)
        outV := array.shift(winV)

// 2 · calibration + resets (row height frozen per epoch so add/remove stay symmetric)
bool rebuild = false
if rolling
    if not prof.ready and bar_index >= inLen and not na(atr)
        prof.w     := wCal
        prof.ready := true
        rebuild    := true
    else if prof.ready and inRecal > 0 and bar_index % inRecal == 0
        prof.w  := wCal
        rebuild := true
else
    if anchorFlip or (not prof.ready and not na(atr))
        array.clear(prof.bins)
        prof.base  := 0
        prof.w     := wCal
        prof.ready := not na(atr)
        profStart  := bar_index

// 3 · update the histogram
if rebuild
    array.clear(prof.bins)
    prof.base := 0
    int nW = array.size(winH)
    if nW > 0
        for i = 0 to nW - 1
            profBar(prof, array.get(winH, i), array.get(winL, i), array.get(winV, i), 1.0)
else if prof.ready
    if rolling and not na(outV)
        profBar(prof, outH, outL, outV, -1.0)
    profBar(prof, high, low, wgt, 1.0)
if prof.ready
    profTrim(prof)
    profAnalyze(prof, inVA / 100.0, math.max(inVAX, inVA + 5) / 100.0)

int  nBars   = rolling ? inLen : na(profStart) ? 0 : bar_index - profStart + 1
int  nRows   = array.size(prof.bins)
bool bandsOK = prof.ready and nRows > 0 and (rolling or nBars >= inMinBars)

// engine outputs as plain series (history-referenceable, plottable)
float poc  = bandsOK ? prof.poc  : na
float vah  = bandsOK ? prof.vah  : na
float val  = bandsOK ? prof.val  : na
float vahX = bandsOK ? prof.vahX : na
float valX = bandsOK ? prof.valX : na
float pHi  = bandsOK ? prof.pHi  : na
float pLo  = bandsOK ? prof.pLo  : na
float binW = prof.w

// ═══════════════════════════════════════════════════════════════════ READ · price vs value
float atrU  = math.max(atr, tick)
float vaW   = vah - val
float vaPos = vaW > 0 ? (close - val) / vaW : na                  // 0 = at the VAL · 1 = at the VAH
int   loc   = na(vaPos) ? 0 : vaPos > 1 ? 2 : vaPos < 0 ? -2 : vaPos >= 0.5 ? 1 : -1
bool  atPoc = not na(poc) and math.abs(close - poc) <= binW

bool aboveVA  = not na(vah) and close > vah
bool belowVA  = not na(val) and close < val
bool insideVA = not na(vah) and not aboveVA and not belowVA
var int upCnt = 0
var int dnCnt = 0
var int inCnt = 0
upCnt := aboveVA  ? upCnt + 1 : 0
dnCnt := belowVA  ? dnCnt + 1 : 0
inCnt := insideVA ? inCnt + 1 : 0

// acceptance state machine — commits on CONFIRMED bars only (non-repainting)
var int    accept  = 0            // +1 accepted above value · −1 accepted below · 0 balance
var int    sigBar  = na
var string sigName = "none yet"
bool rejUp = false
bool rejDn = false
bool accUp = false
bool accDn = false
bool r80Up = false                // re-entry from BELOW value → 80%-rule rotation UP toward the VAH
bool r80Dn = false                // re-entry from ABOVE value → rotation DOWN toward the VAL
bool pokeUp = bandsOK and high > vah and close <= vah and high[1] <= nz(vah[1], high[1])
bool pokeDn = bandsOK and low  < val and close >= val and low[1]  >= nz(val[1], low[1])
if not rolling and anchorFlip
    accept := 0
if barstate.isconfirmed and bandsOK
    if accept == 0
        if upCnt >= inAcceptBars
            accept := 1
            accUp  := true
        else if dnCnt >= inAcceptBars
            accept := -1
            accDn  := true
        else
            rejUp := pokeUp
            rejDn := pokeDn
    else if accept == 1
        if inCnt >= inReentryBars
            accept := 0
            r80Dn  := true
        else if dnCnt >= inAcceptBars
            accept := -1
            accDn  := true
    else
        if inCnt >= inReentryBars
            accept := 0
            r80Up  := true
        else if upCnt >= inAcceptBars
            accept := 1
            accUp  := true
    if rejUp or rejDn or accUp or accDn or r80Up or r80Dn
        sigBar  := bar_index
        sigName := rejUp ? "REJ @VAH" : rejDn ? "REJ @VAL" : accUp ? "ACC above" : accDn ? "ACC below" : r80Up ? "80% ↑ to VAH" : "80% ↓ to VAL"
int sigAge = na(sigBar) ? na : bar_index - sigBar

// POC migration · value-area width · profile shape
float pocPrev = nz(poc[inMigLen], poc)
float pocChg  = poc - pocPrev
float migAtr  = pocChg / atrU
float migMin  = math.max(0.5 * binW, 0.25 * atrU)                  // at least a quarter-ATR (and one row) to call it migration
int   mig     = na(pocChg) ? 0 : pocChg > migMin ? 1 : pocChg < -migMin ? -1 : 0
float vaWatr  = vaW / atrU
float widthRank = ta.percentrank(vaW, 100)
bool  squeeze = not na(widthRank) and widthRank <= inSqueezePct and (rolling or nBars >= 50)
bool  wideVA  = not na(widthRank) and widthRank >= 100 - inSqueezePct
float skew    = vaW > 0 ? (poc - (vah + val) / 2) / (vaW / 2) : 0.0      // +1 POC at the top · −1 at the bottom
string shapeCode = not bandsOK ? "—" : skew > 0.3 ? "P" : skew < -0.3 ? "b" : "D"
string shapeWord = shapeCode == "P" ? "top-heavy" : shapeCode == "b" ? "bottom-heavy" : shapeCode == "D" ? "balanced" : "—"
bool pocXup = ta.crossover(close, poc)
bool pocXdn = ta.crossunder(close, poc)
bool squeezeOn = squeeze and not squeeze[1]

// words the dashboard + narrative share (one source of truth)
string locWord   = not bandsOK ? "WARMING UP" : atPoc ? "AT THE POC" : loc == 2 ? "ABOVE VALUE" : loc == -2 ? "BELOW VALUE" : loc == 1 ? "UPPER VALUE" : "LOWER VALUE"
string stateWord = not bandsOK ? "—" : accept == 1 ? "ACCEPTED ▲" : accept == -1 ? "ACCEPTED ▼" : loc == 2 or loc == -2 ? "PROBING" : squeeze ? "COMPRESSED" : "BALANCE"
color  locColor  = not bandsOK ? th.flat : atPoc ? th.txtHi : loc > 0 ? th.up : th.down
color  stateColor = accept == 1 ? th.up : accept == -1 ? th.down : loc == 2 or loc == -2 ? th.accentHi : th.txt

// ═══════════════════════════════════════════════════════════════════ CHART
color cPoc  = not inPocMig ? th.accentHi : mig > 0 ? th.up : mig < 0 ? th.down : th.accentHi
color cBand = th.accent
color cOff  = color.new(th.bg, 100)
lineSty = inLine == "Step" ? plot.style_steplinebr : plot.style_linebr     // *br = break at na, so a session reset shows a gap, not a diagonal

plPoc  = plot(poc,  "POC",           color = cPoc, linewidth = 2, style = lineSty)
plVah  = plot(vah,  "VAH · value high", color = color.new(cBand, 0),  linewidth = 1, style = lineSty)
plVal  = plot(val,  "VAL · value low",  color = color.new(cBand, 0),  linewidth = 1, style = lineSty)
plVahX = plot(vahX, "Extended high", color = showExt ? color.new(cBand, 55) : na, linewidth = 1, style = lineSty, display = display.pane)
plValX = plot(valX, "Extended low",  color = showExt ? color.new(cBand, 55) : na, linewidth = 1, style = lineSty, display = display.pane)
plot(pHi, "Profile high", color = showRange ? color.new(th.flat, 35) : na, linewidth = 1, style = lineSty, display = display.pane)
plot(pLo, "Profile low",  color = showRange ? color.new(th.flat, 35) : na, linewidth = 1, style = lineSty, display = display.pane)

// gradient: densest at the POC, fading to the edges (the only native gradient Pine has)
fill(plPoc, plVah, top_value = vah,  bottom_value = poc,  top_color = showGrad ? color.new(cBand, 93) : cOff, bottom_color = showGrad ? color.new(cBand, 62) : cOff, title = "Value · upper")
fill(plVal, plPoc, top_value = poc,  bottom_value = val,  top_color = showGrad ? color.new(cBand, 62) : cOff, bottom_color = showGrad ? color.new(cBand, 93) : cOff, title = "Value · lower")
fill(plVah, plVahX, top_value = vahX, bottom_value = vah, top_color = showGrad and showExt ? color.new(cBand, 98) : cOff, bottom_color = showGrad and showExt ? color.new(cBand, 88) : cOff, title = "Extended · upper")
fill(plValX, plVal, top_value = val,  bottom_value = valX, top_color = showGrad and showExt ? color.new(cBand, 88) : cOff, bottom_color = showGrad and showExt ? color.new(cBand, 98) : cOff, title = "Extended · lower")
fill(plVah, plVal,   color = showFlat ? color.new(cBand, 84) : na, title = "Value · flat")
fill(plVahX, plValX, color = showFlat and showExt ? color.new(cBand, 94) : na, title = "Extended · flat")

// edge signals — tiny triangles for rejections, labelled marks for the rare decisive events
plotshape(showSig and rejUp, "Rejection at VAH", shape.triangledown, location.abovebar, color = th.down, size = size.tiny, display = display.pane)
plotshape(showSig and rejDn, "Rejection at VAL", shape.triangleup,   location.belowbar, color = th.up,   size = size.tiny, display = display.pane)
plotshape(showSig and accUp, "Accepted above value", shape.circle,  location.belowbar, color = th.up,   text = "ACC", textcolor = th.up,   size = size.tiny, display = display.pane)
plotshape(showSig and accDn, "Accepted below value", shape.circle,  location.abovebar, color = th.down, text = "ACC", textcolor = th.down, size = size.tiny, display = display.pane)
plotshape(showSig and r80Up, "80% rule · rotation up",   shape.diamond, location.belowbar, color = th.up,   text = "80%", textcolor = th.up,   size = size.tiny, display = display.pane)
plotshape(showSig and r80Dn, "80% rule · rotation down", shape.diamond, location.abovebar, color = th.down, text = "80%", textcolor = th.down, size = size.tiny, display = display.pane)

bgcolor(showTint and accept == 1 ? color.new(th.up, 94) : showTint and accept == -1 ? color.new(th.down, 94) : na, title = "Regime tint")

// right-edge price tags (pooled: 3 labels, redrawn on the last bar)
fmt(float x) => str.tostring(x, format.mintick)
var label tagPoc = na
var label tagVah = na
var label tagVal = na
if barstate.islast
    if showTags and bandsOK
        int x = bar_index + 1
        string migG = mig > 0 ? " ↗" : mig < 0 ? " ↘" : ""
        if na(tagPoc)
            tagPoc := label.new(x, poc, "", style = label.style_label_left, size = size.tiny, textcolor = th.bg)
            tagVah := label.new(x, vah, "", style = label.style_label_left, size = size.tiny, textcolor = th.bg)
            tagVal := label.new(x, val, "", style = label.style_label_left, size = size.tiny, textcolor = th.bg)
        label.set_xy(tagPoc, x, poc)
        label.set_text(tagPoc, "POC " + fmt(poc) + migG)
        label.set_color(tagPoc, color.new(cPoc, 10))
        label.set_xy(tagVah, x, vah)
        label.set_text(tagVah, "VAH " + fmt(vah))
        label.set_color(tagVah, color.new(cBand, 25))
        label.set_xy(tagVal, x, val)
        label.set_text(tagVal, "VAL " + fmt(val))
        label.set_color(tagVal, color.new(cBand, 25))
    else if not na(tagPoc)
        label.delete(tagPoc)
        label.delete(tagVah)
        label.delete(tagVal)
        tagPoc := na
        tagVah := na
        tagVal := na

// ═══════════════════════════════════════════════════════════════════ DASHBOARD
posOf(string s) =>
    s == "Top Left" ? position.top_left : s == "Bottom Right" ? position.bottom_right : s == "Bottom Left" ? position.bottom_left : s == "Middle Right" ? position.middle_right : s == "Middle Left" ? position.middle_left : position.top_right
szLead() => inSize == "Small" ? size.small : inSize == "Large" ? size.large  : size.normal
szBody() => inSize == "Small" ? size.tiny  : inSize == "Large" ? size.normal : size.small
szSub()  => inSize == "Small" ? size.tiny  : inSize == "Large" ? size.small  : size.tiny

gauge(float p01, int segs) =>
    string out = ""
    int filled = na(p01) ? 0 : int(math.round(math.max(0.0, math.min(1.0, p01)) * segs))
    for i = 0 to segs - 1
        out := out + (i < filled ? "▰" : "▱")
    out

// key / value row with a subtle zebra so values never float
kv(table t, int row, string k, string v, color vc, string tip) =>
    color stripe = inZebra and row % 2 == 1 ? color.new(th.accent, 93) : th.bg
    table.cell(t, 0, row, k, text_color = th.flat, text_size = szBody(), text_halign = text.align_left, bgcolor = stripe, tooltip = tip)
    table.cell(t, 1, row, v, text_color = vc, text_size = szBody(), text_halign = text.align_right, text_font_family = font.family_monospace, bgcolor = stripe, tooltip = tip)

var table dash = table.new(posOf(inDashPos), 2, 12, bgcolor = th.bg, frame_color = th.frame, frame_width = 1, border_width = 0)
if barstate.islast and inDash
    table.clear(dash, 0, 0, 1, 11)
    int r = 0
    table.cell(dash, 0, r, "VALUE ENVELOPE", text_color = th.accentHi, text_size = szLead(), text_halign = text.align_left, bgcolor = th.bg, tooltip = "Market-profile bands: POC + value area recomputed on every bar.")
    table.cell(dash, 1, r, syminfo.ticker + " · " + timeframe.period, text_color = th.accent, text_size = szSub(), text_halign = text.align_right, bgcolor = th.bg)
    r += 1
    string heroGlyph = not bandsOK ? "·" : atPoc ? "●" : loc > 0 ? "▲" : "▼"
    table.cell(dash, 0, r, heroGlyph + " " + locWord, text_color = locColor, text_size = szLead(), text_halign = text.align_left, bgcolor = th.bg, tooltip = "Where the close sits relative to the value area (VAL → VAH).")
    table.cell(dash, 1, r, stateWord, text_color = stateColor, text_size = szBody(), text_halign = text.align_right, bgcolor = th.bg, tooltip = "BALANCE = rotating inside value · PROBING = outside but not yet accepted · ACCEPTED = closes outside value held · COMPRESSED = value width in its bottom percentile.")
    r += 1
    string posTxt = not bandsOK ? "—" : loc == 2 ? "+" + str.tostring((close - vah) / atrU, "0.0") + " ATR above" : loc == -2 ? str.tostring((close - val) / atrU, "0.0") + " ATR below" : str.tostring(vaPos * 100, "0") + "% of value"
    kv(dash, r, gauge(vaPos, 10), posTxt, th.txt, "Position inside value: 0% = the VAL, 100% = the VAH. Outside value it shows the distance in ATR.")
    r += 1
    string migG = mig > 0 ? "  ↗" : mig < 0 ? "  ↘" : "  →"
    kv(dash, r, "POC", (bandsOK ? fmt(poc) : "—") + migG, mig > 0 ? th.up : mig < 0 ? th.down : th.txt, "Point of Control — the price with the most " + (useTPO ? "time" : "volume") + " in the profile: the magnet. Arrow = migration over the last " + str.tostring(inMigLen) + " bars (" + str.tostring(migAtr, "0.0") + " ATR).")
    r += 1
    kv(dash, r, "VA " + str.tostring(inVA) + "%", bandsOK ? fmt(val) + " – " + fmt(vah) : "—", th.txt, "Value Area: the price band holding " + str.tostring(inVA) + "% of the profile's " + (useTPO ? "time" : "volume") + " — the fair-price envelope.")
    r += 1
    string widthTxt = not bandsOK ? "—" : str.tostring(vaWatr, "0.0") + " ATR · " + (squeeze ? "TIGHT" : wideVA ? "WIDE" : "NORMAL")
    kv(dash, r, "Width", widthTxt, squeeze ? th.accentHi : th.txt, "Value-area width in ATR. TIGHT = below the " + str.tostring(inSqueezePct) + "th percentile of its last 100 values (compressed → expansion watch). Rank now: " + (na(widthRank) ? "—" : str.tostring(widthRank, "0") + "%"))
    r += 1
    kv(dash, r, "Shape", shapeCode + " · " + shapeWord, th.txt, "P = volume built high (buyers accepted higher prices / short covering). b = volume built low (sellers accepted lower / long liquidation). D = balanced, two-sided.")
    r += 1
    string sigTxt = na(sigAge) ? "none yet" : sigName + " · " + str.tostring(sigAge) + "b ago"
    kv(dash, r, "Signal", sigTxt, na(sigAge) ? th.flat : sigAge <= 3 ? th.accentHi : th.txt, "Last edge event. REJ = poked outside value and closed back in. ACC = " + str.tostring(inAcceptBars) + " closes outside value. 80% = re-entered value after acceptance (rotation heuristic).")
    r += 1
    string modeTxt = rolling ? (inMode == "Anchored" ? "ANCHOR ≤ TF → ROLLING " : "ROLLING ") + str.tostring(inLen) : str.upper(inAnchorTF) + " · " + str.tostring(nBars) + "b"
    table.cell(dash, 0, r, modeTxt, text_color = th.flat, text_size = szSub(), text_halign = text.align_left, bgcolor = th.bg, tooltip = "Profile mode and how many bars feed it.")
    table.cell(dash, 1, r, (useTPO ? "TPO" : "VOL") + " · row " + fmt(binW) + " · " + str.tostring(nRows) + " rows", text_color = th.flat, text_size = szSub(), text_halign = text.align_right, bgcolor = th.bg, tooltip = "Weighting (volume or time-at-price), the row height and how many price rows the profile spans right now.")

// ═══════════════════════════════════════════════════════════════════ NARRATIVE · Co-Pilot
// Translates the state above into plain language. Reads the SAME variables the chart draws;
// never computes a new signal. Context tool → it narrates where value is, never "buy / sell".
wrap(string s, int width) =>
    array<string> words = str.split(s, " ")
    string out  = ""
    string line = ""
    for wd in words
        if line != "" and str.length(line) + str.length(wd) + 1 > width
            out  := out + (out == "" ? "" : "\n") + line
            line := wd
        else
            line := line == "" ? wd : line + " " + wd
    out == "" ? line : out + "\n" + line

// ✏️ TUNE ME — the playbook sentences. Wording only: the states come from the engine above.
narrNow() =>
    string s = ""
    if not bandsOK
        s := "the profile is still warming up — no read yet"
    else if accept == 1
        s := mig > 0 ? "price is accepted above value and the POC is migrating up — a trend read; the VAH below is where buyers last showed up" : "price is accepted above value but the POC has not followed — an extension without value migration; watch for a re-entry"
    else if accept == -1
        s := mig < 0 ? "price is accepted below value and the POC is migrating down — a trend read; the VAL above is where sellers last showed up" : "price is accepted below value but the POC has not followed — an extension without value migration; watch for a re-entry"
    else if loc == 2
        s := "price is probing above value, not yet accepted — " + str.tostring(inAcceptBars) + " closes above the VAH would confirm, a close back inside would call it a rejection"
    else if loc == -2
        s := "price is probing below value, not yet accepted — " + str.tostring(inAcceptBars) + " closes below the VAL would confirm, a close back inside would call it a rejection"
    else if squeeze
        s := "balance with a compressed value area — the range is tight against recent history; expansion watch, direction unknown"
    else if atPoc
        s := "price is sitting on the POC — fair price, the busiest level; there is no edge in the middle, value gets tested at its edges"
    else if loc == 1
        s := "price is rotating inside value, upper half — balance; the playbook here is responsive: the VAH tends to get faded back toward the POC until acceptance says otherwise"
    else
        s := "price is rotating inside value, lower half — balance; the playbook here is responsive: the VAL tends to get faded back toward the POC until acceptance says otherwise"
    s

anchorWord() =>
    inAnchorTF == "D" ? "daily" : inAnchorTF == "W" ? "weekly" : inAnchorTF == "M" ? "monthly" : inAnchorTF + "-period"

narrWhy() =>
    string src  = useTPO ? "time-at-price" : "volume"
    string span = rolling ? "the last " + str.tostring(inLen) + " bars' " + src : "this " + anchorWord() + " profile's " + src + " (" + str.tostring(nBars) + " bars so far)"
    string base = "the value area " + fmt(val) + " – " + fmt(vah) + " holds " + str.tostring(inVA) + "% of " + span + "; the POC " + fmt(poc)
    string migS = mig > 0 ? " rose " + str.tostring(math.abs(migAtr), "0.0") + " ATR over " + str.tostring(inMigLen) + " bars" : mig < 0 ? " fell " + str.tostring(math.abs(migAtr), "0.0") + " ATR over " + str.tostring(inMigLen) + " bars" : " has held flat for " + str.tostring(inMigLen) + " bars"
    string accS = accept == 1 ? "; closes above the VAH met the acceptance rule (" + str.tostring(inAcceptBars) + ")" : accept == -1 ? "; closes below the VAL met the acceptance rule (" + str.tostring(inAcceptBars) + ")" : ""
    string shpS = "; profile shape " + shapeCode + " (" + shapeWord + ")"
    base + migS + accS + shpS + "."

narrWatch() =>
    string s = ""
    if accept == 1
        s := "the VAH " + fmt(vah) + " is the boundary below — holding it keeps the trend read; " + str.tostring(inReentryBars) + " closes back inside would flip this to a re-entry (80%-rule rotation toward the VAL " + fmt(val) + ")."
    else if accept == -1
        s := "the VAL " + fmt(val) + " is the boundary above — holding it keeps the trend read; " + str.tostring(inReentryBars) + " closes back inside would flip this to a re-entry (80%-rule rotation toward the VAH " + fmt(vah) + ")."
    else if loc == 2
        s := str.tostring(inAcceptBars) + " closes above the VAH " + fmt(vah) + " = acceptance; a close back inside = rejection, with the POC " + fmt(poc) + " as the magnet below."
    else if loc == -2
        s := str.tostring(inAcceptBars) + " closes below the VAL " + fmt(val) + " = acceptance; a close back inside = rejection, with the POC " + fmt(poc) + " as the magnet above."
    else
        s := "the VAH " + fmt(vah) + " caps value above, the VAL " + fmt(val) + " floors it below, the POC " + fmt(poc) + " is the magnet in the middle" + (squeeze ? "; width is compressed (rank " + str.tostring(widthRank, "0") + "%), so a break of either edge carries more weight." : ".")
    s

narrConf01() =>
    float c = na
    if bandsOK
        if accept != 0
            bool migAgree = (accept == 1 and mig > 0) or (accept == -1 and mig < 0)
            bool stillOut = (accept == 1 and loc == 2) or (accept == -1 and loc == -2)
            c := 0.45 + (migAgree ? 0.30 : 0.0) + (stillOut ? 0.15 : -0.15)
        else if loc == 2 or loc == -2
            c := 0.30
        else
            float dPoc = vaW > 0 ? math.abs(close - poc) / (vaW / 2) : 1.0
            c := 0.50 + 0.40 * math.max(0.0, 1.0 - dPoc)       // nearer the POC = clearer balance
    c
confWord(float c) => na(c) ? "no clean read" : c >= 0.66 ? "high" : c >= 0.34 ? "moderate" : "low"

narrPosOf(string s) =>
    s == "Top Left" ? position.top_left : s == "Top Right" ? position.top_right : s == "Bottom Right" ? position.bottom_right : s == "Middle Left" ? position.middle_left : s == "Middle Right" ? position.middle_right : position.bottom_left
narrBodySz() => inNarrSize == "Small" ? size.small : inNarrSize == "Medium" ? size.normal : inNarrSize == "Large" ? size.large : szBody()
narrHeadSz() => inNarrSize == "Small" ? size.normal : inNarrSize == "Medium" ? size.large : inNarrSize == "Large" ? size.large : szLead()

var table narrT = na
if barstate.islast
    if not na(narrT)
        table.delete(narrT)
        narrT := na
    if inNarr != "Off"
        array<string> labs = array.new<string>()
        array<string> vals = array.new<string>()
        array.push(labs, "NOW")
        array.push(vals, wrap(narrNow() + " (context, not a signal)", inNarrWrap))
        bool deep = inNarr == "Standard" or inNarr == "Detailed"
        if deep and bandsOK
            array.push(labs, "WHY")
            array.push(vals, wrap(narrWhy(), inNarrWrap))
            array.push(labs, "WATCH")
            array.push(vals, wrap(narrWatch(), inNarrWrap))
        if inNarr == "Detailed"
            float c01 = narrConf01()
            string blind = "news, real order flow, depth, the next tick" + (rolling ? "; a rolling window lags by design" : nBars < 50 ? "; a young session profile is thin" : "")
            array.push(labs, "CONFIDENCE")
            array.push(vals, wrap(confWord(c01) + "  " + gauge(c01, 5) + "  ·  can't see: " + blind + ".", inNarrWrap))
            array.push(labs, "GLOSSARY")
            array.push(vals, wrap("POC = the price with the most " + (useTPO ? "time" : "volume") + " (the magnet). Value area = where " + str.tostring(inVA) + "% of it traded (fair price). Acceptance = closes outside value that hold. 80% rule = a re-entry into value that tends to rotate across it — a heuristic, not a promise.", inNarrWrap))
        int nr = array.size(labs)
        bool atBottom = inNarrPos == "Bottom Left" or inNarrPos == "Bottom Right"
        int rows = nr + 2 + (atBottom ? 1 : 0)
        narrT := table.new(narrPosOf(inNarrPos), 2, rows, bgcolor = th.bg, frame_color = th.frame, frame_width = 1, border_color = color.new(th.frame, 70), border_width = 1)
        table.cell(narrT, 0, 0, "◆ CO-PILOT", text_color = th.accentHi, bgcolor = color.new(th.accent, 88), text_size = narrHeadSz(), text_halign = text.align_left)
        table.cell(narrT, 1, 0, stateWord + " · " + str.upper(inNarr), text_color = th.accent, bgcolor = color.new(th.accent, 88), text_size = narrBodySz(), text_halign = text.align_right)
        for i = 0 to nr - 1
            table.cell(narrT, 0, i + 1, array.get(labs, i), text_color = th.accent, bgcolor = th.bg, text_size = narrBodySz(), text_halign = text.align_left, text_valign = text.align_top)
            table.cell(narrT, 1, i + 1, array.get(vals, i), text_color = th.txt, bgcolor = th.bg, text_size = narrBodySz(), text_halign = text.align_left, text_valign = text.align_top)
        table.cell(narrT, 0, nr + 1, "", bgcolor = th.bg)
        table.cell(narrT, 1, nr + 1, "Honest: the envelope maps where " + (useTPO ? "time" : "volume") + " agreed on price. It describes; it does not predict.", text_color = th.flat, bgcolor = th.bg, text_size = narrBodySz(), text_halign = text.align_left)
        if atBottom
            table.cell(narrT, 0, nr + 2, " ", bgcolor = th.bg)
            table.cell(narrT, 1, nr + 2, " ", bgcolor = th.bg)

// ═══════════════════════════════════════════════════════════════════ ALERTS
alertcondition(rejUp, "Rejection at VAH",          "Value Envelope: price poked above the VAH and closed back inside value (rejection)")
alertcondition(rejDn, "Rejection at VAL",          "Value Envelope: price poked below the VAL and closed back inside value (rejection)")
alertcondition(accUp, "Accepted above value",      "Value Envelope: closes above the VAH met the acceptance rule — trend / imbalance read")
alertcondition(accDn, "Accepted below value",      "Value Envelope: closes below the VAL met the acceptance rule — trend / imbalance read")
alertcondition(r80Up, "80% rule · rotation up",    "Value Envelope: re-entered value from below — 80%-rule rotation toward the VAH (heuristic)")
alertcondition(r80Dn, "80% rule · rotation down",  "Value Envelope: re-entered value from above — 80%-rule rotation toward the VAL (heuristic)")
alertcondition(pocXup and barstate.isconfirmed, "POC cross up",   "Value Envelope: close crossed above the POC")
alertcondition(pocXdn and barstate.isconfirmed, "POC cross down", "Value Envelope: close crossed below the POC")
alertcondition(squeezeOn and barstate.isconfirmed, "Value compressed", "Value Envelope: value-area width dropped into its compressed percentile — expansion watch")
// one human-readable alert() for webhooks / Telegram (choose "Any alert() function call")
if barstate.isconfirmed and (rejUp or rejDn or accUp or accDn or r80Up or r80Dn)
    alert("Value Envelope · " + syminfo.ticker + " " + timeframe.period + " · " + sigName + " · " + narrNow(), alert.freq_once_per_bar_close)
Rolling mode needs a full window behind it—200 candles by default—plus the initial calculation. Anchored mode waits for at least 10 candles in the new period by default. Also check the symbol’s data and your selected weighting.
The full explanation is here when you need it.
The tool spreads each candle’s activity across price rows in proportion to how much of its high–low range overlaps each row. This is an estimate, not a record of the exact trades at each price.
The busiest row becomes the POC. Equal-volume ties choose the row nearest the occupied range’s center. Starting there, the tool compares two neighboring rows above with two below and expands toward the larger total; equal totals expand upward.
The inner band targets at least 70% of the activity by default. Whole rows can take it past that target. The extended band targets 90%, or at least five percentage points more than the inner setting. Its price edges can still coincide with the inner edges.
Rolling mode uses the latest 200 candles by default. Anchored mode starts again each day by default. Each candle keeps the band calculated for that time; old closes are not reclassified against today’s band.
VWAP follows a volume-weighted average price. Bollinger Bands use a moving average and price variation. Value Envelope finds a busy price row and an activity area around it.
Its edges are not standard deviations, and its POC need not be centered. The bands can look similar while describing different things.
ACC · acceptance: three consecutive confirmed closes above VAH or below VAL by default. The accepted state stays active until a return completes or enough closes establish acceptance on the opposite side.
80% · re-entry: after acceptance, two consecutive closes inside value by default. A close exactly on VAH or VAL is inside. An interrupted count resets; completing the return clears the accepted state.
REJ · rejection: while no accepted state is active, the candle first pokes beyond an edge and closes back across that edge. The preceding candle must not already have poked beyond its own corresponding edge. Acceptance takes priority.
The rejection close can even pass through the whole band; it need not finish inside it. A wick touch or a return inside does not always print REJ. Some short on-chart descriptions simplify this rule.
These marks record closed-candle events. They do not place entries or confirm that a later target is reached.
POC migration: compare the busiest line with 10 candles ago by default. Up or down requires a move greater than the larger of half a price row or a quarter of ATR. Smaller moves read as flat.
Shape: P means the POC sits toward the upper part of value; b means lower; D means more central. It is a shortcut based on POC position, not proof of who bought, sold or closed a position.
Compression: the value-area width ranks at or below the 20th percentile of its last 100 readings by default. Anchored mode also needs 50 profile candles. Narrow does not tell you when or which way price will break out.
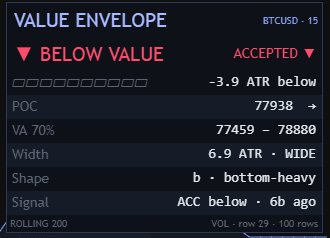
Read location first: where the close is now. The gauge shows its position inside value, or its distance outside in ATR. The other rows show POC and its movement, the area’s edges, width, shape and the last event with its age.
The footer shows mode, candle count, weighting, row height and row count. A SIGNAL row reports an earlier event; check how many candles ago it happened.
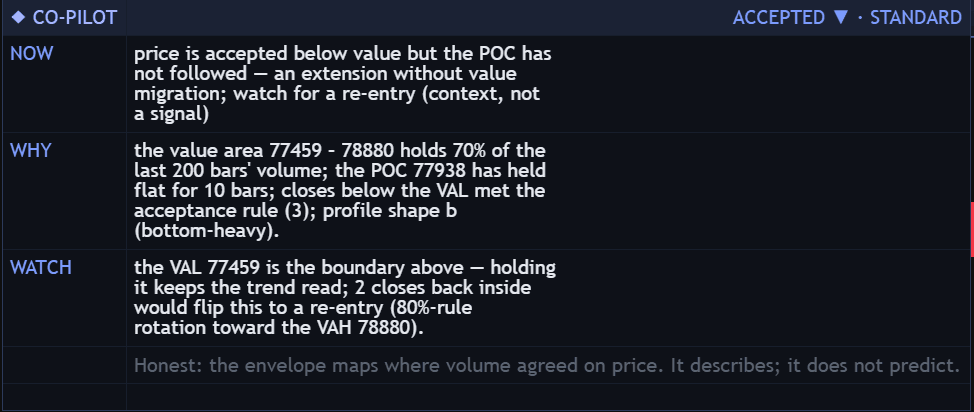
NOW describes the current state. WHY lists the readings behind it. WATCH names relevant levels and the next condition that would change the read.
Detailed mode adds confidence, blind spots and a glossary. Confidence is a hand-coded context rating, not a measured chance of success. This panel translates the same calculations; it does not add an independent prediction.
Start with the defaults, then change one setting at a time. No preset establishes that a trading plan is profitable.
A larger value-area percentage targets more activity; it does not establish that its edges are stronger. Row height stays fixed within an epoch and recalibration can change the band in visible steps.
These are study ideas, not instructions to enter. Define your own entry, exit, trade size and maximum loss.
Watch a failed edge test, then record whether price moves inward or leaves again. A REJ mark alone is not enough to establish a trade.
After a hold outside, compare later closes and POC migration. Acceptance describes the completed count; continuation remains uncertain.
Study a confirmed return after acceptance. The opposite edge is a reference for the rotation idea, not a promised destination.
Mark periods of narrow value and observe what follows. Keep both directions and failed moves in your records.
Compare the band with levels already in your plan or another timeframe. More overlapping references do not by themselves prove a better trade.
Choose Value Envelope in TradingView’s alert dialog. The script provides nine named conditions:
Use Once Per Bar Close when creating a named-condition alert. These conditions use confirmed bars; the alerts describe an event, not a filled order.
Any alert() function call sends a readable message containing symbol, timeframe, event and the Co-Pilot’s NOW sentence. It covers only the six rejection, acceptance and re-entry events. POC-cross and compression alerts require their named conditions.
Volume and price feeds differ. In Auto mode, the tool falls back to one weight per candle only when cumulative available volume is zero. A single zero-volume candle does not switch a populated feed to TPO.
TPO here spreads that weight across the candle’s range. It does not measure the actual time or trades at each price. The profile cannot identify traders or reveal real order flow.
The newest band can change while its candle is still open. Closed history stays tied to its own calculation. Changing inputs or data can recalculate history; rolling windows lag, and anchored profiles restart each period.
The tool describes the chart—never what price will do next. There is no backtest and no out-of-sample validation behind these rules. This is research tooling, not financial advice.
What shipped and what changed in Value Envelope, newest first. Ask for the next change below; what gets built lands here with a date, and on the lab queue on the front page.
Value Envelope Shipped
Shows how the area containing most estimated volume changes.
A small friction or a big idea. Tell us what would make this tool work better for you.
Requests for a new tool go on the same queue: see what is asked for and what is being built.